1. KEYINDUSTRIES:
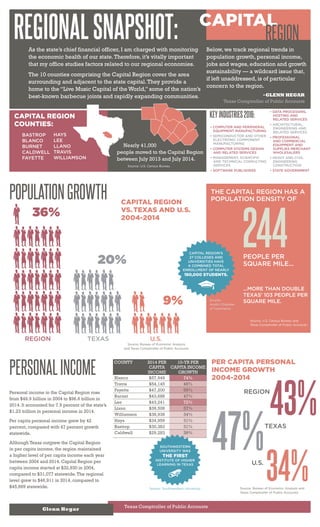
POPULATIONGROWTH CAPITAL REGION
VS.TEXAS AND U.S.
2004-2014
34%
43%
47%
REGION
TEXAS
U.S.
PER CAPITA PERSONAL
INCOME GROWTH
2004-2014
Source: Bureau of Economic Analysis and
Texas Comptroller of Public Accounts
REGIONALSNAPSHOT:As the state’s chief financial officer, I am charged with monitoring
the economic health of our state.Therefore, it’s vitally important
that my office studies factors related to our regional economies.
The 10 counties comprising the Capital Region cover the area
surrounding and adjacent to the state capital.They provide a
home to the “Live Music Capital of the World,” some of the nation’s
best-known barbecue joints and rapidly expanding communities.
CAPITAL
Below, we track regional trends in
population growth, personal income,
jobs and wages, education and growth
sustainability — a wildcard issue that,
if left unaddressed, is of particular
concern to the region.
REGION
-GLENN HEGAR
Texas Comptroller of Public Accounts
PERSONALINCOME
Personal income in the Capital Region rose
from $49.9 billion in 2004 to $96.6 billion in
2014. It accounted for 7.9 percent of the state’s
$1.23 trillion in personal income in 2014.
Per capita personal income grew by 42
percent, compared with 47 percent growth
statewide.
Although Texas outgrew the Capital Region
in per capita income, the region maintained
a higher level of per capita income each year
between 2004 and 2014. Capital Region per
capita income started at $32,930 in 2004,
compared to $31,077 statewide.The regional
level grew to $46,911 in 2014, compared to
$45,669 statewide.
Glenn Hegar
Texas Comptroller of Public Accounts
BASTROP
BLANCO
BURNET
CALDWELL
FAYETTE
HAYS
LEE
LLANO
TRAVIS
WILLIAMSON
THE CAPITAL REGION HAS A
POPULATION DENSITY OF
244
Source: Bureau of Economic Analysis
and Texas Comptroller of Public Accounts
REGION
36%
U.S.
9%
TEXAS
20%
• DATA PROCESSING,
HOSTING AND
RELATED SERVICES
• ARCHITECTURAL,
ENGINEERING AND
RELATED SERVICES
• PROFESSIONAL
AND COMMERCIAL
EQUIPMENT AND
SUPPLIES MERCHANT
WHOLESALERS
• HEAVY AND CIVIL
ENGINEERING
CONSTRUCTION
• STATE GOVERNMENT
CAPITAL REGION
COUNTIES:
Source: U.S. Census Bureau
Source:
Austin Chamber
of Commerce
Nearly 41,000
people moved to the Capital Region
between July 2013 and July 2014.
CAPITAL REGION’S
27 COLLEGES AND
UNIVERSITIES HAVE
A COMBINED TOTAL
ENROLLMENT OF NEARLY
180,000 STUDENTS.
COUNTY 2014 PER
CAPITA
INCOME
10-YR PER
CAPITA INCOME
GROWTH
Blanco $57,949 74%
Travis $54,145 46%
Fayette $47,200 59%
Burnet $43,688 47%
Lee $43,241 72%
Llano $39,508 57%
Williamson $38,938 34%
Hays $34,959 31%
Bastrop $30,383 31%
Caldwell $29,283 39%
...MORE THAN DOUBLE
TEXAS’ 103 PEOPLE PER
SQUARE MILE.
PEOPLE PER
SQUARE MILE...
Source: U.S. Census Bureau and
Texas Comptroller of Public Accounts
KEYINDUSTRIES2016:
• COMPUTER AND PERIPHERAL
EQUIPMENT MANUFACTURING
• SEMICONDUCTOR AND OTHER
ELECTRONIC COMPONENT
MANUFACTURING
• COMPUTER SYSTEMS DESIGN
AND RELATED SERVICES
• MANAGEMENT, SCIENTIFIC
AND TECHNICAL CONSULTING
SERVICES
• SOFTWARE PUBLISHERS
Source: Southwestern University
SOUTHWESTERN
UNIVERSITY WAS
THE FIRST
INSTITUTE OF HIGHER
LEARNING IN TEXAS
2. Three counties — Travis,
Williamson and Hays —
produced 87 percent
of public
high school
graduates.
In 2014, the Capital
Region had two
independent
school districts
— Austin and Round Rock
— with more than 7,000
high school graduates.
In the same year, these two
ISDs produced 37 percent of
all public high school graduates
in the Capital Region.
JOBS&WAGES
The Capital Region added
nearly 237,000 jobs from 2004
to 2014, a 33.3 percent increase
and six times the national job
growth during this period.
Williamson and Hays counties
led the region in percent job
gains with 67.4 percent and 51.7
percent, respectively.
The 2014 regional average wage
of $52,782 was slightly higher
than the state
average of
$52,537.
With a hip urban center surrounded
by quaint communities, the Capital
Region has a strong economy
and many thriving industries that
continue to draw new residents.
And no wonder.The region offers
plenty of live music, prominent
To see a complete list of these regions, plus
more in-depth county-by-county data, visit:THE CAPITAL REGION IS ONE OF THE
COMPTROLLER’S 12 ECONOMIC REGIONS.
TEXASAHEAD.ORG/REGIONALRPTS
CONCLUSION
restaurants and tourist attractions.
Yet the very things that make this
region so successful are putting a
strain on its infrastructure.
Newcomers — and current
residents — face rising home
prices and congested roadways.
The region must depend on its
JOB GROWTH
2004-2014
Source: Economic Modeling Specialists Intl.
Glenn Hegar
Texas Comptroller of Public Accounts
96-1779-9 (9/16)
GROWTH
SUSTAINABILITY
HOUSING • According to the Austin Board
of Realtors, average home prices in the
Central Texas area were 8 percent higher
in February 2016 than in February 2015.
The median home price of $269,900 was 8
percent higher than in February 2015.The
Austin-Round Rock metropolitan statistical
area (MSA) had the highest median gross
rent of all MSAs in Texas every year from
2009 to 2013.
TRANSPORTATION • Austin ranked fourth
most congested in the U.S. in a recent
traffic study, and is the only Texas city to
appear in the top 10.Texas Department of
Transportation metrics show the portion of
IH-35 that cuts through Travis County is at
or near the top of the state’s most crowded
highway segments.
highly educated workforce to keep
wages outpacing housing costs and
it will also need to solve regional
transportation issues.
Overall, the Capital Region
appears well poised to continue its
remarkable expansion.
EDUCATION
CAPITAL REGION
PUBLIC HIGH SCHOOL
GRADUATES, 2014
21.7%
5.5%U.S.
TEXAS
33.3%
FOR
THREE YEARS IN A ROW,
THE U.S. CENSUS HAS
NAMED SAN MARCOS AS
THE COUNTRY’S FASTEST-
GROWING CITY WITH
A POPULATION
OF MORE THAN
50,000.
CAPITALREGION
HAYS
COUNTY
TRAVIS
COUNTY
WILLIAMSON
COUNTY
REGIONAL POPULATION GROWTH, 2004 - 2014
Source: Bureau of Economic Analysis and Texas Comptroller of Public Accounts
41%
35%
13% 10%
OTHER 7
COUNTIES
0 5% 10% 15% 20% 25% 30% 35%
TEXAS AVERAGE • 20.4%
CAPITAL 35.9%
GULF COAST 25.7%
ALAMO 22.9%
METROPLEX 21.9%
WEST 18.1%
SOUTH 16.5%
UPPER RIO 15.5%
CENTRAL 14.6%
HIGH PLAINS 7.9%
UPPER EAST 7.1%
SOUTHEAST 2.6%
NORTHWEST 0.9%
U.S. AVERAGE • 8.9%
Total does not add to 100% due to rounding
Source: Texas Education Agency and
Texas Comptroller of Public Accounts