01 lecture czd
•Download as PPT, PDF•
0 likes•429 views

Lecture PowerPoint for first day of class GRY 1050.

Recommended
More Related Content
What's hot
What's hot (20)
Similar to 01 lecture czd
Similar to 01 lecture czd (20)
Recently uploaded
Recently uploaded (20)
01 lecture czd
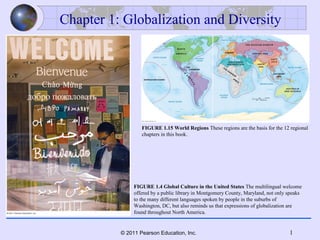
- 1. 11© 2011 Pearson Education, Inc. FIGURE 1.15 World Regions These regions are the basis for the 12 regional chapters in this book. Chapter 1: Globalization and Diversity FIGURE 1.4 Global Culture in the United States The multilingual welcome offered by a public library in Montgomery County, Maryland, not only speaks to the many different languages spoken by people in the suburbs of Washington, DC, but also reminds us that expressions of globalization are found throughout North America.
- 2. 22© 2011 Pearson Education, Inc. Learning Objectives • Understand framework for studying world regional geography • Examine varied aspects of globalization – Environmental, cultural, geopolitical, economic, social • Understand the following models and terms – Demographic transition – Measures of population growth and change – Measures of economic development – Indicators of social development – State, nation, and nation-state – Culture – Core-periphery model
- 3. 33© 2011 Pearson Education, Inc. Diversity Amid Globalization • Globalization: the increasing interconnectedness of people and places through the converging processes of economic, political, and cultural change • Converging currents of globalization – Communications and transportation – Economic transformation • Multinational corporations, financial institutions • Global free-trade agreements • Market economies and privatization • Global markets • Globalization of labor FIGURE 1.1 Global Communications South Indian family rents out TV viewing time. FIGURE 1.7 Protest Against Globalization This took place at a Washington, DC, meeting of the World Bank and IMF.
- 4. 44© 2011 Pearson Education, Inc. • Globalization may threaten local diversity • Globalization can cause tension between traditional cultures and external globalizing influences – Examples: clothing, food, movies – Many global goods and services originate in North America • Hybridization or syncretism: sometimes occurs when forms of American popular culture spread abroad then are melded with local cultural traditions FIGURE 1.3 Global Shopping Malls Once a fixture only of suburban North America, the shopping mall is now found worldwide. This mall is in the city of Kunming, in China’s Yunnan province. Globalization and Cultural Change
- 5. 55© 2011 Pearson Education, Inc. • Globalization and geopolitics – United Nations provides representation to all countries – International agreements promote global trade and cultural exchange • Environmental concerns – Globalized economy, transnational corporations create environmental problems, disrupt local ecosystems – Native peoples may lose resource base – Globalization aggravates world environmental problems (climate change, air and water pollution, deforestation) – International treaties may help Globalization and Cultural Change (cont.)
- 6. 66© 2011 Pearson Education, Inc. • Social dimensions – Increased international migration – Criminal element of globalization • Globalization of terrorism, drugs, gambling, pornography, and prostitution FIGURE 1.6 The Global Drug Trade Globalization and Cultural Change (cont.)
- 7. 77© 2011 Pearson Education, Inc. • The pro-globalization stance (advantages) – Globalization is logical expression of capitalism – Removing trade barriers will increase efficiency, spread new technology and ideas – Free flow of capital will enhance global economic wealth – The world’s poorer countries will catch up through globalization Advocates and Critics of Globalization FIGURE 1.10 World Trade Organization (WTO) The WTO, created in 1995, is one of the most powerful institutions of economic globalization. It oversees trade agreements, encourages open markets, enforces trade rules, and settles disputes.
- 8. 88© 2011 Pearson Education, Inc. • Critics of globalization (disadvantages) – Today’s core, developed countries did not use globalization’s free-market economic model to foster their own development – Globalization promotes free-market, export-oriented economies at the expense of local, indigenous economies, creating greater inequalities – Spreads undesirable things (disease, crime, harmful plants and animals) • A middle position? – Globalization is probably unavoidable but can be managed – Even anti-globalization forces use the global reach of the Internet to oppose globalization – Strong and efficient governments, international organizations, and watchdog groups can help manage globalization Advocates and Critics of Globalization (cont.)
- 9. 99© 2011 Pearson Education, Inc. • Diversity in a globalizing world – The world is still a diverse place, in spite of homogenization • Language, religion, politics, economics • Foods, architecture, urban form – Ethnic and cultural differences contribute to separatist political movements FIGURE 1.14 Tribal Warfare Rebels from the Sudan Liberation Movement (SLM) declared war against the Sudanese government in the province of Darfur. What started as two groups has expanded into dozens of warring factions, causing a major humanitarian crisis. FIGURE 1.12 Economic Turmoil in Iceland A protest against in Iceland against its government’s handling of the 2009 economic crisis. Given the size of Iceland’s economy, the collapse of its bubble economy was the largest suffered by any country in history. Advocates and Critics of Globalization (cont.)
- 10. 1010© 2011 Pearson Education, Inc. Themes and Issues in World Regional Geography • Geography describes Earth and explains spatial patterns • Themes and issues in world regional geography – Environmental geography (covered in Chapter 2) – Population and settlement – Cultural coherence and diversity – Geopolitical framework – Economic and social development FIGURE 1.9 Global Sweatshops Women working in a sweatshop perform labor- intensive work for low wages.
- 11. 1111© 2011 Pearson Education, Inc. • Earth’s population: more than 6.7 billion – About 80 million born each year (15,000 each hour) – 90 percent of population growth is in developing regions (Africa, South Asia, East Asia, Latin America) • Important population issues – Population growth rates vary – Countries have different approaches to family planning; France encourages more children, China limits family size – Migration, including rural-to-urban migration, is an important part of globalization – The greatest international migration in human history is occurring NOW Population and Settlement: People on the Land FIGURE 1.17
- 12. 1212© 2011 Pearson Education, Inc. World Population FIGURE 1.16 World Population Population densities vary from place to place. • Usually, people live where water and other resources are available in appropriate amounts. Thus, you can trace the path of the Nile River via the population shown living along it. Population densities are highest in East Asia and South Asia and are very low in Canada and Russia (too cold), the Sahara (too dry), and the Amazon (too moist). Population densities are higher in cities than in rural areas.
- 13. 1313© 2011 Pearson Education, Inc. Population indicators for the ten largest countries (based on population) World Population (cont.)
- 14. 1414© 2011 Pearson Education, Inc. • Measuring population – Rate of natural increase (RNI): annual growth rate for a country or region as a percentage increase; world RNI is 1.2 percent per year • Crude birth rate (CBR): total number of births divided by the total population; world CBR = 21 per 1,000 • Crude death rate (CDR): total number of deaths divided by the total population; world CDR = 8 per 1,000 – Total fertility rate (TFR): the average number of children born by a statistically average woman (world average = 2.6; Europe = 1.5; Africa = 4.8) • More or less the average number of children per family • TFR of 2.1 results in a stable population (under 2.1 = shrinking population; over 2.1= growing population) Population Growth and Change
- 15. 1515© 2011 Pearson Education, Inc. • Measuring population, continued – Young and old populations • Percentage of population under age 15 indicates growth potential – World average = 27 percent; Africa = 41 percent (some African countries near 50 percent); Europe = 15 percent; North America = 20 percent • Percentage of population over age 65 reflects needs for senior citizens (highest in developed regions; low in LDCs) – Life expectancy: average length of life expected at birth; related to nutrition, sanitation, health care, and so on* • World average = 67; Africa = 51; Japan = 83 Population Growth and Change *Life expectancy data are included in Table 1.2
- 16. 1616© 2011 Pearson Education, Inc. Population Pyramids FIGURE 1.19 Population Pyramids Population pyramids show the gender and percentage of the population in each age group.
- 17. 1717© 2011 Pearson Education, Inc. The Demographic Transition BR, DR high; low to no pop. growth DR drops due to improved food supply, sanitation; pop. grows BR drops due to industrialization, urbanization, education; pop. grows BR, DR low; low to no pop. growth; population high but stable FIGURE 1.20
- 18. 1818© 2011 Pearson Education, Inc. • Today >190 million people live outside the country of their birth; one-third live in seven industrialized countries • Linked to global economy – Push forces: negative conditions that drive people from a location. Examples: oppression, war, unemployment, natural disasters (e.g., famine, Hurricane Katrina) – Pull forces: favorable conditions that attract people. Examples: economic opportunity (jobs), freedom, good climate – Most migration involves both push and pull forces • Networks of families, friends, and sometimes labor contractors connect migrants from their origins to their destinations FIGURE 1.21 Refugees Worldwide, about 35 million people are refugees. Here, refugees in southern Sudan wait in line for water. Migration Patterns
- 19. 1919© 2011 Pearson Education, Inc. • Cities are the focal points of the modern globalizing world • Mexico City and São Paolo (Brazil): each has >20 million residents; add 10,000 each week; expected to double in the next 15 years – Urbanized population: percentage of a country’s people who live in cities • On average, 48 percent of world’s population lives in cities • Developed areas: more than 80 percent urbanized • Developing regions: often much lower than 50 percent (e.g, in Zimbabwe, only 34 percent of the people live in cities) An Urban World FIGURE 1.24 Squatter Settlements Massive and rapid migration to world cities makes it difficult to meet the needs for housing, sanitation, and other infrastructure. This often leads to squatter settlements such as these in New Delhi, India.
- 20. 2020© 2011 Pearson Education, Inc. Growth of World Cities (2005–2015) FIGURE 1.23 Growth of World Cities
- 21. 2121© 2011 Pearson Education, Inc. • Culture is LEARNED (not innate), is SHARED (not individual) behavior, and includes both ABSTRACT (language, religion) and MATERIAL elements (architecture, technology) • When cultures collide • Cultural imperialism: active promotion of one cultural system over another • Cultural nationalism: the process of defending a cultural system against offensive cultural expression while at the same time actively promoting local or national values • Cultural syncretism or hybridization: the blending of elements of culture to form a new culture Culture in a Globalizing World
- 22. 2222© 2011 Pearson Education, Inc. • Language and culture are closely tied – Language is often the characteristic that best defines cultural groups • Dialect: a distinctive form of a language associated with a specific region (e.g., American English, British English) • Lingua franca: a third language that is adopted by people from different cultural groups within a country who cannot speak each other’s language (e.g., Swahili in Africa, English in India) FIGURE 1.29 English as a Global Language A bilingual traffic sign in Dubai. Language and Culture in Global Context
- 23. 2323© 2011 Pearson Education, Inc. World Languages FIGURE 1.28 World Languages Most languages belong to one of a handful of major language families. About half the world’s people speak a language in the Indo-European language family.
- 24. 2424© 2011 Pearson Education, Inc. • Religion, like language, is an extremely important defining trait of cultural groups • Universalizing religion: attempts to appeal to all people regardless of location or culture (examples: Christianity, with 2 billion; Islam, with 1.2 billion; Buddhism) • Ethnic religion: identified closely with a specific ethnic group; does not actively seek converts (examples: Judaism; Hinduism, with 850 million in India) • Secularization: exists when people consider themselves to be nonreligious or outright atheistic (about 1 billion) Geography of World Religion FIGURE 1.31 Religious Landscapes Statue of the sea deity Kwun Yum at the Tin Hau Temple in Repulse Bay, Hong Kong.
- 25. 2525© 2011 Pearson Education, Inc. Major Religious Traditions FIGURE 1.30 Major Religious Traditions
- 26. 2626© 2011 Pearson Education, Inc. Geopolitical Framework: Fragmentation & Unity • Geopolitics: term that describes the close link between geography and political activity – Focuses on the interaction between power, territory, and space at all scales – State: a political unit with territorial boundaries recognized by other countries and internally governed by an organizational structure – Nation: a large group of people who share many cultural elements (e.g., language, religion, cultural identity) and view themselves as a single political community – Nation-state: a relatively homogenous cultural group with its own fully independent political territory (e.g., Japan, France); Kurds are a nation without a state FIGURE 1.32 End of the Cold War A monument to Lenin is toppled in Bucharest, Romania (1990).
- 27. 2727© 2011 Pearson Education, Inc. Kurds: A Nation Without a State FIGURE 1.33 A Nation Without a State Not all nations or large cultural groups control their own territories and thus are without a state. The Kurdish people of Southwest Asia occupy a large cultural region that is split among four different political states (Turkey, Iraq, Syria, and Iran). As a result of this political fragmentation, the Kurds are considered a minority in each of these four countries, and have sometimes faced discrimination.
- 28. 2828© 2011 Pearson Education, Inc. • Centrifugal forces: Cultural and political forces acting to weaken or divide an existing state – Examples: linguistic minority status, ethnic separatism, territorial autonomy, disparities in income and well-being • Centripetal forces: Forces that promote political unity and reinforce the state structure – Examples: shared sense of history, need for military security, overarching economic structure Centrifugal and Centripetal Forces FIGURE 1.34 Basque Separatism Basques of northeast Spain have demanded independence.
- 29. 2929© 2011 Pearson Education, Inc. Geopolitical Framework: Fragmentation & Unity (cont.) • Global terrorism – Today, many terrorist attacks (like those in the United States in September 2001) are not attached to a nationalist or regional geopolitical aspiration to achieve independence or autonomy – Global terrorism is a product and an expression of globalization • Asymmetrical warfare: the differences between a superpower’s military technology and strategy and the lower-level technology and decentralized guerilla tactics used by Al Qaeda and the Taliban FIGURE 1.35 Global Terrorism England has suffered attacks by groups advocating independence for Northern Ireland, as well as more recent attacks by terrorists allied with Islamic extremism.
- 30. 3030© 2011 Pearson Education, Inc. • Colonialism and decolonialization • Colonialism: formal establishment of rule over a foreign population • Decolonialization: the process of a colony’s gaining (or regaining) control over its territory and establishing a separate independent government Geopolitical Framework: Fragmentation & Unity (cont.) FIGURE 1.37 Colonial Vestiges in Vietnam The red star flag of communist Vietnam flies in front of the Hotel de Ville in Ho Chi Minh City (formerly Saigon). This juxtaposition of the contemporary government’s symbol and the architecture of the French colonial period captures the process of decolonialization and independence.
- 31. 3131© 2011 Pearson Education, Inc. The Colonial World in 1914 FIGURE 1.36 The Colonial World, 1914 This world map shows the extent of colonial power and territory just prior to World War I. At that time, most of Africa was under colonial control, as were Southwest Asia, South Asia, and Southeast Asia. Australia and Canada were very closely aligned with England. Also note that in Asia, Japan controlled colonial territory in Korea and northeastern China, which was known as Manchuria at that time.
- 32. 3232© 2011 Pearson Education, Inc. Economic and Social Development: The Geography of Wealth and Poverty • Economic development brings increased prosperity to individuals, regions, and nation-states • More- and less-developed countries – Core-periphery model: United States, Canada, western Europe, and Japan make up the economic core in the Northern Hemisphere, and most areas to the south make up a less-developed periphery • Indicators of economic development – Development: qualitative and quantitative measures indicating structural changes (getting “better”) – Growth: increase in the size of a system (getting bigger)
- 33. 3333© 2011 Pearson Education, Inc. • Gross domestic product (GDP): the value of all final goods and services produced within a country • Gross national income (GNI): the value of all final goods and services produced within a country, plus net income from abroad – GNI per capita: obtained by dividing the GNI by a country’s population FIGURE 1.40 More- and Less- Developed Countries Based upon GNI per capita, PPP adjusted, one sees the global pattern of more- and less- developed countries (MDCs and LDCs). Africa and the different parts of Asia stand out as the regions with the greatest number of developing countries. Indicators of Economic Development
- 34. 3434© 2011 Pearson Education, Inc. • Poverty: living on less than $2/day; deep poverty defined as living on less than $1/day • Under age five mortality: number of children who die per 1,000 persons; related to availability of food, basic health care • Adult literacy rates: percentage of a society’s males and females who can read; related to economic development, birth rates • Gender equity: ratio of males to females enrolled in primary and secondary school (<100 — more males; >100 — more females Indicators of Social Development FIGURE 1.38 The Global Recession Two indicators of global economic activity, the price of crude oil and the Baltic Dry Index (BDI), reflect economic expansion followed by contraction.
- 35. 3535© 2011 Pearson Education, Inc. FIGURE 1.41 Human Development Index The United Nations tracks social development through the HDI, which combines data on life expectancy, literacy, educational attainment, gender equity, income, and life expectancy. Data are from 2006. Indicators of Social Development
- 36. 3636© 2011 Pearson Education, Inc. Development Indicators
- 37. 3737© 2011 Pearson Education, Inc. • Globalization is driving a fundamental reorganization of economies and cultures through trade agreements, supranational organizations, military alliances, and cultural exchanges • Discussion of each region includes five themes: – Environmental geography – Population and settlement – Cultural coherence and diversity – Geopolitical framework – Economic and social development geographies Summary