1. Mathematical Model for Time to Neuron Apoptosis Due to Accrual of DNA DSBs
Chindu Mohanakumar3, Annabel E. Offer2, Jennifer Rodriguez1
1
California State University, Channel Islands, CA 2
Texas Tech University, Lubbock, TX 3
University of Florida, Gainesville, FL
Introduction
Neurodegeneration has become an increasingly prevalent issue with the growing number
of senior citizens. There is an increasing amount of evidence pointing to age-related DNA
Double Strand Breaks (DSBs) as a culprit for this issue. We focus on non-transient DSBs
and the error-prone mechanism non-homologous end joining (NHEJ) that exists to repair
these breakages, the latter of which degrades over time, leading to neuronal apoptosis.
We investigate these DSB dynamics and their role as a possible cause of aging.
Assumptions
DSB
Ku70/80
DNA-PKcs
autophosphorylation
of DNA-PKcs
Non-transient
repair pathway
Transient
repair pathway
k1 = 350/hr
k2 = 500/hr
k3 = 14.3/hr
k4 = 0.23/hr k5 = 3.75/hr
-A DNA DSB is harmful only if it happens in the protein coding
region of the DNA (this is only 1.5% of 3.2 billion base pairs (b.p.)
in humans). We consider only harmful DSBs.
-NHEJ is the only DSB repair mechanism that does not require
cell replication. Most neurons cannot replicate; therefore, the
only method to fix DSBs is NHEJ.
-A neuron dies when two DSBs happen within 20 b.p. of each
other. This is because the protein heterodimer Ku70/Ku80 can-
not bind properly and serve as a docking site for DNA-PKcs on
less than 20 b.p.
-Per capita rate of repair (α) will initially spike in response to DNA
breakages and wrong repairs, due to the neuron’s attempts to
control the problem (similar to an immune response). The rate
will then taper off to zero as the number of breakages and wrong
repairs overcomes the neuron’s ability to cope with them.
ODE Model Framework
Our proposed model of Ordinary Differential Equations (ODEs) describes the dynamics of
DSBs in a single neuron. The model is given by:
dU
dt
= −bU + pBα(B, W) (1)
dB
dt
= bU − Bα(B, W) (2)
dW
dt
= (1 − p)Bα(B, W) (3)
where N = U + B + W is the total number of base pairs.
Variables/Parameters Description Units
U Unbroken DNA base pair (b.p.) linkages b.p.
B Broken DNA b.p. linkages (DSBs) b.p.
W Wrongly repaired DNA b.p. linkages b.p.
b Per capita rate of (harmful) breakage 1/time
a # of DSBs that most excites the neuron b.p.
c Highest per capita repair rate 1/time
α(B, W) Per capita rate of proper/improper repair 1/time
p Proportion of properly repaired DSBs none
Description of Rate of Repair function α(B, W)
The per capita rate of repair function, α(B, W), has three possible forms:
α1(B, W) =
c
a
Be1−(B+W)/a,
α2(B, W) =
σc
aB
1 + ηB+W
a + (ηB+W
a )3
, σ =
3 + 22/3
2
, η =
1
21/3
,
α3(B, W) =
σc
aB
1 + ηB+W
a + (ηB+W
a )4
, σ =
4 + 33/4
3
, η =
1
31/4
,
0 1000 2000 3000 4000 5000
0
1
2
3
4
Broken b.p (B)
PerCapitaRateofRepair
Rate of Repair Functions
α3(B,0)
α2(B,0)
α1(B,0)
Figure 1: Three possible rate of repair functions. (Base value of a, ¯a = 500 and c,
¯c = 3.812).
Stochastic Model
Figure 2: The deterministic ODE and 20 runs
of the stochastic ODE for a healthy neuron
(when c = 3.812) over the course of 100
years. This model does not yet include dis-
tance between DSBs, so there is no neu-
ronal apoptosis in this figure. (A) Unbro-
ken b.p. (B) Broken b.p. (DSBs). (C)
Wrongly repaired b.p. (¯a = 500, ¯b =
10
3,200,000,000, ¯c = 3.812, ¯p = 0.875, N =
48, 000, 000)
Figure 3: Distribution of the years it takes
for an unhealthy neuron (where c = 0)
to undergo apoptosis after 10,000 simula-
tions. Since this model includes neuronal
apoptosis, it includes distance between each
DSB. This figures shows the Weibull dis-
tribution as the best fit. The distribution
shows that a neuron is more likely to die
out early in its lifetime. (¯a = 500, ¯b =
10
3,200,000,000, c = 0, ¯p = 0.875, N =
48, 000, 000)
*The stochastic simulation provides us with a numerical value for the LD50, the number of
breakages necessary to create a 50% probability of apoptosis in a neuron. This number
is determined to be 1400 breaks.
Probability Model
We employ a branching process representing the probabilities of survival as well as prob-
abilities of breaks being either chops (taking off parts of the existing survival regions (s.r))
or splits (splitting s.r into two regions) in order to observe probability of survival given N
breaks. This helps us to determine the theoretical value of the LD50.
This value is important to theoretical biologists, and is a value we can also compare to the
LD50 provided by the stochastic simulations.
p(1) = 1 − 2L
p(2)1 = p(1) − 2L p(2)2 = p(1) − 3L
2
p(3)1 = p(1) − 4L p(3)2 = p(1) − 2L −
L(6−31L)
2(2−11L)
p(3)3 = p(1) − 7L
2 p(3)4 = p(1) − 3L
p(1)sp = 1 − 2L
p(1) p(1)ch = 2L
p(1)
p(2)1
sp = 1 − 4L
p(2)1 + 4L2
p(2)1(1−4L) p(2)1
ch = 4L
p(2)1 − 4L2
p(2)1(1−4L)
p(2)2
sp = 1 − 2L
p(2)2 p(2)2
ch = 2L
p(2)2
Figure 4: Branching process flowchart. P(N)m is the probability of survival given N
breaks for the mth case. P(N)m
sp/ch
is the probability of Nth break being a chop or split.
Parameter Exploration
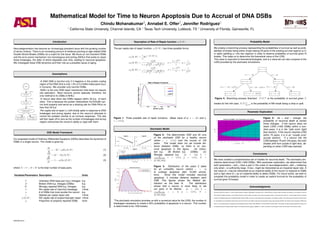
Figure 5: As a and c change, the
probability of neuronal death at certain
times changes. If the neuron does not
reach LD50 (1400 DSBs) within a hun-
dred years, it is in the ”safe zone” (light
blue section). If the neuron reaches LD50
within 75 years, it is in an ”unsafe zone”
(purple section). If a neuron hits the
LD50 between 75 and 100 years, the color
shades shift from purple to light blue, de-
pending on when LD50 was reached.
Conclusions
We have created a comprehensive set of models for neuronal death. The stochastic sim-
ulations determined LD50 (1400 DSBs). With parameter exploration, we determined that
both parameters c and a have a part in the onset of neurodegeneration, with a mattering
only when c is sufficiently large. A low c might be interpreted as an impaired repair rate. A
low value of a may be interpreted as an impaired ability of the neuron to respond to DSBs
and a high value of a as an impaired ability to detect DSBs. For future works, we wish to
complete the probability model in order to create an explicit formula for the probability of
survival given N breaks.
Acknowledgments
We would firstly like to thank Dr. Carlos Castillo-Garsow of Eastern Washington University and Dr. Derdei Bichara of Arizona State University, the advisors of our projects, as well as
Victor Moreno, Baltazar Espinoza, and Fereshteh Nazari of Arizona State University for their help as graduate mentors. We would like to thank Dr. Carlos Castillo-Chavez, Executive
Director of the Mathematical and Theoretical Biology Institute (MTBI), for giving us this opportunity to participate in this research program. We would also like to thank Summer Director
Dr. Anuj Mubayi and coordinators Preston Swan and Ciera Duran for their efforts in planning and executing the day-to-day activities of MTBI. This research was conducted in MTBI at the
Simon A. Levin Mathematical, Computational and Modeling Sciences Center (SAL MCMSC) at Arizona State University (ASU). This project has been partially supported by grants from
the National Science Foundation (DMS 1263374), the National Security Agency (H98230-15-1-0021), the Office of the President of ASU, and the Office of the Provost at ASU.
SACNAS 2015