Client: Comedy Central
•Als PPTX, PDF herunterladen•
0 gefällt mir•1,858 views

Budget charts

Empfohlen
Weitere ähnliche Inhalte
Was ist angesagt?
Kürzlich hochgeladen
Kürzlich hochgeladen (17)
Client: Comedy Central
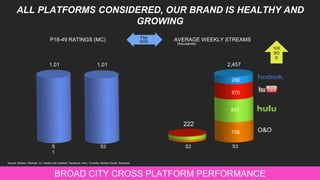
- 1. ALL PLATFORMS CONSIDERED, OUR BRAND IS HEALTHY AND GROWING 1 BROAD CITY CROSS PLATFORM PERFORMANCE Flat SOS Source: Nielsen, Rentrak, C3, Adobe Site Catalyst, Facebook, Hulu, Youtube, Nielsen Social, Sysomos. 10X SO S AVERAGE WEEKLY STREAMS (thousands) P18-49 RATINGS (MC) O&O S 1 S2 S2 S3 222 2,457 758 843 570 286 1.01 1.01
- 2. Total Playback C3/LSD C3/L3 2 INSIDE AMY SCHUMER CROSS PLATFORM PERFORMANCE - 23% SOS Note: Data for first seven episodes of respective seasons. O&O includes Site, App and Syndication. O&O streams are current season full episode starts during S3 vs. the same time period the prior season (4/20-6/7/15 vs. 4/1 – 5/18/14) Source: Nielsen, Rentrak, C3, Adobe Site Catalyst, Facebook, Hulu, Youtube, Nielsen Twitter TV Rankings, Sysomos. AVERAGE WEEKLY STREAMS (thousands) S 1 S2 S2 1,075 6,588 S3 1.29 1.00 607 647 3,858 607 868 O&O 6X SO S ALL PLATFORMS CONSIDERED, OUR BRAND IS HEALTHY AND GROWING P18-49 RATINGS (MC)
- 3. VIEWING CONSUMPTION ACROSS MULTIPLE PLATFORMS 3 Note: all data for first seven weeks of season. (1) L7, A18-49. INSIDE AMY SCHUMER CASE STUDY Premiere (-23%) Repeat (+1%) 15.3 7 13.3 9 - 13% SEASON 2 SEASON 3 Premiere & Repeat GRPs (1)
- 4. SEASON 2 SEASON 3 VIEWING CONSUMPTION ACROSS MULTIPLE PLATFORMS 4 Note: all data for first seven weeks of season. (1) Source: Omniture, Hulu (episodes 1-7). Full episode starts of all episodes during the season. (2) Source: Omniture, Hulu (episodes 1-7). Full episode starts of current episodes during the season. (1) (2) O&O INSIDE AMY SCHUMER CASE STUDY 598 1,770 +196 % 181 416 547 1,223 Non-linear Streams (000s)
- 5. VIEWING CONSUMPTION ACROSS MULTIPLE PLATFORMS 5 Note: all data for first seven weeks of season. (1) Source: Omniture, Hulu (episodes 1-7). Full episode starts of all episodes during the season. (2) Source: Omniture, Hulu (episodes 1-7). Full episode starts of current episodes during the season. (3) Streamed during S3 window. O&O INSIDE AMY SCHUMER CASE STUDY SEASON 2 (1) 3,359 +196 % 1,770 598 181 416 547 1,223 3,028 331 SEASON 3 (2) CURRENT + CATCH-UP (S1 & S2) (3)
- 6. OUR APP HAS TAKEN OFF 6 AverageMonthlyVideoStreams Source: ComScore. (millions ) APP Video Streams (1) 2012 2013 2014 2015
Hinweis der Redaktion
- The net result is an overall increase in fans and consumption. You’ve all seen the Broad City data that showed ratings were flat on linear, but up 10-fold across all other screens.
- We’ve seen that same phenomenon, in an even more extreme way on Inside Amy Schumer.
- Here you see the consumption on Comedy Central linear for the last two seasons of Amy. This is Gross Ratings Points – GRPs – from the premieres and encores. Premieres were down a bit, encores up a tad – but overall the show declined by 13% - and this is for arguably our hottest show with the hottest person in comedy right now. Now let’s take a look at streaming – where we had significant growth across all platforms ( +196%) web, app and particularly hulu. So TV down a bit, streaming up huge. What’s interesting is to see the additional spike in consumption of seasons 1 and 2. Beyond the 844k streams of the new season there were over 2.5M streams of seasons 1 and 2! 88% of those on hulu. It’s clear – the appetite for our content is voracious – and the growth is on demand.
- Here you see the consumption on Comedy Central linear for the last two seasons of Amy. This is Gross Ratings Points – GRPs – from the premieres and encores. Premieres were down a bit, encores up a tad – but overall the show declined by 13% - and this is for arguably our hottest show with the hottest person in comedy right now. Now let’s take a look at streaming – where we had significant growth across all platforms ( +196%) web, app and particularly hulu. So TV down a bit, streaming up huge. What’s interesting is to see the additional spike in consumption of seasons 1 and 2. Beyond the 844k streams of the new season there were over 2.5M streams of seasons 1 and 2! 88% of those on hulu. It’s clear – the appetite for our content is voracious – and the growth is on demand.
- Here you see the consumption on Comedy Central linear for the last two seasons of Amy. This is Gross Ratings Points – GRPs – from the premieres and encores. Premieres were down a bit, encores up a tad – but overall the show declined by 13% - and this is for arguably our hottest show with the hottest person in comedy right now. Now let’s take a look at streaming – where we had significant growth across all platforms ( +196%) web, app and particularly hulu. So TV down a bit, streaming up huge. What’s interesting is to see the additional spike in consumption of seasons 1 and 2. Beyond the 844k streams of the new season there were over 2.5M streams of seasons 1 and 2! 88% of those on hulu. It’s clear – the appetite for our content is voracious – and the growth is on demand.
- Our app has taken off: Dave will tell you about the Bieber Bump and how much it impacted our app in a bit. Fans are also seeking out our content on Hulu, Amazon and Snapchat – our newest platform that has brought in $1 million in ad revenue to data. Other notes/stats---------------------------------------------------------------------------------------- 3.6 million downloads of the Comedy Central app with 100 million streams since launch We’re #1 in the humor category in desktop unique visitors, time spent and video views (ComScore, April 2015).