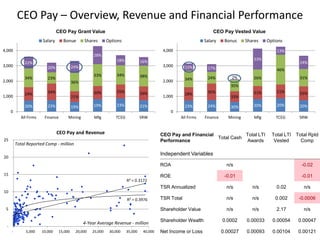
1. CEO Pay – Overview, Revenue and Financial Performance
R² = 0.3976
R² = 0.3172
-
5
10
15
20
25
- 5,000 10,000 15,000 20,000 25,000 30,000 35,000 40,000
Total Reported Comp - million
CEO Pay and Revenue
4-Year Average Revenue - million
CEO Pay and Financial
Performance
Total Cash
Total LTI
Awards
Total LTI
Vested
Total Rptd
Comp
Independent Variables
ROA n/s -0.02
ROE -0.01 -0.01
TSR Annualized n/s n/s 0.02 n/s
TSR Total n/s n/s 0.002 -0.0006
Shareholder Value n/s n/s 2.17 n/s
Shareholder Wealth 0.0002 0.00033 0.00054 0.00047
Net Income or Loss 0.00027 0.00093 0.00104 0.00121
20% 23% 19% 19% 23% 21%
24% 34%
21%
20% 25% 26%
34% 23%
36%
33% 34% 38%
22%
20% 24%
28%
18% 16%
0
1,000
2,000
3,000
4,000
All Firms Finance Mining Mfg TCEG SRW
Salary Bonue Shares Options
CEO Pay Grant Value
23% 24% 30% 20% 20% 20%
28% 35%
33%
21% 21% 25%
34% 24%
35%
26%
46%
31%
15% 17%
2%
33%
13%
24%
0
1,000
2,000
3,000
4,000
All Firms Finance Mining Mfg TCEG SRW
Salary Bonus Shares Options
CEO Pay Vested Value
2. Pay for Performance – What Performance?
R² = 0.0971
0
5,000
10,000
15,000
20,000
25,000
-15,000 -10,000 -5,000 0 5,000 10,000 15,000 20,000
CEO Total Pay ‘000
Shareholder Wealth in millions
R² = 0.1692
0
5,000
10,000
15,000
20,000
25,000
-4,000 -2,000 0 2,000 4,000 6,000 8,000 10,000
CEO Total Pay ‘000
When Shareholder Wealth increases by
$1 million, CEO total pay increases by $470.
When Net Income or Loss increases by
$1 million, CEO total pay increases by $1,200.
Net Income or Loss in millions
R² = 0.0112
0
5,000
10,000
15,000
20,000
25,000
-20 -10 0 10 20 30 40
CEO Total Pay '000
Return on Assets %
When Return on Assets (ROA) increases by 1%,
e.g. 2% to 3%, CEO total pay decreases by -1.7%.
R² = 0.0018
0
5,000
10,000
15,000
20,000
25,000
-60 -40 -20 0 20 40 60 80 100 120
CEO Total Pay '000
Total Shareholder
Return %
There is no relationship between Total
Shareholder Return (TSR) and CEO total pay.