Npl europe market 2010
•
1 gefällt mir•988 views

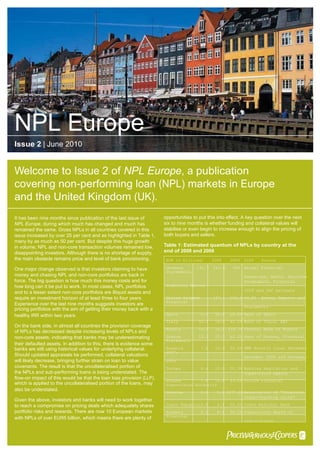
A publicatino covering non-performing Loan ( NPL ) markets in europe and the Untited Kingdom ( UK )

Empfohlen
Empfohlen
Weitere ähnliche Inhalte
Was ist angesagt?
Was ist angesagt? (19)
Andere mochten auch
Andere mochten auch (20)
Ähnlich wie Npl europe market 2010
Ähnlich wie Npl europe market 2010 (20)
Mehr von CONact Market Entry Management GmbH
Mehr von CONact Market Entry Management GmbH (20)
Kürzlich hochgeladen
Kürzlich hochgeladen (20)
Npl europe market 2010
- 1. NPL Europe Issue 2 | June 2010 Welcome to Issue 2 of NPL Europe, a publication covering non-performing loan (NPL) markets in Europe and the United Kingdom (UK). It has been nine months since publication of the last issue of opportunities to put this into effect. A key question over the next NPL Europe, during which much has changed and much has six to nine months is whether funding and collateral values will remained the same. Gross NPLs in all countries covered in this stabilise or even begin to increase enough to align the pricing of issue increased by over 25 per cent and as highlighted in Table 1, both buyers and sellers. many by as much as 50 per cent. But despite this huge growth in volume, NPL and non-core transaction volumes remained low, Table 1: Estimated quantum of NPLs by country at the disappointing investors. Although there is no shortage of supply, end of 2008 and 2009 the main obstacle remains price and level of bank provisioning. EUR in billions 2008 2009 Diff Source One major change observed is that investors claiming to have Germany 141.7 212.6 50% Annual Financial Statements, money and chasing NPL and non-core portfolios are back in Bankscope, BaFin, Deutsche force. The big question is how much this money costs and for Bundesbank, Financial how long can it be put to work. In most cases, NPL portfolios Stability Review 2009 and PwC estimate and to a lesser extent non-core portfolios are illiquid assets and require an investment horizon of at least three to four years. United Kingdom 107.1 155.1 44.8% Broker Reports and Financial Experience over the last nine months suggests investors are Statements pricing portfolios with the aim of getting their money back with a healthy IRR within two years. Spain 75.4 96.8 28.4% Bank of Spain Italy 42.1 59.0 40.1% Bank of Italy, ABI On the bank side, in almost all countries the provision coverage Russia 10.1 22.1 118.7% Central Bank of Russia of NPLs has decreased despite increasing levels of NPLs and non-core assets, indicating that banks may be underestimating Greece 12.5 20.3 62.4% Bank of Greece, Financial Statements their defaulted assets. In addition to this, there is evidence some banks are still using historical values for underlying collateral. Romania 7.2 10.9 52.0% NBR Buletin lunar December 2007, Should updated appraisals be performed, collateral valuations December 2008 and December will likely decrease, bringing further strain on loan to value 2009 covenants. The result is that the uncollateralised portion of Turkey 6.4 10.0 55.3% Banking Regulation and the NPLs and sub-performing loans is being understated. The Supervision Agency flow-on impact of this would be that the loan loss provision (LLP), Poland 7.6 10.8 43.0% Polish Financial which is applied to the uncollateralised portion of the loans, may Supervision Authority also be understated. Ukraine 0.2 5.6 2477.6% Association of “Ukrainian credit-banking union” Given the above, investors and banks will need to work together to reach a compromise on pricing deals which adequately shares Czech Republic 2.8 4.3 55.2% Czech National Bank portfolio risks and rewards. There are now 10 European markets Hungary 2.2 4.3 96.2% Supervisory Board of Financial with NPLs of over EUR5 billion, which means there are plenty of Institutions
- 2. United Kingdom Overall asset quality to improve in 2010 Given the wider macroeconomic improvement, overall asset Non-performing loans in the United Kingdom continued to rise in quality is expected to improve in 2010 as rates of new defaults 2009, as evidenced in the table below. decrease in the second half of the year (see Table 4 below). However, as evidence that hard work is still ahead for many UK Table 2 – NPL portfolio development for key UK banks banks, we expect that the number of accounts in arrears will not (in EUR billions) revert to historical levels in the near future. UK Gross bank NPLs & NPL % of total loans 6.00% Table 4 – UK Historical Loan Loss Ratio 150.0 5.00% UK Loan Loss Provision Ratio 3.00% 4.00% 100.0 2.50% 3.00% 2.00% 50.0 2.00% 1.50% 1.00% 1.00% - 0.00% 0.50% Gross NPLS (EUR m) Gross NPLS / Total Loans (%) 0.00% Av. 1990-2007 2009E 2010E 2011E Sources: Broker Reports and Financial Statements. Note that the majority of the balances determined using data from four major UK banks (Lloyds Group, HSBC, Royal Bank of Scotland Source: Credit Suisse-Pan European Banks: Jagdeep Kalsi, 24 February 2010 and Barclays). Despite an overall increase in NPLs during 2009, some of the Table 3 – NPL coverage for key UK banks extreme predictions regarding the level of asset deterioration (LLP as per cent of NPL) have failed to materialise. However, most UK banks, including UK banks NPL coverage ratio those in Table 3 above, do have significant exposure to the UK 200.0% commercial and residential property markets and are therefore 180.0% subject to fluctuations in provision levels relative to changes in 160.0% collateral values (i.e. the uncollateralised exposure). 140.0% 120.0% 100.0% Mortgage arrears lower than expected 80.0% 60.0% A lower than anticipated level of mortgage arrears has been 40.0% driven by a smaller than predicted increase in UK unemployment, 20.0% which had been expected to peak at 10 per cent. It has only 1 2 0.0% reached 7.8 per cent , up from 6.4 per cent in 2008 . A similar 2008A 2009A 2010E 2011E 2012E trend can be observed in the level of consumer credit defaults. Lloyds Banking Group Royal Bank of Scotland ContinuedHSBC Barclays record low benchmark interest rates have underpinned Sources: Broker Reports and Financial Statements. Note that the majority of the balances the lower unemployment levels. determined using data from four major UK banks (Lloyds Group, HSBC, Royal Bank of Scotland and Barclays). Compared with the recession in the early 1990s, corporate insolvencies have also increased at a lower rate than expected3, Table 3 shows that many of the larger UK banks are maintaining even though the decrease in GDP has been much sharper than relatively low NPL coverage ratios, with the exception of HSBC. at any other time in the UK’s post war history. This is attributable This would suggest that from an Income Statement perspective, to a number of factors, the most obvious being the sizeable the banks have little room for discounting NPLs through a sale. and immediate intervention of the Bank of England through Other factors will need to be included to justify a discount such its GBP200 billion quantitative easing scheme. There has also as capital and resource costs. been an increased reluctance among banks to make formal appointments, instead favouring loan extensions with the hope that future economic circumstances will stabilise and prompt loan repayments. 1. UK Economics Weekly: Capital Economics, 8 March 2010 2. www.tradingeconomics.com 3. Bank of America Merrill Lynch “Life after trough earnings”, Michael Helsby (Research Analyst), 3 February 2010 2 | NPL Europe • Issue 2 • June 2010
- 3. Limited deal closures UK the most likely source of NPL deals in 2010 Since the inaugural issue of NPL Europe only a limited number of For the remainder of 2010, the key question remains: how will the transactions have closed in the UK. However there have recently economy react to the withdrawal of government support and any been some significant closures that include those listed below. post election austerity measures? Certain leading house price indicators pointed to renewed weakness in February property Seller Buyer Asset Type Face Value Completion prices4, and as such distressed investors still believe the UK 5 (GBP) Date will produce the greatest number of opportunities in 2010 . An increased level of transactions coming to the market is expected Citibank Pending Residential ca. 3 billion TBA Mortgages as a result of: PLs / NPLs • Improved credit conditions and the slow emergence of the GMAC US fund Residential > 550 million Q3 2009 UK economy from recession. This has improved investor Mortgages confidence in relation to collateral values and timelines to PLs / NPLs recovery, and is gradually being reflected in higher bid prices. Citibank SAV Credit / Credit card > 800 million Q1 2010 • Commercial real estate refinancing deadlines, estimated at Varde Partners around GBP120 billion over the next few years 6. Commercial Credit card provider UK DCA Unsecured > 200 real estate lending in the UK is estimated to be close to million Q1 2010 GBP200 billion and has suffered considerably since 2007. NPLs Research by HSBC has shown that roughly 85 per cent of GMAC US fund Residential > 600 million Q1 loans made to the sector in the last five years are breaching 2010 covenants and that commercial real estate prices could fall Mortgages by a further 16 per cent in 2010 7. Anecdotally, the pressure PLs / NPLs created by these loans on banks’ financial statements, Credit Suisse / US fund Residential 50 regulatory capital and work-out resources has been million Q2 2009 Oakwood Mortgages considerable, making it an area in which many would PLs / NPLs gladly seek to reduce their exposure. Source: PwC market research • The new coalition government elected in May could look to withdraw its support by focusing efforts on reducing the UK deficit and decreasing debt as a percentage of GDP. This is Government intervention and funding shortages expected to increase liquidity pressures in the market. limit UK NPL activity • Other drivers impacting the UK financial services industry, such as ongoing pressure on, and consolidation within, the A number of factors prevalent in the first half of 2009 continued Building Society sector is likely as a result of relatively poor to impact the level of NPL and loan sale transactions during the asset quality, lack of expert resourcing, limited access to second half of the year. These were: capital and a forthcoming need to repay under the Bank of • Government intervention, either through capital injections, the England’s Special Liquidity Scheme. Asset Protection Scheme or initiatives aimed at protecting • The exit of foreign banks from the UK in order to focus on the borrower and stemming foreclosures. To an extent this core markets continues. Several major U.S. and European has shielded larger financial institutions from the full impact of financial institutions have recently disposed of non-core asset their loan arrears and limited the number of forced NPL and portfolios, and the trend is likely to continue, particularly as PL (performing loan) sellers to foreign or smaller non-bank European banks (especially German, Dutch, Belgian) seek to lending institutions. Further, UK banks subject to EU/regulator implement restructuring plans focused on their home markets. restructuring programs are yet to fully implement the required programmes. As such, non-core asset disposals are unlikely • UK banks beginning the process of unwinding their non-core to pick up until 2011. assets and businesses due to pressure from European and UK stakeholders. Of the UK banks, RBS has to date been • The UK consumer NPL market continues to be constrained the most proactive in this regard with the disposal of several by a shortage of funding, from debt finance in particular, non-core businesses in 2009–2010. Further restructuring and and the pull-back of several key players. Combined with the disposals are likely to follow. challenges some UK debt collection agencies (DCAs) have • The relatively low level of provisions held by UK banks and building societies against distressed and non-core assets has meant that despite the bid/ask spreads narrowing since early 2009, many institutions remain unable or unwilling to absorb any losses from a sale. This is understandable given the speed of increasing arrears/non-performance when compared with provisioning guidelines. However, in some instances the full cost of holding these loans to maturity has not been taken into account when considering transactions, particularly from a capital perspective. 4. UK Economics Weekly: Capital Economics, 8 March 2010, Referring to the Nationwide and Halifax indices recording house price drops in February 5. Debtwire: European Distressed Debt Market Outlook, January 2010 6. Bank of America Merrill Lynch “Life after trough earnings” – Michael Helsby (Research Analyst), 3 February 2010 7. Telegraph.co.uk, Graham Ruddick, “Will Dubai’s problems affect the UK property recovery?” NPL Europe • Issue 2 • June 2010 | 3
- 4. Table 7 – LLP ratio development for key German Germany banks (LLP as per cent of loans) 4.0% NPL volumes 3.5% 3.0% Based on information contained in financial statements of the largest German banks, NPLs and write-downs grew significantly 8 2.5% during 2009 and many expect this to peak mid 2010 . Deutsche 2.0% Bundesbank indicated in its Financial Stability Review 2009 that 1.5% additional write-downs on loans of EUR50 billion to EUR75 billion 1.0% will be necessary as a result of both macro and micro economic 9 0.5% factors in 2009 . It is numbers like these that make the German banking market one of the most interesting and attractive 0.0% Deutsche HVB Postbank HSH Commerzbank WestLB markets to international investors. Hypo RE Bank LLP 06 LLP 07 LLP 08 LLP 09 In table 5 below, 2009 NPL volumes are an estimate based on movement in the loan loss provision and gross NPL volumes for a Source: Financial Statements 2009 sample of banks covering 75 per cent of total assets in Germany. Based on these estimates, NPLs in Germany could be as high as EUR200 billion (using a 34 per cent growth rate) to EUR220 billion As with many other markets, the major factors that drove the (using a 50 per cent growth rate) at the end of 2009. level of NPLs in the German market during 2009 were the increase in company insolvencies and consumer defaults. In Table 5 – NPL portfolio development in German market the first six months, business insolvencies rose 14.8 per cent 10. The average default loss was EUR1.15 million compared to 250.0 6.0% EUR750,000 in 2008. 5.0% 200.0 150.0 4.0% Recent NPL activity and changing 3.0% regulatory environment 100.0 2.0% Despite the above mentioned trends, feedback from a number 50.0 1.0% of German bankers suggests that they do not feel pressure to sell German non-core assets or NPLs at current pricing levels. 0.0 0.0% 1998 1999 2000 2001 2002 2003 2004 2005 2006 2007 2008 2009E Instead, there is a belief that they have adequate levels of capital and internal resources to service loans internally. NPLs NPL % * As we could not find publicly available NPL levels for the entire German market in 2009, Key reasons for this are: estimated growth rates were applied to the remaining portion of the 2008 NPL estimate (EUR142 billion) from BaFin. A growth rate of 34 per cent was derived from the movement in LLP for a sample of banks in 2009 covering 75 per cent of total assets in German banks. • The direct capital injections that many German banks A growth rate of 50 per cent was derived from the movement in NPLs for the same sample received during 2008/09 have resulted in the main banks of banks. having capital adequacy ratios above 10 per cent; and Source: BaFin, Financial Statements, Bankscope, and Deutsche Bundesbank, Financial Stability Review 2009, November 2009 • Hybrid debt securities being classified as Tier 1 capital which do not dilute the ownership structure of the bank. As a result The tables below show the NPL and loan loss provision of these measures there were very few, if any, notable NPL development for some key banks in the German banking sector. deals in Germany during 2009 that were reported publicly. NPL volumes for the entire German banking sector at the end of We are, however, aware of the following NPL transaction that 2009 were not available at time of publication. The table below closed in December 2009. shows that all the key banks depicted experienced significant portfolio deterioration during 2009. Seller Buyer Asset Type Face Value Completion (in EUR Date Table 6 – NPL portfolio development for key German banks millions) (in EUR billions) BAG Colony Capital Commercial 25.0 61.2 December Bankaktie- LLC real estate 2009 20.0 ngesellschaft loans 15.0 Internal restructuring units versus bad banks 10.0 Many German banks spent most of 2009 performing an 5.0 internal review of balance sheet assets and, as a first step, separated non-performing and/or non-core activities. They - then determined how the organisation of the bank needed to Deutsche HVB Postbank HSH Commerzbank WestLB be changed in order to reflect the spike in NPLs and also the Hypo RE Bank identification of assets in jurisdictions and markets which had 2007 2008 2009 2006 been deemed non core Therefore considerable volumes of 8. Deutsche Bundesbank, Financial Stability Review 2009, November 2009, Source: Financial Statements 2009 page 11 + 60 9. Bundesvereinigung Kreditankauf und Servicing, Homepage as of 24 February 2010 10. Germany Special Report – German Landesbanken: Facing an Uncertain Future, 21 September 2009, page 3 4 | NPL Europe • Issue 2 • June 2010
- 5. non-strategic loans and NPLs were transferred to in-house A further complication in the current German environment is the restructuring units or flagged as non-core and in ‘run off’ phase. SME market and capital injections German taxpayers have given One such example is Commerzbank, which created a Portfolio a number of banks. It is widely understood that SME businesses Restructuring Unit that seeks to centralise the management of are a key driver of the German economy and therefore of its GDP. its non-performing loans, including acquired assets from As such, there appears to be some incentive for banks to support Dresdner Bank. the SME sector by way of loan restructuring and deferrals. Based on default rates in the SME segment, we would have expected it In contrast, some banks like Bayern LB, HSH Nordbank and to be an area where banks would be looking to reduce exposure. LBBW may be in the process of considering or establishing an However, this may not happen in the short term. external bad bank pursuant to § 8a of the amendment to the 11 Financial Market Stabilisation Act (FMStFG) . This law enables banks to set up ‘bad banks’, where they can transfer the toxic NPL transaction outlook securities and/or non-core assets. These bad banks would refinance toxic assets by issuing state-backed bonds to the It is not all doom and gloom for the German NPL market. parent bank. Since the start of 2010, a number of German banks have entered into discussions with investors in preparing portfolios of mixed However, the immediate liquidity and stability advantages of performing and non-performing assets to bring to market. Our the scheme need to be weighed against disadvantages. Such understanding is that the key asset classes banks are looking disadvantages include the state now having influence over to discuss are residential mortgage, corporate secured and business decisions (including salary levels and future strategy), shipping. An important issue here will be pricing and reaching meaning potential future losses would have to be borne by agreement on the value of the underlying collateral. existing shareholders. In our view, once assets are transferred there is limited pressure on ‘bad bank’ managers to dispose of For this reason, we believe German banks seek strategic partners the assets quickly and crystallise losses. As a result, in the short that are able to offer them reasonable prices and can take over to medium term, the realisation strategy for transferred assets is the operational servicing of the portfolios. This will most likely most likely to be internal ‘work out’ and selected sales. be achieved through structured deals negotiated with a limited number of serious investors that have access to capital and a To date, two German banks (both predominantly state-owned) proven track record for working out distressed/non-core assets. have set up or are in the process of establishing an external The portfolios are in the billions of EUR and we expect a number bad bank: of these transactions in the second half of 2010. Bank Transferred assetsFace value Completion Date (in EUR billions) 11. Tagesschau “HRE beantragt riesige Bad Bank”, 21 January 2010 12 (http://www.tagesschau.de/wirtschaft/badbank154.html). Zeit Online: WestLB High risk and Approx. 80 April 2010 with “HRE beantragt gigantische Bad Bank”, 21 January 2010 non-strategic assets retrospective effect(http://www.zeit.de/wirtschaft/unternehmen/2010-01/hre-bad-bank?page=all) including to 1 January 2010 non-performing loans 12. WestLB: “WestLB´s Shareholders Approve Transfer of € 85 Billion Portfolio to Workout Entity” 11 December 2010 (http://www.westlb.de/cms/sitecontent/westlb/ Hypo Real Estate AG Toxic securities and 210 Second half 2010 westlb_de/en/wlb/ui/news/newscontainer/news_2009/PR_20091211.standard. non-strategic assets gid-N2FkNDZmMzU4OWFmYTIyMWM3N2Q2N2Q0YmU1NmI0OGU_.html) including real estate loans
- 6. NPL Europe • Issue 2 • June 2010 | 5
- 7. • In Q4 2009, Bank of Spain introduced an additional Spain provisioning requirement that requires all financial entities to provide at least 30 per cent against the value of any foreclosed assets on their balance sheet for more than a year. Limited transactions • The approval of the FROB (Fund for the Restructuring of The sale of a non-performing residential mortgage portfolio the Banking sector) by the Spanish government, which is in August 2009 signalled the first sign of the reactivation of intended among other things to promote consolidation of the NPL market in Spain. Since then, the number of sell- and the banking sector. Several mergers are already underway buy-side mandates has been increasing steadily and so too has between the Savings Banks (cajas) as a result of this and the number of potential transactions coming to market. Since most, if not all, are considering the incorporation of non-core the last edition of NPL Europe, only three additional transactions asset and distressed debt disposals into their integration have actually closed. These are listed in the table below. plans, with the two-fold objective of strengthening their Seller Buyer Asset Face Completion Comment balance sheets and optimising liquidity. The additional Type value Date funding provided by FROB means these entities should (in EUR be more willing to accept a P&L loss in exchange for the millions) liquidity injection. Confidential Confidential NPL Resi 20 Feb 2010 PwC advised • Funding from the European Central Bank, which has been on sell-side forthcoming in support of the Spanish banking sector to Caja Madrid Confidential Consumer 150 Dec date, is due to decrease significantly in the near future. As 2009 No advisor such, banks and cajas will need to identify alternative funding Confidential Confidential Residential 60 sources. The funding shortage is further compounded by August 2009 PwC advised the narrow interest margins and high level of competition for Mortgage the seller deposit-taking currently faced by all financial institutions. GMAC Confidential NPL Resi 300 July 2009 No advisor The cumulative impact of these market organisation and Source: Market Feedback regulatory capital changes should become an additional incentive for cajas to dispose of their non-core assets, be they secured or unsecured. Key reasons why transactions failed Defaulted unsecured consumer portfolios The main reason for failed transactions continues to be the difference in pricing expectations between buyers and sellers, In terms of unsecured assets, there has been little impact as well as the impact of Bank of Spain’s relaxation of provisioning from the regulatory changes, but they continue to be attractive requirements for certain secured loans in July 2009. The Spanish portfolios for sale as they are typically 100 per cent provisioned. economy continued to deteriorate, with GDP shrinking As a result, any proceeds go straight to the bottom line of 3.8 per cent in 2009 and unemployment reaching 19 per cent, the P&L. which resulted in a 38 per cent increase in the level of NPLs from 2008 to 2009 (see table 8 below). Given these macroeconomic In our opinion, a mixed portfolio of secured and unsecured assets factors and increasing costs for Spain, Portugal and Greece in (the secured assets being partially provisioned and the unsecured accessing the capital markets, it seems unlikely the pricing gap 100 per cent provisioned) would currently be the most attractive can remain much longer. option to financial institutions, as any proceeds from the sale of unsecured assets could be used to offset potential losses on the 4.5% 120.0 secured assets. 4.0% 100.0 3.5% 3.0% 80.0 2.5% 60.0 Denmark 2.0% 1.5% 40.0 1.0% Denmark is a modern market economy featuring high-tech 20.0 agriculture; a technologically advanced SME and corporate 0.5% 0.0% - industry; extensive government welfare measures; equitable 2003 2004 2005 2006 2007 2008 2009 income distribution; comfortable living standards; a stable currency and political system; and a high dependence on foreign NPL Delinquent NPLs Ratio trade. Over the past two years unemployment has been creeping Source: Bank of Spain up but at 6 per cent at the end of 2009 remains low compared to other markets. (Source: Danish Central Bank). Denmark is a net Several regulatory changes have been approved or have taken exporter of food and energy and enjoys a comfortable balance of effect since August 2009, primarily affecting secured loans. The payments surplus. most significant changes have been: • Bank of Spain’s relaxation of the provisioning requirement for certain secured assets in July 2009. This means provisions are now calculated based on the difference between the loan exposure and 70 per cent of the latest appraisal value of the guarantee (rather than the total book value of the loan as before). The result is generally a lower provisioning level for affected assets (refer to Annex 9 of the BdE Circular 2004/9 for details). 6 | NPL Europe • Issue 2 • June 2010
- 8. Table 9 – Development of loan portfolio (DKK in billions) Table 11: Assets under management by the and LLP per cent from 2004 to 2009 Finansiel Stabilitet (in DKK billions) 3,000.0 3.5% 60.0 2,500.0 3.0% 2.5% 50.0 2,000.0 2.0% 40.0 1,500.0 1.5% 30.0 1,000.0 1.0% 20.0 500.0 0.5% 10.0 - 0.0% 2004 2005 2006 2007 2008 2009 0.0 31.12.2008 31.03.2009 30.06.2009 30.09.2009 Resi Mortgage Corporate loans Corporate mortgages 31.12.2009 Consumer loans LLP EBH Bank Lokken Sparebank Roskilde Bank Source: Danish Statistics (Statistikbanken), Danish National Bank and Danish FSA Pantebrevsselskabet Fionia bank / Nova Bank Source: Finansiel Stabilitet Annual Report 2009 Table 10 – NPL by major Danish Banks in 2008 (in EUR millions) With unemployment rates expected to rise to 8 per cent in 2010 (Source: Danish Central Bank), continued deterioration in the Non-Performing loans by major Danish banks (EUR million 2008) NPL Ratio quality of the consumer loan books of Danish banks is to be Danske Bank 2245 1.5% expected. This could reinvigorate the currently frozen unsecured Nykredit 0.4% 530 consumer NPL sale market. Also, should the EU start to wind Nordea Bank 630 0.8% back liquidity support measures, the resulting increase in cost Jyske 521 3.0% of borrowing is likely to be passed onto the Danish mortgage Sydbank 263 2.0% FIH 2.4% market and could also lead to the deterioration in the mortgage 239 Spar Nord Bank 179 2.9% books of the Danish banks originally expected in 2009. It should Amagerbanken 670 19.4% be noted, however, that some complexities exist in relation to Vestjysk 179 5.5% acquiring mortgage NPLs funded by Danish mortgage bonds Arbejdernes 52 2.2% (also referred to as Realkreditobligationer). Alm Brand 271 11.7% Finally, we also see potential opportunities for non-core asset 0 500 1000 1500 2000 2500 sales from foreign banks looking to withdraw from the Danish Source: Annual Reports market, and also through the sale of legacy NPLs currently under management by Finansiel Stabilitet. As can be seen from the above charts, as of 2008 Danish banks started to come under pressure from increasing NPLs and LLP percentages. This was combined with rising costs associated with government support (in the form of guarantees Italy and interest on capital injected), as well as potential liquidity shortages. In response, the Danish government established a Italy continues to be one of the largest but also one of the most winding-up company (Finansiel Stabilitet A/S) as part of its first difficult European markets for investors and sellers. Most sellers rescue package for the banking industry. Its role is to administer remember and still expect the same asset prices as obtained the state guarantee scheme, including winding up distressed prior to the onset of the Global Financial Crisis, while many banks. To date, Finansiel Stabilitet has taken over six small- investors are still trying to recover the cost of investments made, and medium-size banks which were impacted by exposures to let alone achieve a reasonable IRR. commercial real estate, developers and new farming operations. Table 11 below provides an overview of assets which remain under the control of Finansiel Stabilitet. In addition, assets from Gross NPLs up 40 per cent Capinordic Bank have been added to the portfolio in 2010. The size of the Italian NPL market, the fact that most sellers have Initially, Finansiel Stabilitet was set up to run for three years. been through sale processes in the past, and a steady increase in We are now 2.5 years into that term, but political agreement has the volume of NPLs since 2008, means Italy will always be a key since been reached to extend the life of the organisation as part NPL market in Western Europe. During 2009, total gross NPLs of a longer term strategy by the government to remove financial in Italian banks increased to EUR 59 billion, up 40 per cent from support for the financial services sector. 2008. This upward trend is expected to continue during 2010 and 2011, with the Italian Banking Association (ABI) predicting The residential mortgage books of Danish banks were expected NPLs to increase by 27 per cent in 2010 and 9 per cent in 2011, to be hit hard in 2009 due to rising unemployment and negative as highlighted in Table 12 below. The majority of this growth is GDP growth. However, extremely low interest rates have kept expected to result from real estate and consumer lending, with default rates and foreclosures at relatively low levels. unemployment rising to almost 9 per cent in 2010, as shown As a result there have been very few NPL transactions in in Table 13. Denmark during 2009. This was also the case in the unsecured consumer segment, which has historically been active with local legal firms and collection agents acquiring loans direct from banks. NPL Europe • Issue 2 • June 2010 | 7
- 9. Table 12 – Development of NPL portfolio from Table 15 – Development of NPL coverage ratio 2006 from to forecast 2011 (in EUR billions) three key banks 6.0% 90.0 80.0% 80.0 70.0% 5.0% 70.0 60.0% 4.0% 60.0 50.0% 50.0 3.0% 40.0% 40.0 30.0% 2.0% 30.0 20.0 20.0% 1.0% 10.0 10.0% 0.0% - 0.0% 2006 2007 2008 Q109 Q209 Q309 Q409 2010 F 2011 F Uncredi Intesa BMPS t Gros s % on tota l l oa ns 2008 H109 Q309 2009 NPL Source: Bank of Italy, ABI Source: Financial Statements Table 13 – Development of GDP and Since the last issue of NPL Europe, we are only aware of one unemployment NPL transaction (outlined below), which is extremely low given rate from 2008 to forecast 2011 total market NPLs increased by almost EUR17 billion in 2009. 9.0% 9.0% 7.0% 7.0% Seller Buyer Asset Type Face Value Completion 5.0% 5.0% (in EUR Date 3.0% 3.0% millions) 1.0% 1.0% Cross Factor S.p.A Agathos Consumer 6.7 20/10/2009 -1.0% -1.0% Finance Srl loan 2008 A 2009 A 2010 F 2011 F -3.0% -3.0% -5.0% -5.0% GDP (change % Unemployment Fundamentals appear to be returning yoy) Source: Bloomberg Despite such a low transaction level, we are starting to see some signs of recovery in the Italian economy and therefore expect to see more NPL activity during 2010. After a long period of inactivity, a number of lenders are testing the appetite NPL coverage ratios of investors for NPLs. However, feedback is that sellers still believe prices are too low and for loans that are backed by real Despite the significant portfolio deterioration experienced by estate, the lengthy legal process investors need to go through Italian banks during 2009, a number of financial institutions before they can claim title to the underlying assets is seen as have managed to maintain NPL coverage ratios at or around a big negative. Despite this, some international players, both 60 per cent of gross NPLs. In the examples shown below, incumbent and new entrants, are showing renewed interest in despite increasing value of NPLs, average ratios have only Italian assets – a positive sign for the NPL market. changed marginally over the same period. With portfolios expected to continue to deteriorate over 2010, it will be Another important consideration for Italian banks is exposure to interesting to see whether the coverage level is maintained. Central and Eastern Europe (CEE). A number of banks, including Unicredit and Intesa, have significant operations in countries Table 14 – Development of NPL portfolio from three key such as Hungary, Romania, Russia, Kazakhstan and Ukraine. banks (in EUR billions) The micro and macro economic outlook in these countries is 35.0 concerning, which might encourage the Italian banks to reduce 30.0 their exposure, either through discontinuing the origination of certain product types (i.e. company leasing in Romania) or 25.0 sale of non-core assets. We are aware of a number of NPL 20.0 sale processes currently being discussed, or in progress, by 15.0 b idi i f It li b k i R i Sl i dH 10.0 5.0 - Uncredit Intesa BMPS 2008 H109 Q309 2009 Source: Financial Statements 8 | NPL Europe • Issue 2 • June 2010
- 10. Since coming into power, the PASOK government has drafted Greece two pieces of legislation which may have a considerable impact on the value and recoverability of NPLs. The first was passed into During 2009, total NPLs (defined as the sum of the outstanding law on 19 January 2010 and relates to SMEs. It allows debtors to balance of impaired loans and advances to customers at the force creditor banks to enter into restructuring negotiations with end of the financial year, plus loans and advances not impaired SMEs that defaulted since 1 January 2007, or that are current but but past due more than 90 days) for the top six Greek banks experiencing financial difficulties. The second piece of legislation, increased year-on-year by 53 per cent to EUR20 billion. which is still in draft, relates to a new consumer bankruptcy Despite the increase there has been very little activity in the NPL regime. There has been significant concern about the possible sale market, with banks preferring to manage defaulted loans moral hazard implications of the regime and impact the law will in-house or by outsourcing collections to agents and lawyers have on the functioning of the financial system. The European because of minimal interest from international investors at their Central Bank (ECB) has highlighted both concerns in its response 13 selling prices. to the Greek Government . Table 16 – NPL portfolio development by bank Despite still being in draft form, our discussions with local banks (in EUR billions) and collection agencies indicate the legislation has already had significant impact on collections, liquidity and capital in October 25.0 and November 2009, when borrowers mistakenly thought it 20.0 would reduce their overdue debts by 90 per cent. Although collections appear to have recovered somewhat in 2010, 15.0 investors continue to factor in significant discounts for market risk while the draft remains in circulation. It is for these reasons 10.0 that the unsecured consumer NPL portfolio brought to market by Emporiki Bank at the end of 2009 has not yet traded. On a 5.0 positive note, both the ECB (24 April 2010) and IMF (May 2010) issued papers which specifically refer to the draft consumer - bankruptcy legislation and state that it needs to be consistent 2006 2007 2008 2009 with market best practice, avoid moral hazard, and take into account the existing relationship between debtors and creditors Marfin Bank Alpha Bank Eurobank to ensure legal certainty. We believe as a result of these papers it Piraeus Bank Emporiki Bank NBG is unlikely the legislation will be passed in its current form, which Source: Annual Financial Statements should help to ease investor concerns. Table 17– NPL portfolio development by product Seller Buyer Asset Type Face Value Completion (in EUR billions) (in EUR Date millions) 25.0 Emporiki Bank n/a Unsecured 110 In progress 20.0 Consumer 15.0 Unemployment and consumer portfolios 10.0 There is no publicly available information on any NPL portfolios 5.0 coming to market in the next six months. However, the NPL ratio for all major Greek banks is expected to increase significantly - during 2010 due to deteriorating economic conditions in Greece 2006 2007 2008 2009 and a number of CEE countries to which most Greek banks have material exposures. With S&P’s recent downgrade of Consumer Mortgages Corporate Greek government debt to BB+, we would expect ratings for Source: Annual Financial Statements local Greek banks to also be impacted, which will further increase liquidity pressure. Austerity measures and uncertainty This, coupled with an unemployment rate which according to the European Commission is expected to increase to The elections of November 2009 resulted in the Socialist (PASOK) 11.8 per cent by the end of 2010, up from 9.5 per cent at the party forming government, and since then the Prime Minister and end of 2009, could open the door for investors to form servicing his team have come under significant pressure to bring Greece’s relationships (i.e. joint ventures) with Greek banks in order to finances back under control. The resulting austerity measures inject liquidity and leverage off the banks’ existing servicing that were passed through parliament on 5 March 2010 and platforms. There has also been increasing speculation the current 6 May 2010 have resulted in widespread strikes and Greek crisis will prompt consolidation within the financial sector demonstrations that have effectively brought the country to which may also prompt non-core or non-performing loan sales. a standstill. However, ultimately the continued monitoring of Greece by the International Monetary Fund (IMF) and support of the EU should help settle market volatility and improve the competitiveness of Greece. In the short term, VAT increases and wage reductions of up to 20 per cent in the public sector (which accounts for some 52 per cent of Greek employment) will considerably reduce domestic consumption and household wages, most likely 13. ECB website: http://www.ecb.int/ecb/legal/date/2010/html/index. resulting in future deterioration in the loan portfolios of en.html?skey=ECB/2010/1 Greek banks. NPL Europe • Issue 2 • June 2010 | 9
- 11. 10 | NPL Europe • Issue 2 • June 2010
- 12. Turkey Seller Buyer Completion Asset Type Face Value (in USD Date millions) Banks post positive growth, NPLs rise Akbank Girisim Asset N.A 326 5 January During 2009 the Turkish banking industry recorded remarkable Management 2010 profits exceeding TRY20 billion (USD13.2 billion), as total system Company loans grew by 7 per cent and banks had strong earnings from Fortis LBT Asset Retail Credits 116 1 trading bonds. During 2009 and the first two months of 2010, the December NPL ratio of the Turkish banking system continued to escalate T. Bankası I Management & Credit Cards Standard N.A. 2009 186 30 November and reached 5.4 per cent in February 2010 (up from 5 per cent Asset 2009 in June 2009), as shown in the table below. NPL growth was Management primarily driven by SME and retail customers, which has put a Company strain on the operating capacity of the banks due to a jump in T. I Bankası LBT Asset N.A. 38 16 the number of files that need tracking for these classes of NPLs. November Management 2009 Table 18 – Development of loan portfolio in Turkish market Company (in TRY billions) Akbank Girisim Asset N.A. 337 12 September 15.0% 500.0 Management 2009 13.5% 450.0 Company 12.0% 400.0 Yapi Kredi Girisim Asset Retail Credits 10.5% 350.0 394 28 May 2009 9.0% 300.0 Management & Credit Cards 7.5% 250.0 Company 6.0% 200.0 Source: Press Releases 4.5% 150.0 3.0% 100.0 1.5% 50.0 Turkish banks have a comparatively strong 0.0% - 2003 2004 2005 2006 2007 2008 2009 2010 2Q capital base and high provisions Total Loans NPL Ratio Turkish banks have comparatively strong capital positions Source: Banking Regulation and Supervision Agency (BRSA) of around a 20 per cent capital adequacy ratio, which means a decision to sell is primarily driven by operational Table 19 – NPL ratio development by key product type capacity constraints rather than a need to increase liquidity. 8.0% In response to the increasing level of delinquent accounts, Turkish banks continued to increase their NPL provision 7.0% coverage ratio during 2009 and 2010, with the sector’s 6.0% coverage ratio increasing to 84 per cent in February 2010. 5.0% As evidenced in the table below, most of the key private 4.0% banks in Turkey are well provisioned compared to peers in 3.0% other jurisdictions. 2.0% in TRY billions Total NPLs Provisions NPL Ratio Provisions 1.0% Loans Coverage 0.0% Ratio Q406 Q107 Q207 Q307 Q407 Q108 Q208 Q308 Q408 Q109 Q209 Q309 Is Bankası 52.7 2.8 3.0 5.0% 100.0% Akbank 44.6 1.8 1.8 4.0% 100.0% Total Retail SME Corp/Commercial Source: Banking Regulation and Supervision Agency (BRSA) Garanti Bank 53.0 2.3 1.8 4.3% 81.4% Yapı Kredi Bank* 37.8 2.6 1.8 6.9% 70.6% Vakif Bank* 33.2 2.2 1.9 6.5% 91.3% NPL portfolio transactions from August 2009 Source: Banks’ own financials by 31.12.2009 for Akbank, T.Is Bank and Garanti exceed USD1 billion * 3Q2009 results for Yapi Kredi and Vakifbank Total NPL portfolio sales of listed banks have more than doubled compared with the first half of 2009, exceeding a face With market conditions and pricing dynamics improving, value of USD1 billion . The table below is a list of the key NPL we expect banks to bring additional SME, retail and credit transactions that occurred during 2009. PricewaterhouseCoopers card NPL portfolios to market during 2010. assisted Is Bank with its successful portfolio sales during 2009. Historically, the Turkish NPL market has been dominated by corporate portfolios, however since June 2009 many banks, including Fortis and Yapı Kredi, have successfully sold unsecured consumer portfolios in response to a sharp increase in defaults. The fact the portfolios were traded successfully is a positive sign to other potential sellers that the Turkish investment community is comfortable with the servicing options for this new class of NPL assets. NPL Europe • Issue 2 • June 2010 | 11
- 13. Central and Eastern Europe Slow and painful recovery With unemployment forecast to increase across the region and During 2009, many CEE countries experienced currency corporate insolvencies remaining at the same level or higher than devaluation and the banking industry was impacted by relatively in 2009, economic recovery in CEE is likely to be slow, painful lax underwriting policies borne out of the competitive banking and place considerable strain on internal workout teams. landscape that existed from 2006 to 2008. As a result of these Table 23 – Macroeconomic considerations for retail factors and an inability to refinance debt at the same low interest portfolios rates, many people and businesses were not able to repay their debts, which were often denominated in foreign currency. The Macroeconomic indicators 2009E 2010F 2011F steep growth in the level of NPLs across CEE can be seen in the GDP per head (US$ at PPP) table below. Romania 11,810 12,100 12,630 Table 21 – NPL development 2008 and 2009 (in EUR billions) Czech Republic 24,840 25,430 26,410 Poland 18,040 18,780 19,580 Serbia Hungary 18,840 19,010 19,840 Slovakia Croatia Croatia 17,660 17,730 18,430 Slovenia Slovenia 28,030 28,250 29,390 Hungary Slovakia 20,880 21,700 22,610 Czech Republic Ukraine Unemployment Rate (av; %) Poland Romania 6.0 8.5 8.8 Romania Czech Republic 8.1 10.8 9.7 Russia Poland 11.0 12.0 11.1 - 5.0 10.0 15.0 20.0 25.0 2008 2009 Hungary 10.0 11.4 9.6 Source: National central banks and regulators Croatia 16.0 14.9 13.7 Slovenia 9.4 9.2 8.5 Table 22 – Cost of the bankruptcy proceedings Slovakia 11.4 13.0 11.8 (as per cent of estate) Exchange Rate (av; %) 50% Romania 4.24 4.05 4.18 Czech Republic 26.55 25.90 25.10 40% Poland 4.33 3.88 3.83 30% Hungary 280.60 278.00 275.00 Croatia 7.44 7.41 7.35 20% Source: EIU 10% Table 24 – Annual percentage change of 0% Czech Hungary Poland Romania Bulgaria Ukraine corporate insolvencies 2009 Q3 80.0 Source: Broker Research, forecasts DBR as of 20 August 2009 60.0 40.0 20.0 Restructuring and workout results 0.0 As a result of these factors CEE banks have found themselves -20.0 in a difficult position. With limited restructuring and workout -40.0 2007 2008 2009F 2010F experience to draw from internally, and with parent banks -60.0 engrossed with problems of their own, CEE banks have had to find their own way of dealing with the spike in consumer, SME Poland Czech Slovak Hungary Central and Eastern Republic Republic Europe and corporate defaults. Our experience is that the results have Source: Euler Hermes - Insolvency Forecast 2010 been mixed and in most cases have simply deferred the problem by making deals with borrowers, rather than restructuring the debt position of the borrower. This is anecdotally supported by the fact that there have been relatively few corporate failures in Ukraine CEE when considering the macroeconomic deterioration and funding squeeze. Ukraine changes to tax law encourages NPL portfolio trades A couple of positives for CEE banks in 2009 were that consumers continued to save and also continue to believe that investing in In the Ukraine, many banks were rolling over NPLs during 2009 real estate is not only safe, but is also a way to accumulate equity partly because of negative tax incentives on write-downs. This capital. This has provided banks with a steady source of cheap legislation was changed in the fourth quarter of 2009. The impact funds and to an extent stabilised the CEE property market, to of such portfolio management is that the official NPL statistic of which many banks outside CEE have heavy exposure. 9.6 per cent at the end of 2009 is most likely understated. The IMF estimates that at the end of 2009, NPLs in Ukraine amounted to around 30 per cent. 12 | NPL Europe • Issue 2 • June 2010
- 14. In the last quarter of 2009, the Credit Collection Group estimated The Czech banking sector is dominated by three banks that unsecured consumer NPL sales amounted to over UAH which together account for more than 71 per cent of total 2 billion (EUR 170 million), at an average price of 10 per cent of banking sector assets: Ceska Sporitelna a.s. (Erste Bank Sub), face value. We understand that Pravex-Bank, ING Bank Ukraine, Ceskoslovenska obchodni banka a.s. (KBC Group Sub) and Credit Europe Bank, Index-Bank, SEB Bank, OTP Bank, BTA Komercni banka a.s (Societe Generale Sub). Bank, Kredobank, Renaissance Credit, Unicredit Bank and Platinum Bank all undertook NPL sale transactions and in most NPLs (defined by the Czech National Bank as non-standard cases the portfolios were sold to local collection agents. loans) increased 64 per cent in 2009 or CZK45 billion. Thus, NPLs account for 4.5 per cent of gross loans at the end of 2009, up from 2.8 per cent in 2008. The majority of growth was due to a Croatia 40 per cent increase in corporate insolvencies during 2009. Table 25 – NPL (non-standard loan) development Croatia LLP coverage rising 2008 and 2009 (in CZK billions) In Croatia, loan growth in 2009 was 2.4 per cent, driven by a 120.0 5.0% 47 per cent increase in state-related loans (from HRK 21.5billion 4.5% to HRK 31.5 billion). This was due to a significant increase in the 100.0 4.0% country’s budget deficit. Meanwhile, retail loans decreased 3.5% 80.0 3.9 per cent (from HRK 122.7 billion to HRK 117.9 billion) 3.0% because of increased credit risk awareness among larger banks. 60.0 2.5% Corporate loans remained stable (from HRK 94.1 billion to 2.0% HRK 94.8 billion). 40.0 1 .5% 1.0% 20.0 The country has also seen significant deterioration in the 0.5% loan quality, with the LLP rate for the sector increasing - 0.0% from 2.4 per cent at 31 December 2008 to 3.3 per cent at 2004 2005 2006 2007 2008 Q109 Q209 Q309 Q409 31 December 2009. At a sub-segment level, LLP for retail loans increased from 2.5 per cent to 3.5 per cent (primarily driven by Amounts (in billion CZK) NPL % unsecured consumer loan defaults) and LLP for corporate loans Source: Czech National Bank increased from 2.9 per cent to 4.4 per cent. Slovenia Unsecured consumer portfolios Slovenia average loan maturity decreases The sale of unsecured consumer NPLs continues to be a popular portfolio management strategy for a number of Czech Total loans in Slovenia increased 3.8 per cent in the period financial institutions. For this reason there are a large number January 2009 to September 2009, but demand for housing loans of legal firms and collection agencies that participate regularly fell sharply in early 2009 and then stagnated, putting pressure in sale processes. During a recent portfolio sale where on prices. This trend was also observed in consumer goods PricewaterhouseCoopers acted as advisor to the seller, purchases, reflecting a steep decline in consumer confidence. 15 individual investors (both local and international) showed During the period, Slovenian banks significantly tightened their initial interest in the portfolio. underwriting policies and reduced the average maturity of loans being written for corporate and SME customers, making it more Seller Buyer Asset Type Face Value difficult for them to roll over obligations. This resulted in a spike in Completion (in CZK Date corporate insolvencies and the level of NPLs. millions) Confidential Confidential Consumer 80 March 2010 Czech Republic loans, cash loans Total banking sector assets increased by 1.2 per cent in 2009, KB N/A Retail loans Approx. 100 reaching CZK 4,092bn on 31 December (Source: Czech National Multiple sales Bank). Following a period of double-digit growth from 2005 to throughout 2008, loans increased by less than 1 per cent year-on-year at the 2009 end of 2009, with loans to households the main contributors to this growth. Source: PwC market research Bank liquid assets, corporate insolvencies up Foreign banks and Czech portfolios According to the Czech National Bank, the banking sector recorded no significant liquidity problems in 2009 and there is no Due to the solid liquidity positions and the fact that the banking change to this expected in 2010. The value of liquid assets rose sector as a whole generated a net profit of CZK60.2 billion in by more than 11 per cent in 2009 and its share of total banking 2009, it is unlikely the three major banks will come to market sector assets also increased year-on-year. Sufficient primary with large portfolios of defaulted corporate or real estate loans funds are available to finance the banking sector’s transactions; in 2010. However, some international banks that started to grow with the volume of client deposits increasing 3.2 per cent in 2009. their Czech portfolios during the competitive period from 2006 to 2009 could have underwritten riskier loans to gain market share. Therefore, sub-performing non-core assets could be disposed of by international players seeking to discontinue certain products NPL Europe • Issue 2 • June 2010 | 13