Poster75: Quantitative real time PCR assessment of cassava transgenic plants: copy number estimate and quantification of gene expression
•
1 like•1,344 views

This study developed quantitative PCR (qPCR) methods to estimate transgene copy number and quantify mRNA levels in transgenic cassava plants obtained through Agrobacterium-mediated transformation. qPCR analysis of 15 lines found most contained 1-2 copies of the GUSPlus and hptII genes. Comparison to Southern blot analysis showed 83.3% agreement between the two methods. qPCR also grouped lines into high, medium, and low expression categories based on GUSPlus and hptII mRNA levels, with up to 380-fold and 3,000-fold differences between highest and lowest expressors. Results validated qPCR as a more efficient technique than conventional methods for characterizing transgene integration and expression in cassava.
Recommended

Recommended
More Related Content
Viewers also liked
Viewers also liked (14)
More from CIAT
More from CIAT (20)
Recently uploaded
Recently uploaded (20)
Poster75: Quantitative real time PCR assessment of cassava transgenic plants: copy number estimate and quantification of gene expression
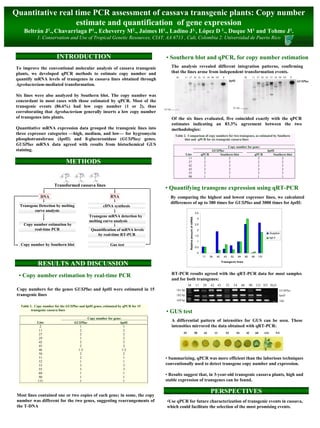
- 1. Quantitative real time PCR assessment of cassava transgenic plants: Copy number estimate and quantification of gene expression Beltrán J1., Chavarriaga P1., Echeverry M2., Jaimes H1., Ladino J1., López D 1., Duque M1 and Tohme J1. 1. Conservation and Use of Tropical Genetic Resources, CIAT, AA 6713 , Cali, Colombia 2. Universidad de Puerto Rico INTRODUCTION • Southern blot and qPCR, for copy number estimation To improve the conventional molecular analysis of cassava transgenic The analysis revealed different integration patterns, confirming plants, we developed qPCR methods to estimate copy number and that the lines arose from independent transformation events. M 11 27 42 43 53 54 90 NT P M 11 27 42 43 53 54 90 NT P quantify mRNA levels of transgenes in cassava lines obtained through hptII GUSPlus Agrobacterium-mediated transformation. Six lines were also analyzed by Southern blot. The copy number was concordant in most cases with those estimated by qPCR. Most of the transgenic events (86.6%) had low copy number (1 or 2), thus 0.5 kb 0.5 kb corroborating that Agrobacterium generally inserts a low copy number of transgenes into plants. Of the six lines evaluated, five coincided exactly with the qPCR estimates indicating an 83.3% agreement between the two Quantitative mRNA expression data grouped the transgenic lines into methodologies: three expresser categories —high, medium, and low— for hygromycin Table 2. Comparison of copy numbers for two transgenes, as estimated by Southern phosphotransferase (hptII) and ß-glucuronidase (GUSPlus) genes. blot and qPCR for six transgenic cassava lines GUSPlus mRNA data agreed with results from histochemical GUS Copy number for gene: staining. GUSPlus hptII Line qPCR Southern blot qPCR Southern blot 11 2 2 2 2 METHODS 27 42 2 2 2 3 2 2 2 3 43 2 2 2 2 53 3 3 3 3 90 1 1 1 1 Transformed cassava lines • Quantifying transgene expression using qRT-PCR DNA RNA By comparing the highest and lowest expresser lines, we calculated differences of up to 380 times for GUSPlus and 3000 times for hptII: Transgene Detection by melting cDNA synthesis curve analysis 3.5 Transgene mRNA detection by Relative amount of mRNA 3 melting curve analysis Copy number estimation by 2.5 real-time PCR Quantification of mRNA levels 2 Gusplus by real-time RT-PCR 1.5 hpt II 1 Copy number by Southern blot Gus test 0.5 0 11 29 42 43 52 54 60 90 131 RESULTS AND DISCUSSION Transgenic lines • Copy number estimation by real-time PCR RT-PCR results agreed with the qRT-PCR data for most samples and for both transgenes: M 11 29 42 43 52 54 60 90 131 NT H2O Copy numbers for the genes GUSPlus and hptII were estimated in 15 181 bp GUSPlus transgenic lines 182 bp hptII 169 bp 18S Table 1. Copy number for the GUSPlus and hptII genes, estimated by qPCR for 15 transgenic cassava lines • GUS test Copy number for gene: Line GUSPlus hptII A differential pattern of intensities for GUS can be seen. These 2 1 1 intensities mirrored the data obtained with qRT-PCR: 11 2 2 27 2 2 29 90 43 11 52 54 42 60 131 NT 29 1 2 42 2 2 43 2 2 46 1-2 1-2 50 2 2 51 2 1 • Summarizing, qPCR was more efficient than the laborious techniques 52 1 1 53 3 3 conventionally used to detect transgene copy number and expression. 55 3 3 60 1 1 • Results suggest that, in 3-year-old transgenic cassava plants, high and 90 1 1 131 1 1 stable expression of transgenes can be found. Most lines contained one or two copies of each gene; in some, the copy PERSPECTIVES number was different for the two genes, suggesting rearrangements of •Use qPCR for future characterization of transgenic events in cassava, the T-DNA which could facilitate the selection of the most promising events.