Introduction to CEH's Wallingford Meteorological Station
•Download as PPTX, PDF•
1 like•1,542 views

The Centre for Ecology & Hydrology has been measuring daily rainfall, sunshine and temperature at its Wallingford, Oxfordshire meteorological station since 1962. Observations are also made of cloud cover, present weather and visibility. This presentation was made to members of the Royal Meteorological Society's Meteorological Observing Systems Special Interest Group on 25 July 2014. Read more on the CEH blog: http://cehsciencenews.blogspot.co.uk/2014/07/royal-meteorological-society-members-visit.html

Recommended
Recommended
More Related Content
What's hot
What's hot (20)
Viewers also liked
Viewers also liked (8)
Similar to Introduction to CEH's Wallingford Meteorological Station
Similar to Introduction to CEH's Wallingford Meteorological Station (20)
More from UK Centre for Ecology & Hydrology
More from UK Centre for Ecology & Hydrology (14)
Recently uploaded
Recently uploaded (20)
Introduction to CEH's Wallingford Meteorological Station
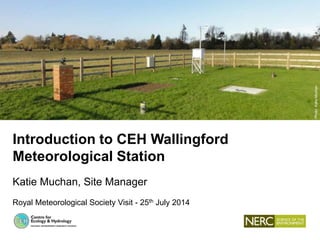
- 1. Introduction to CEH Wallingford Meteorological Station Katie Muchan, Site Manager Royal Meteorological Society Visit - 25th July 2014 Photo:KatieMuchan
- 2. Outline • Site and record history • Current monitoring • Analysis of the record • Extremes in the record • Ground level vs. Standard gauge • Surface – groundwater interactions • Data use
- 3. Site History Starting in 1962, the site now has 52 complete years of record for some variables (sunshine, max and min air temperature) Mean Temperature Temperature(°C
- 4. Site History Since the last RMS visit in 2007, the site has moved twice 1962 – 2007 location 2007 – 2011 location 2011 – current location Source: Bing Maps
- 5. Current site instrumentationManual Site Wind vane and anemometer Stevenson screen (4 x air temperature) Soil thermometers (10cm, 30cm, 100cm) Ground temperature (concrete and grass) Campbell-Stokes sunshine recorder Storage raingauges (standard and ground- level) AWS Didcot AWS (air temperatures, wind direction, wind speed, solar radiation, sunshine) Tipping bucket raingauges (standard and ground-level) Equipment Testing Area Snowdon raingauge Radiometers Soil moisture probes
- 6. Analysis: Site Records • Extremes recorded at the site over the last 53 years • Most recently, the wettest winter on record (2013/2014) Record Day / Month Figure Wettest month August 1977 163.6mm Driest month April 2007 1.0mm Warmest day 19th July 2006 35.2°C Coldest night 14th January 1982 -21.0°C ‘Sunniest’ month June 1975 291.5 hours ‘Cloudiest’ month December 2010 12.7 hours
- 7. The winter of 2013/2014 • Three months of above average rainfall December 2013 January 2014 February 2014 Winter 2013/2014 Total rainfall in mm 97.9 148.4 112.9 359.2 Maximum monthly rainfall total in mm (Year*) 131.2 (1989) 118.7 (1995) 103.3 (1990) 311.5 (1989/1990) Average monthly rainfall total in mm 57.7 54.6 37.5 148.8 % of monthly average 170 272 302 241 Photo: Katie Muchan Photo: Katie Muchan
- 8. The winter of 2013/2014 • Three months of above average rainfall • Total rainfall: 359.2mm • Annual average of 595.4mm • Previous maximum: 311.5mm Photo: Katie Muchan Photo: Katie Muchan
- 9. The winter of 2013/2014 • Three months of above average rainfall • Total rainfall: 359.2mm • Annual average of 595.4mm • Previous maximum: 311.5mm • Widespread and persistent flooding Photo: Katie Muchan Photo: Katie Muchan
- 10. Analysis: Raingauge height • ‘Undercatch’ in standard raingauges from several sources • Exposure (wind) thought to cause the largest difference Photo: Harry Dixon Rodda and Dixon (2012) Rainfall Measurement Revisited, Weather, 67. 5. 131-136. DOI: 10.1002/wea.875
- 11. Analysis: Raingauge height • ‘Undercatch’ in standard raingauges from several sources • Exposure (wind) thought to cause the largest difference • Extensive tests in 1960s • Both still in use on the site today Photo: Harry DixonPhoto: Harry Dixon Rodda and Dixon (2012) Rainfall Measurement Revisited, Weather, 67. 5. 131-136. DOI: 10.1002/wea.875
- 12. Analysis: Raingauge height • Tests in the 1970-80s showed up to 16% ‘undercatch’ at exposed sites • Wallingford site: average annual difference in catch was 5.6% (1969-2006) Rodda and Dixon (2012) Rainfall Measurement Revisited, Weather, 67. 5. 131-136. DOI: 10.1002/wea.875
- 13. Analysis: Rainfall, Rivers & Groundwater • Rainfall, groundwater level and river level monitoring with BGS
- 14. Analysis: Rainfall, Rivers & Groundwater • Rainfall, groundwater level and river level monitoring with BGS • How do groundwater levels in a shallow aquifer interact with rainfall events? • Aquifer and river show quick response to rainfall
- 15. Outreach and Data Uses • Part of the Met Office National climate network • Site 5558
- 16. Outreach and Data Uses • Part of the Met Office National climate network • Site 5558 • Support National Hydrological Monitoring Programme
- 17. Outreach and Data Uses • Part of the Met Office National climate network • Site 5558 • Support National Hydrological Monitoring Programme
- 18. Outreach and Data Uses • Part of the Met Office National climate network • Site 5558 • Support National Hydrological Monitoring Programme • Small information pieces • CEH blog post on winter rainfall • Data included in BHS Circulation bulletins
- 19. Outreach and Data Uses • Part of the Met Office National climate network • Site 5558 • Support National Hydrological Monitoring Programme • Small information pieces • CEH blog post on winter rainfall • Data included in BHS Circulation bulletins • Support CEH research • Instrument testing • Site visits http://cehsciencenews.blogspot.co.uk/2014/03/winter-rainfall-record-wallingford- met-site.html
- 20. Outreach and Data Uses • Part of the Met Office National climate network • Site 5558 • Support National Hydrological Monitoring Programme • Small information pieces • CEH blog post on winter rainfall • Data included in BHS Circulation bulletins • Support CEH research • Instrument testing • Site visits
- 21. Outreach and Data Uses • Part of the Met Office National climate network • Site 5558 • Support National Hydrological Monitoring Programme • Small information pieces • CEH blog post on winter rainfall • Data included in BHS Circulation bulletins • Support CEH research • Instrument testing • Site visits
- 22. Outreach and Data Uses • Part of the Met Office National climate network • Site 5558 • Support National Hydrological Monitoring Programme • Small information pieces • CEH blog post on winter rainfall • Data included in BHS Circulation bulletins • Support CEH research • Instrument testing • Site visits
- 23. Website • Launched in December 2012 • Near real-time daily data • Future plans to add AWS data http://www.ceh.ac.uk/data/metsite/wallingfordmetsite.html
- 24. CEH Monitoring • Wider meteorological monitoring network • Other CEH monitoring networks • Ecological • Soils • Vegetation • Water • Air Chemistry COSMOS-UK Chalk Rivers Biosphere-Atmosphere Interactions Soils