More Related Content
Similar to Richardson TX - Housing Market Report - August 2010
Similar to Richardson TX - Housing Market Report - August 2010 (17)
More from Valarie Littles
More from Valarie Littles (20)
Richardson TX - Housing Market Report - August 2010
- 1. Valarie Littles Ultima Real Estate
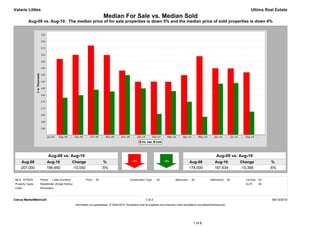
Median For Sale vs. Median Sold
Aug-09 vs. Aug-10: The median price of for sale properties is down 5% and the median price of sold properties is down 6%
Aug-09 vs. Aug-10 Aug-09 vs. Aug-10
Aug-09 Aug-10 Change % Aug-09 Aug-10 Change %
207,000 196,950 -10,050 -5% 178,000 167,634 -10,366 -6%
MLS: NTREIS Period: 1 year (monthly) Price: All Construction Type: All Bedrooms: All Bathrooms: All Lot Size: All
Property Types: Residential: (Single Family) Sq Ft: All
Cities: Richardson
Clarus MarketMetrics® 1 of 2 09/13/2010
Information not guaranteed. © 2009-2010 Terradatum and its suppliers and licensors (www.terradatum.com/about/licensors.td).
1 of 6
- 2. Valarie Littles Ultima Real Estate
Median For Sale vs. Median Sold
Aug-09 vs. Aug-10: The median price of for sale properties is down 5% and the median price of sold properties is down 6%
For Sale # Properties Sold # Properties Price
Time Period Median For Sale Median Sold Difference
Aug-10 196,950 586 167,634 74 -29,317
Jul-10 199,900 575 189,000 63 -10,900
Jun-10 200,000 507 188,500 90 -11,500
May-10 209,000 479 163,800 82 -45,200
Apr-10 194,900 505 175,000 93 -19,900
Mar-10 189,900 460 183,000 69 -6,900
Feb-10 189,950 368 165,900 53 -24,050
Jan-10 189,900 337 185,000 43 -4,900
Dec-09 198,290 332 194,900 53 -3,389
Nov-09 209,900 338 182,750 80 -27,150
Oct-09 217,000 355 184,000 84 -33,000
Sep-09 210,000 353 179,900 77 -30,100
Aug-09 207,000 366 178,000 94 -29,000
Clarus MarketMetrics® 2 of 2 09/13/2010
Information not guaranteed. © 2009-2010 Terradatum and its suppliers and licensors (www.terradatum.com/about/licensors.td).
2 of 6
- 3. Valarie Littles Ultima Real Estate
Supply & Demand by Month
Aug-09 vs. Aug-10: The number of for sale properties is up 60% and the number of sold properties is down 21%
Aug-09 vs. Aug-10 Aug-09 vs. Aug-10
Aug-09 Aug-10 Change % Aug-09 Aug-10 Change %
366 586 220 +60% 94 74 -20 -21%
MLS: NTREIS Period: 1 year (monthly) Price: All Construction Type: All Bedrooms: All Bathrooms: All Lot Size: All
Property Types: Residential: (Single Family) Sq Ft: All
Cities: Richardson
Clarus MarketMetrics® 1 of 2 09/13/2010
Information not guaranteed. © 2009-2010 Terradatum and its suppliers and licensors (www.terradatum.com/about/licensors.td).
3 of 6
- 4. Valarie Littles Ultima Real Estate
Supply & Demand by Month
Aug-09 vs. Aug-10: The number of for sale properties is up 60% and the number of sold properties is down 21%
# Properties Average DOM # Properties Average DOM
Time Period For Sale For Sale Sold Sold
Aug-10 586 89 74 54
Jul-10 575 102 63 51
Jun-10 507 119 90 65
May-10 479 123 82 52
Apr-10 505 121 93 47
Mar-10 460 124 69 58
Feb-10 368 134 53 46
Jan-10 337 137 43 54
Dec-09 332 146 53 56
Nov-09 338 144 80 46
Oct-09 355 139 84 37
Sep-09 353 131 77 49
Aug-09 366 128 94 50
Clarus MarketMetrics® 2 of 2 09/13/2010
Information not guaranteed. © 2009-2010 Terradatum and its suppliers and licensors (www.terradatum.com/about/licensors.td).
4 of 6
- 5. Valarie Littles Ultima Real Estate
Months Supply of Inventory
Aug-09 vs. Aug-10: The average months supply of inventory is up 116%
Aug-09 vs. Aug-10
Aug-09 Aug-10 Change %
3.0 6.5 3.5 +116%
MLS: NTREIS Period: 1 year (monthly) Price: All Construction Type: All Bedrooms: All Bathrooms: All Lot Size: All
Property Types: Residential: (Single Family) Sq Ft: All
Cities: Richardson
Clarus MarketMetrics® 1 of 2 09/13/2010
Information not guaranteed. © 2009-2010 Terradatum and its suppliers and licensors (www.terradatum.com/about/licensors.td).
5 of 6
- 6. Valarie Littles Ultima Real Estate
Months Supply of Inventory
Aug-09 vs. Aug-10: The average months supply of inventory is up 116%
# Units For Sale # UC Units UC Average
Time Period Last Day of Month During Month MSI DOM
Aug-10 447 69 6.5 51
Jul-10 453 70 6.5 55
Jun-10 402 58 6.9 58
May-10 367 63 5.8 51
Apr-10 350 115 3.0 60
Mar-10 318 96 3.3 48
Feb-10 277 60 4.6 47
Jan-10 241 68 3.5 51
Dec-09 238 47 5.1 53
Nov-09 250 53 4.7 54
Oct-09 251 71 3.5 51
Sep-09 231 88 2.6 46
Aug-09 243 81 3.0 45
Clarus MarketMetrics® 2 of 2 09/13/2010
Information not guaranteed. © 2009-2010 Terradatum and its suppliers and licensors (www.terradatum.com/about/licensors.td).
6 of 6