SEO & PPC Strategy for Branded Search - BESegal Web Analytics

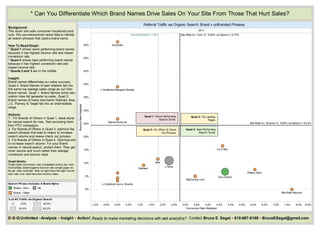
Background: This ecom site sells consumer household products. We use sessionized visitor data. How To Read Graph: * Quad 1 shows worst performing brand names because it has highest bounce rate and lowest conversion rate. * Quad 4 shows best performing brand names because it has highest conversion rate and lowest bounce rate. * Quads 2 and 3 are in the middle. Insight: Brand names differentiate sales success. We can identify which Brands of Others generate above average sales for us and which ones deliver below average sales for us. Actions: 1. Optimize site to increase search volume for Brands of Others in Quad 1. 2. For Brands of Others in Quad 3, optimize the search phrases that lead to orders to increase search volume and review check out process 3. For Brands of Others in Quad 4, leave alone for now for natural search. Test excluding them from PPC campaigns for PPC traffic. 4. Protect your own brand name in natural search. It gets the most volume along with much better than average conversion and bounce rates. Graph Details: Graph plots conversion rate (completed orders per visit) horizontally bottom against bounce rate (single page visits per visit) vertically. Dots on right have the high conversion rate. Low dots have low bounce rates.