Web Analytics: Do You Know How To find 17% More Revenue Hiding in Your Web Traffic?
•
1 like•316 views

Don't let this happen to you. This case study shows how we showed a company how to find lost orders hidden in traffic growth from SEO and other campaigns before it's too late. We measured the lost sales - after the fact - and found the company lost 16,400 orders and $927,000 in revenue. Then we showed the company how to keep this from happening again and how to find this kind of hidden revenue as it happens not after the fact.

Recommended
Recommended
More Related Content
Recently uploaded
Recently uploaded (20)
Featured
Featured (20)
Web Analytics: Do You Know How To find 17% More Revenue Hiding in Your Web Traffic?
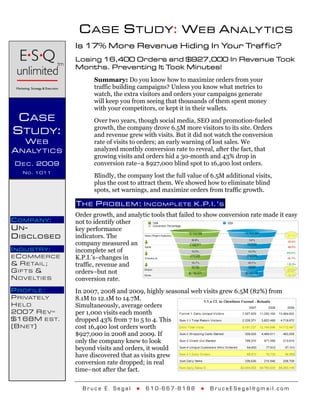
- 1. C ASE S TUDY: W EB A NALY TICS Is 17% More Revenue Hiding In Your Traf fic? Losing 16,400 Orders and $927,000 In Revenue Took Months. Preventing It Took Minutes! Summary: Do you know how to maximize orders from your traffic building campaigns? Unless you know what metrics to watch, the extra visitors and orders your campaigns generate will keep you from seeing that thousands of them spent money with your competitors, or kept it in their wallets. C ASE Over two years, though social media, SEO and promotion-fueled growth, the company drove 6.5M more visitors to its site. Orders S TUDY: and revenue grew with visits. But it did not watch the conversion W EB rate of visits to orders; an early warning of lost sales. We A NALY TICS analyzed monthly conversion rate to reveal, after the fact, that growing visits and orders hid a 30-month and 43% drop in D E C . 2009 conversion rate–a $927,000 blind spot to 16,400 lost orders. NO. 1011 Blindly, the company lost the full value of 6.5M additional visits, plus the cost to attract them. We showed how to eliminate blind spots, set warnings, and maximize orders from traffic growth. T H E P ROBLEM : I N C O M P L E T E K.P.I.Ê S Order growth, and analytic tools that failed to show conversion rate made it easy C O M PA N Y: not to identify other UN- key performance DISCLOSED indicators. The company measured an I N D U S T R Y: incomplete set of ECOMMERCE K.P.I.’s–changes in & R E TA I L ; traffic, revenue and GIFTS & orders–but not N O V E LT I E S conversion rate. PROFILE: In 2007, 2008 and 2009, highly seasonal web visits grew 6.5M (82%) from P R I VAT E LY 8.1M to 12.1M to 14.7M. HELD Simultaneously, average orders 2007 R E V = per 1,000 visits each month $168M E S T. dropped 43% from 7 to 5 to 4. This (B N E T ) cost 16,400 lost orders worth $927,000 in 2008 and 2009. If only the company knew to look beyond visits and orders, it would have discovered that as visits grew conversion rate dropped; in real time–not after the fact. Bruce E. Segal ● 610-667-8188 ● BruceESegal@gmail.com
- 2. Page 2 of 3 T H E S OL UTION : I D E N T I F Y A L L K E Y P E R F O R M A N C E M E T R I C S Before: This funnel report demonstrates how easily good news stops you from analyzing data further, or evaluating additional key performance indicators. It reports from 2008 to 2009: • 21% more visits, • 25% more orders, • 13% more revenue. Visits, orders and revenue all grew. In fact, the total number of orders for 2009 that emerged from the tip grew slightly faster than the number of visitors who entered at the top. So, orders grew faster than visitors; more good news. For 2009, the funnel makes sales performance look healthy and greater analysis unnecessary. In 2008, the table shows, total Visits grew by 48% and Orders by 21%. Because they show growth, they make it easy to miss that Visits growing faster than Orders hints at lost order opportunities.1 Looking only at year to year comparisons, these KPI’s fail to show if the number of visitors who ordered each month, conversion rate, kept pace with other growth; a key indicator of the quality of new traffic, ease of site navigation and success of marketing campaigns. After: We analyzed monthly growth and conversion rate trends, and revealed that the growth in visits should have generated even more orders in 2008 and 2009. And even though 2007 had the lowest number of visits and orders, it had the highest average monthly conversion rate.2 For 2008, we revealed that in every month the conversion rate was lower than in 2007. (Graph 1) Visit growth of 48% hid poor conversion rates, and 14,500 lost orders worth $821,000; 17% of 2008 revenue. Graph 1 | Source: Bruce E. Segal 1 We analyzed both “Visits” and “Unique Visitors” and found comparable opportunity cost. 2 Yet, even 2007 lagged a conservative external benchmark of 1.8%-18 orders per 1,000 visits-reported by Shop.org in 2000 as an average sale conversion rate. Conservative, compared to 2.3% reported by the 2004 Fire Click Index. Bruce E. Segal ● 610-667-8188 ● BruceESegal@gmail.com 1011 ESQunltd Case Study Web Analyt Conversion Rate Undisclosed v2.doc
- 3. Page 3 of 3 For 2009, we found the conversion rate in each of the first 9 months of the year was lower than in 2008. (Graph 1) Then it climbed at the end of 2009, the peak traffic months, thus showing 25% order growth for the whole year, out paced 21% visitor growth and looked healthy. But 9 months of poor conversion rate hid 1,900 lost orders and $106,000; 2% of revenue spent elsewhere. Graph 2 shows the trend is a yearly step down in average monthly conversion rate. In 2007, 2008 and 2009, the average number of orders made per 1,000 visits each month dropped from 7 to 5 to 4; a 43% drop. Yet, in the same years visits grew 82% from 8.1M to 12.7M to 14.7M. Good news of visit and order growth hid bad news of lost sales. If only the company knew to watch conversion rate, it would have had an early warning Graph 2 | Source: Bruce E. Segal that it was missing the full value of traffic growth before loosing 16,400 orders, $927,000 and 9% of revenue. Unknowingly, the site wasted the cost of attracting millions of extra web visitors by failing to capture the full sales value of their visits. T H E R ESULT: U S E T H E R I G H T M E T R I C S . M A X I M I Z E O R D E R S . Insights 1, 2 & 3: 1. Visit growth increased orders, but hid a measurable and preventable failure to maximize sales. 2. Lost opportunity=16,400 orders, $927,000, 9% of revenue visitors spent elsewhere. 3. Measuring monthly and trended conversion rate against traffic and order growth provides early warning to potential lost sales, and if SEO programs, online ads or email campaigns bring visitors but not buyers, or if site design impairs orders. Immediate Actions: Measure and monitor visit to order conversion rate daily, weekly and monthly to establish a steady state and see sudden changes greater than 1 standard deviation. Monitor conversion rate for each marketing campaign, site design change and traffic change. Insight 4: 4. Even in 2007, the best year for average monthly conversion rate, the rate was still 2.6x lower than a conservative external benchmark. In three years, no month ever hit the benchmark. Mid-Term Actions: Increase conversion rate to exceed external benchmarks by testing and tracking marketing campaigns and separate web design changes. To see if Bruce and E*S*Q unlimited can help ensure you use the right performance indicators and set warnings to catch lost orders, call Bruce at 610-667-8188, or e-mail BruceESegal@gmail.com Bruce E. Segal ● 610-667-8188 ● BruceESegal@gmail.com 1011 ESQunltd Case Study Web Analyt Conversion Rate Undisclosed v2.doc