1. Market Overview
Positive absorption, retreating availability and vacancy rates and large corporate
transactions characterized an active Toronto North and East office leasing market
during the second quarter of 2015. Leasing activity remains strong in the North as
the market expanded for the second consecutive quarter, and while the availability
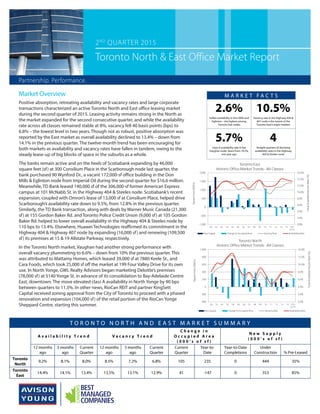
rate across all classes remained stable at 8%, vacancy fell 40 basis points (bps) to
6.8% – the lowest level in two years. Though not as robust, positive absorption was
reported by the East market as overall availability declined to 13.4% – down from
14.1% in the previous quarter. The twelve-month trend has been encouraging for
both markets as availability and vacancy rates have fallen in tandem, owing to the
steady lease-up of big blocks of space in the suburbs as a whole.
The banks remain active and on the heels of Scotiabank expanding by 46,000
square feet (sf) at 300 Consilium Place in the Scarborough node last quarter, the
bank purchased 90 Wynford Dr., a vacant 172,000-sf office building in the Don
Mills & Eglinton node from Imperial Oil during the second quarter for $16.6 million.
Meanwhile, TD Bank leased 140,000 sf of the 306,000-sf former American Express
campus at 101 McNabb St. in the Highway 404 & Steeles node. Scotiabank’s recent
expansion, coupled with Omron’s lease of 13,000 sf at Consilium Place, helped drive
Scarborough’s availability rate down to 9.5%, from 12.8% in the previous quarter.
Similarly, the TD Bank transaction, along with deals by Warner Music Canada (21,300
sf) at 155 Gordon Baker Rd. and Toronto Police Credit Union (9,000 sf) at 105 Gordon
Baker Rd. helped to lower overall availability in the Highway 404 & Steeles node by
110 bps to 13.4%. Elsewhere, Huawei Technologies reaffirmed its commitment in the
Highway 404 & Highway 407 node by expanding (16,000 sf) and renewing (109,500
sf) its premises at 15 & 19 Allstate Parkway, respectively.
In the Toronto North market, Vaughan had another strong performance with
overall vacancy plummeting to 6.6% – down from 10% the previous quarter. This
was attributed to Mattamy Homes, which leased 39,000 sf at 7880 Keele St., and
Cara Foods, which took 25,000 sf off the market at 199 Four Valley Drive for its own
use. In North Yonge, GWL Realty Advisors began marketing Deloitte’s premises
(78,000 sf) at 5140 Yonge St. in advance of its consolidation to Bay-Adelaide Centre
East, downtown. The move elevated class A availability in North Yonge by 90 bps
between quarters to 11.3%. In other news, RioCan REIT and partner KingSett
Capital received zoning approval from the City of Toronto to proceed with a phased
renovation and expansion (104,000 sf) of the retail portion of the RioCan Yonge
Sheppard Centre, starting this summer.
2ND
QUARTER 2015
Toronto North & East Office Market Report
Partnership. Performance.
NUMBER OF
BLDGS
TOTAL OFFICE
AREA (SQ. FT.)
NEW SUPPLY
TOTAL
OCCUPIED
AREA (SQ. FT.)
CHANGE IN
OCCUPIED
AREA (YTD)
(SQ. FT.)
TOTAL
VACANT
AREA (SQ. FT.)
TOTAL
VACANT RATE
(%)
DIRECT
AVAILABLE
(SQ. FT.)
SUBLET
AVAILABLE
(SQ. FT.)
TOTAL
AVAILABLE
(SQ. FT.)
TO
AVA
RA
'00 97 12,173,113 11,304,633 355,305 868,480 7.1% 891,484 99,453 990,937
'01 101 12,344,337 261,224 11,257,355 -47,278 1,086,982 8.8% 1,123,255 149,194 1,272,449
'02 100 12,284,337 11,105,144 -152,211 1,179,193 9.6% 1,098,194 158,602 1,256,796
'03 99 12,249,337 10,798,662 -306,482 1,450,675 11.8% 1,258,352 217,244 1,475,596
'04 102 12,901,829 752,727 11,304,865 506,203 1,596,964 12.4% 1,337,412 323,865 1,661,277
'05 104 13,064,556 11,790,009 485,144 1,274,547 9.8% 1,066,511 144,747 1,211,258
'06 104 13,064,556 60,000 12,285,143 495,134 779,413 6.0% 745,156 186,263 931,419
'07 105 13,175,056 174,556 12,159,327 -125,816 1,015,729 7.7% 783,065 259,804 1,042,869
'08 106 13,223,056 198,000 12,539,678 380,351 683,378 5.2% 671,696 193,626 865,322
'09 109 13,359,979 102,923 12,310,743 -228,935 1,049,236 7.9% 829,908 387,571 1,217,479
'10 0 271,768 5.9%
'11 0 220,954 4.1%
'12 130,428 -100,155 5.6%
'13 230,996 -51,950 7.6%
'14 109,873 67,610 7.8%
YTD
Q2'15 0 234,831 6.8%
GTA NORTH HISTORIC OFFICE MARKET TRENDS
0.0%
2.0%
4.0%
6.0%
8.0%
10.0%
12.0%
14.0%
-400
-200
0
200
400
600
800
1,000
'00 '01 '02 '03 '04 '05 '06 '07 '08 '09 '10 '11 '12 '13 '14 YTD
Q2'15
TotalAvailable/VacantRate(%)
SquareFeet(000's)
Toronto North
Historic Office Market Trends - All Classes
New Supply Change In Occupied Area Vacancy Rate Availability Rate
NUMBER OF
BLDGS
TOTAL OFFICE
AREA (SQ. FT.)
NEW SUPPLY
TOTAL
OCCUPIED
AREA (SQ. FT.)
CHANGE IN
OCCUPIED
AREA (YTD)
(SQ. FT.)
TOTAL
VACANT
AREA (SQ. FT.)
TOTAL
VACANT RATE
(%)
DIRECT
AVAILABLE
(SQ. FT.)
SUBLET
AVAILABLE
(SQ. FT.)
TOTAL
AVAILABLE
(SQ. FT.)
TOTAL
AVAILABLE
RATE (%)
'00 291 27,911,705 1,244,310 25,802,038 572,334 2,137,447 7.7% 2,230,170 380,890 2,611,060 9.4%
'01 300 29,425,492 1,749,040 26,320,681 518,643 3,104,811 10.6% 2,572,833 694,536 3,267,369 11.1%
'02 302 29,866,873 672,905 26,018,306 -302,375 3,848,567 12.9% 3,145,382 720,216 3,865,598 12.9%
'03 302 29,866,873 25,911,888 -106,418 3,954,985 13.2% 3,306,427 739,149 4,045,576 13.5%
'04 304 30,079,873 353,000 26,167,343 255,455 3,912,530 13.0% 3,026,816 722,983 3,749,799 12.5%
'05 306 30,208,177 437,598 26,911,668 744,325 3,296,509 10.9% 3,248,997 582,378 3,831,375 12.7%
'06 307 30,271,462 63,285 26,812,486 -99,182 3,458,976 11.4% 3,373,093 518,023 3,891,116 12.9%
'07 309 30,677,902 397,291 27,294,653 482,167 3,383,249 11.0% 2,985,158 487,838 3,472,996 11.3%
'08 309 30,717,863 151,769 27,348,455 53,802 3,380,808 11.0% 3,274,768 615,566 3,890,334 12.7%
'09 310 30,794,063 157,200 26,556,847 -791,608 4,238,416 13.8% 3,473,645 738,142 4,211,787 13.7%
'10 1,077,522 10.7% 11.9%
'11 170,546 118,221 9.6% 11.8%
'12 30,000 -496,322 11.4% 12.2%
'13 36,720 -350,945 11.6% 14.1%
'14 139,648 -321,325 12.7% 13.8%
YTD
Q2'15 0 -146,731 12.9% 13.4%
GTA EAST HISTORIC OFFICE MARKET TRENDS
0.0%
2.0%
4.0%
6.0%
8.0%
10.0%
12.0%
14.0%
16.0%
-1,000
-500
0
500
1,000
1,500
2,000
'00 '01 '02 '03 '04 '05 '06 '07 '08 '09 '10 '11 '12 '13 '14 YTD
Q2'15
TotalAvailable/VacantRate(%)
SquareFeet(000's)
Toronto East
Historic Office Market Trends - All Classes
New Supply Change In Occupied Area Vacancy Rate Availability Rate
M A R K E T F A C T S
T O R O N T O N O R T H A N D E A S T M A R K E T S U M M A R Y