
Empfohlen
Empfohlen
Weitere ähnliche Inhalte
Was ist angesagt?
Was ist angesagt? (12)
Ähnlich wie GRS Poster
Ähnlich wie GRS Poster (20)
GRS Poster
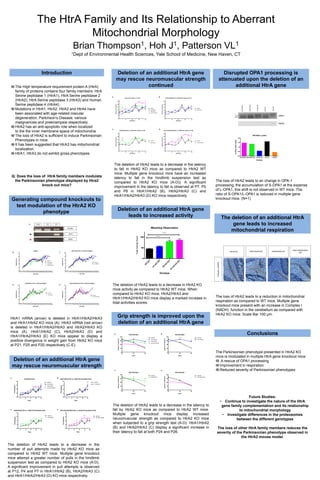
- 1. Introduction The High temperature requirement protein A (HtrA) family of proteins contains four family members: HtrA Serine peptidase 1 (HtrA1), HtrA Serine peptidase 2 (HtrA2), HtrA Serine peptidase 3 (HtrA3) and Human Serine peptidase 4 (HtrA4). Mutations in HtrA1, HtrA2, HtrA3 and HtrA4 have been associated with age-related macular degeneration, Parkinson’s Disease, various malignancies and preeclampsia respectively. HtrA2 has an anti-apoptotic role when localized to the the inner membrane space of mitochondria The loss of HtrA2 is sufficient to induce Parkinsonian Phenotypes in mice. It has been suggested that HtrA3 has mitochondrial localization. HtrA1, HtrA3 do not exhibit gross phenotypes. Q: Does the loss of HtrA family members modulate the Parkinsonian phenotype displayed by Htra2 knock out mice? Generating compound knockouts to test modulation of the HtrA2 KO phenotype HtrA1 mRNA (arrow) is deleted in HtrA1/HtrA2/HtrA3 and HtrA1/HtrA2 KO mice (A). HtrA3 mRNA (red arrow) is deleted in HtrA1/HtrA2/HtrA3 and HtrA2/HtrA3 KO mice (A). HtrA1/HtrA2 (C), HtrA2/HtrA3 (D) and HtrA1/HtrA2/HtrA3 (E) KO mice appear to display a positive divergence in weight gain from HtrA2 KO mice at P21, P25 and P20 respectively (C-E). The HtrA Family and Its Relationship to Aberrant Mitochondrial Morphology Brian Thompson1, Hoh J1, Patterson VL1 1Dept of Environmental Health Sciences, Yale School of Medicine, New Haven, CT Conclusions Future Studies: • Continue to investigate the nature of the HtrA gene family complementation and its relationship to mitochondrial morphology • Investigate differences in the proteosomes between the different genotypes The loss of other HtrA family members reduces the severity of the Parkinsonian phenotype observed in the HtrA2 mouse model. The Parkinsonian phenotype presented in HtrA2 KO mice is modulated in multiple HtrA gene knockout mice: A rescue of OPA1 processing Improvement in respiration Reduced severity of Parkinsonian phenotypes Deletion of an additional HtrA gene may rescue neuromuscular strength The deletion of an additional HtrA gene leads to increased mitochondrial respiration The loss of HtrA2 leads to a reduction in mitochondrial respiration as compared to WT mice. Multiple gene knockout mice present with an increase in Complex I (NADH) function in the cerebellum as compared with HtrA2 KO mice. Scale Bar 100 μm. Disrupted OPA1 processing is attenuated upon the deletion of an additional HtrA gene The loss of HtrA2 leads to an change in OPA-1 processing, the accumulation of S-OPA1 at the expense of L-OPA1, this shift is not observed in WT mice. The ratio of S-OPA1/L-OPA1 is reduced in multiple gene knockout mice. (N=1) Deletion of an additional HtrA gene may rescue neuromuscular strength continued Deletion of an additional HtrA gene leads to increased activity The deletion of HtrA2 leads to a decrease in HtrA2 KO mice activity as compared to HtrA2 WT mice. When compared to HtrA2 KO mice, HtrA2/HtrA3 and HtrA1/HtrA2/HtrA3 KO mice display a marked increase in total activities scores. Grip strength is improved upon the deletion of an additional HtrA gene The deletion of HtrA2 leads to a decrease in the latency to fall by HtrA2 KO mice as compared to HtrA2 WT mice. Multiple gene knockout mice display increased neuromuscular strength as compared to HtrA2 KO mice when subjected to a grip strength test (A-D). HtrA1/HtrA2 (B) and HtrA2/HtrA3 (C) display a significant increase in their latency to fall at both P24 and P26. HtrA1 Β-Actin 1/2/3 2/31/2 HtrA3 HtrA2 KO HtrA1/HtrA2 KO HtrA2/HtrA3 KO HtrA1/HtrA2/HtrA3 KO ComplexI(NADH) OPA1 HtrA2 B D nWT nKO P25 brain PHB2 OPA1 L S nWT nKO 0 1 2 3 S-OPA1/L-OPA1ratio ** C WT KO 0 1 2 3 S-OPA1/L-OPA1ratio *** WT KO P9 brain PHB2 L S OPA1 Brain Heart Kidney Liver Muscle Retina 0 1 2 3 4 5 S-OPA1/L-OPA1ratio HTRA2 WT HTRA2 KO *** VDAC MFN2 HTRA2 WT KO brain WT KO WT KO WT KO heart kidney liver WT KO WT KO muscle retina OPA1 L S P25 HTRA2 KO A KOWT KOWT P33 brain β-actin LC3β P62 I II B D nWT nKO P25 brain PHB2 OPA1 L S nWT nKO 0 1 2 3 S-OPA1/L-OPA1ratio ** C WT KO 0 1 2 3 S-OPA1/L-OPA1ratio *** WT KO P9 brain PHB2 L S OPA1 Brain Heart Kidney Liver Muscle Retina 0 1 2 3 4 5 S-OPA1/L-OPA1ratio HTRA2 WT HTRA2 KO *** VDAC MFN2 HTRA2 WT KO brain WT KO WT KO WT KO heart kidney liver WT KO WT KO muscle retina OPA1 L S P25 HTRA2 KO A KOWT KOWT P33 brain β-actin LC3β P62 I II H2WT H1/H2KO H2KO H2/H3KO H1/H2/H3 0 2 4 6 8 10 12 14 16 18 20 22 24 26 28 30 32 34 36 38 40 0 2 4 6 8 10 Age (Days) Weight(Grams) Weight H2 KO H1-H2 KO H2-H3 KO H1-H2-H3 KO 0 2 4 6 8 10 12 14 16 18 20 22 24 26 28 30 32 34 36 38 40 0 2 4 6 8 10 Age (Days) Weight(Grams) HtrA2/HtrA3 KO vs. HtrA2 KO Weight H2 KO H2-H3 KO **** 0 2 4 6 8 10 12 14 16 18 20 22 24 26 28 30 32 34 36 38 40 0 2 4 6 8 10 Age (Days) Weight(Grams) HtrA1/HtrA2 KO vs. HtrA2 KO Weight H2 KO H1-H2 KO **** 0 2 4 6 8 10 12 14 16 18 20 22 24 26 28 30 32 34 36 38 40 0 2 4 6 8 10 Age (Days) Weight(Grams) HtrA1/HtrA2/HtrA3 KO vs. HtrA2 KO Weight H2 KO H1-H2-H3 KO **** B D C E H 2 K O H 1-H 2 K O H 2-H 3 K O H 1-H 2-H 3 K O 0 50 100 Genotype TotalActivityScore Weanling Observation **** **** 4 6 8 10 12 0 2 4 6 8 Days PullAttempts Hindlimb Pulls H2 KO H1-H2 KO H2-H3 KO H1-H2-H3 KO 4 6 8 10 12 0 2 4 6 8 Days PullAttempts HtrA2/HtrA3 KO vs. HtrA2 KO Hindlimb Pulls H2 KO H2-H3 KO **** * 4 6 8 10 12 0 2 4 6 8 Days PullAttempts HtrA1/HtrA2 KO vs. HtrA2 KO Hindlimb Pulls H2 KO H1-H2 KO **** 4 6 8 10 12 0 2 4 6 8 Days PullAttempts HtrA1/HtrA2/HtrA3 KO vs. HtrA2 KO Hindlimb Pulls H2 KO H1-H2-H3 KO ** **** A B C D 6 8 10 12 0 4 8 12 16 20 24 Age (Days) LatencyToFall(sec) Hind Limb Latency To Fall H2 KO H1-H2 KO H2-H3 KO H1-H2-H3 KO 6 8 10 12 0 4 8 12 16 20 24 Age (Days) LatencyToFall(sec) HtrA2/HtrA3 KO vs. HtrA2 KO Latency to Fall H2 KO H2-H3 KO **** 6 8 10 12 0 4 8 12 16 20 24 Age (Days) LatencyToFall(sec) HtrA1/HtrA2 KO vs. HtrA2 KO Latency to Fall H2 KO H1-H2 KO ** 6 8 10 12 0 4 8 12 16 20 24 Age (Days) LatencyToFall(sec) HtrA1/HtrA2/HtrA3 KO vs. HtrA2 KO Latency to Fall H2 KO H1-H2-H3 KO *** A C B D 22 24 26 0 10 20 30 40 Days LatencyToFall(sec) Grip Strength H2 KO H1-H2 KO H2-H3 KO H1-H2-H3 KO 22 24 26 0 10 20 30 40 Days LatencyToFall(sec) Grip Strength H2 KO H2-H3 KO **** ** 22 24 26 0 10 20 30 40 Days LatencyToFall(sec) Grip Strength H2 KO H1-H2 KO **** **** 22 24 26 0 10 20 30 40 Days LatencyToFall(sec) Grip Strength H2 KO H1-H2-H3 KO A C B D The deletion of HtrA2 leads to a decrease in the number of pull attempts made by HtrA2 KO mice as compared to HtrA2 WT mice. Multiple gene knockout mice attempt a greater number of pulls in the hindlimb suspension test as compared to HtrA2 KO mice (A-D). A significant improvement in pull attempts is observed at P12, P4 and P7 in HtrA1/HtrA2 (B), HtrA2/HtrA3 (C) and HtrA1/HtrA2/HtrA3 (D) KO mice respectively. The deletion of HtrA2 leads to a decrease in the latency to fall in HtrA2 KO mice as compared to HtrA2 WT mice. Multiple gene knockout mice have an increased latency to fall in the hindlimb suspension test as compared to HtrA2 KO mice (A-D)). A significant improvement in the latency to fall is observed at P7, P5 and P6 in HtrA1/HtrA2 (B), HtrA2/HtrA3 (C) and HtrA1/HtrA2/HtrA3 (D) KO mice respectively. 4 6 8 10 12 0 2 4 6 8 Days PullAttempts Hindlimb Pulls H2 KO H1-H2 KO H2-H3 KO H1-H2-H3 KO 4 6 8 10 12 0 2 4 6 8 Days PullAttempts HtrA2/HtrA3 KO vs. HtrA2 KO Hindlimb Pulls H2 KO H2-H3 KO **** * 4 6 8 10 12 0 2 4 6 8 Days PullAttempts HtrA1/HtrA2 KO vs. HtrA2 KO Hindlimb Pulls H2 KO H1-H2 KO **** 4 6 8 10 12 0 2 4 6 8 Days PullAttempts HtrA1/HtrA2/HtrA3 KO vs. HtrA2 KO Hindlimb Pulls H2 KO H1-H2-H3 KO ** **** A B C D H1/H2/H3 KO H2/H3 KO H1/H2 KO H2 KO H2 WT 0.0 0.5 1.0 1.5 2.0 Genotype S-OPA/L-OPA1Ratio P25 Brain Lysate
- 2. Structure and size of mitochondria are disrupted in KO brain Electron microscopy of the cerebellum shows distorted mitochondrial structure in HtrA2 KO brain at P20 and more severely at P32. Mitochondria are swollen and internal membrane structure is disrupted. Scale bar: 1 μm. Normal Normal-vesicular Vesicular Vesicular-swollen Swollen Structure Size Swollen mitochondria are only present in the absence of HtrA2 and the incidence increases with age. Size is increased in KO brain, consistent with mitochondrial swelling. Scale bar: 500 nm. P20 P32 WTKO Brian Thompson: Post Graduate Fellow School of Public Health Department of Environmental Health Sciences Contact Information: Brian.thompson@yale.edu Advisors: Dr. Josephine Hoh Dr. Victoria Patterson