1. Introduction
Since the earliest emergence of the disciplines of molecular biology and genetics, the Phytophthora genus has been studied and used, as a group, to model many important genetic patterns and discoveries. Organisms of this genus are known as Oomycetes, a fungus- like class composed of several major genera, within the kingdom Chromalveolata (Tyler 2006). Despite sharing many features with fungi, such as the production of spores and the growth and asexual reproduction via mycelia, to name a few, oomycetes are thought to be more closely related to plants due to the similarities in the cell wall structure of the two groups (Latijnhouwers 2003). In addition, several oomycete genera commonly act as plant pathogens, causing infection, degradation of the plant, and often death. Host plants differ between the genera, with the Phytophthora genus infecting a number of economically significant crops. One of the most important of these, soybean, is infected by P. sojae, causing soybean root rot. The amount of money lost due to soybean root rot outbreaks every year is in the millions, and this combined with the enzymatic diversity of the pathogen make it an organism worthy of study (Tyler 2007).
One important enzyme needed for the growth of the species is chitin synthase. While the cell walls of the species are predominantly made up of cellulose, chitin is still present in some amounts in the cell membrane and small amounts in the cell wall (Kamoun 2003). Based on prior research done by Lauren Hinkel, Class of 2014, the goal for this summer was to provide replicate research, using similar materials and methods, in order to produce enough results for eventual statistical analysis. This required the purposeful infection of soybean plants with P. sojae (including the harvesting of leaves at differing timepoints), the extraction of RNA from the plant samples, and Reverse Transcription (RT) coupled with Polymerase Chain Reactions (PCR) to obtain useable cDNAs for the chitin synthase genes only.
Figures
Results and Discussion
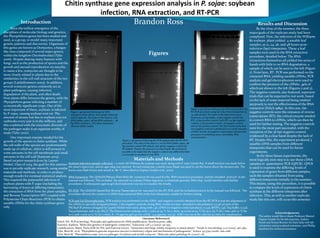
By the close of the summer, the three major goals of the replicate study had been completed. First, the infection of the Williams 82 soybean plant yielded 4 useable leaf samples, at 12, 24, 36, and 48 hours-post- infection (hpi) timepoints. These 4 leaf samples were used in the RNA extraction procedure, detailed below. The RNA extractions themselves all yielded the series of bands with little to no RNA degradation, a sample of which can be seen to the left (Figure 1). From here, RT- PCR was performed on the extracted RNA, yielding useable cDNAs. PCR analysis and gel electrophoresis were used to confirm the presence of the cDNAs , gels of which are shown to the left (Figures 2 and 3). The negative controls, also featured, represent trials that can be expected to not work, based on the lack of some material being omitted purposely to test the effectiveness of the RNA extraction (Erlich 1989). In this case, the negative controls were the omission of reverse transcriptase (RT), the critical enzyme needed to convert RNA to cDNAs, which can then be used for further testing. The negative controls were for the most part successful, with the exception of the 36 hpi negative control, evidenced by a clear band despite the lack of RT. Despite this, the experiment produced 3 useable cDNA samples from different timepoints that can be used for future experiments.
As for these future experiments, the most logically next step is to use these cDNA samples in quantitative PCR (QPCR). QPCR is used to examine the differing levels of expression of genes from different samples, such the samples obtained from using different timepoints initially in the summer. This means, using this procedure, it is possible to compare the levels of expression of chitin synthase at the different timepoints after infection. This, as well as another replicate study like this one, will occur this semester.
Figure 1: gel picture following the RNA extraction of the 48 hpi leaf sample infeected with P. spjae R5. The order of the lanes is: 1 kb DNA ladder, space, 48 hpi RNA replicate 1, 48 hpi RNA replicate 2. The other timepoints showed similar results.
Figure 2: gel picture following the PCR analysis after the RT-PCR procedure. The order of the lanes is: 100 bp DNA ladder, space, 48 hpi positive control (RT added), and 48 hpi negative control (no RT added). Despite the presence of a faint band, the conclusion was able to be made that the negative control was sufficiently faint to conclude it consisted of only RNA
Figure 3: gel picture following the PCR analysis after the RT-PCR procedure using the other three timepoints (12, 24, and 36 hpi). The order of the lanes from top to bottom is: 100 bp ladder, 12 hpi negative control (no RT), 12 hpi positive control (with RT), 24 hpi negative control, 24 hpi positive control, 36 negative control, and 36 hpi positive control. The faint bands in the first two negative controls is attributed on to small amounts of RNA, but the 36 negative control band indicates the prescence of something more, most likely DNA contamination
Materials and Methods
Soybean infection/sample collection: ~4 week old Williams 82 soybean was used, along with P. sojae (strain R5). A small incision was made below the plant’s hypocotyl, and an agar plug was inserted. At each timepoint, a sterile razor blade was used to cut the leaves above the incision site. The leaves were flash frozen and stored at -80 °C (described in Ospina-Giraldo et al., 2007).
RNA Extraction: The QIAGEN RNeasy Plant Mini Kit extration kit was used for the RNA extraction procedure, and the included protocol in the manual was followed. This included the optional on-column DNase digestion, to eliminate genomic DNA that would interfere with further procedures. A subsequent agarose gel electrophoresis was run to visualize the results.
RT-PCR: The QIAGEN QuantiTect Reverse Transcription kit was used for the RT-PCR, and the included protocol in the manual was followed. The procedure allowed the creation of cDNA from extracted RNA at the four timepoints, usable for further testing
PCR and Gel Electrophoresis: PCR analysis was performed on the cDNA and negative controls obtained from the RT-PCR to test the alignment of the cDNAs to specially designed primers ( the negative controls, being RNA, would not have annealed to the primers). 0.5 μL of each of the PSCS15F/R primers designed by Lauren Hinkel were used, along with 1 μL cDNA (or negative control product), 0.5 μL dNTPs, 5 μL Taq buffer, 0.5 μL Taq polymerase, and 12 μL dH2O. The thermocycler settings were: 1 cylce at 94 °C for 5 mins, 35 cycles at 94 °C for 30 s, 63 °C for 1 min, and 72 °C for 20 s, and 1 cycle at 72 °C for 5 mins. A 1 % agarose gel (40 mL 1xTAE, .4 g agaorse, 500 μL EtBr) was run at 80 volts for 40 mins for visualization.
Literature Referenced
Erlich, HA. PCR technology: Principles and applications for DNA amplification. Stockton press, 1989.
Kamoun, Sophien. "Molecular genetics of pathogenic oomycetes." Eukaryotic cell 2.2 (2003): 191-199.
Latijnhouwers, Maita, Pierre JGM De Wit, and Francine Govers. "Oomycetes and fungi: similar weaponry to attack plants." Trends in microbiology 11.10 (2003): 462-469.
Tyler, Brett M., et al. "Phytophthora genome sequences uncover evolutionary origins and mechanisms of pathogenesis." Science 313.5791 (2006): 1261-1266.
Tyler, Brett M. "Phytophthora sojae: root rot pathogen of soybean and model oomycete." Molecular plant pathology 8.1 (2007): 1-8.
Acknowledgements
The author would like to thank Professor Manuel Ospina-Giraldo for his lab expertise, Andrea Parish and Emma Brenner for their help with lab orientation and procedural assistance, and Phillip Auerbach for technical assistance
Brandon Ross