
Empfohlen
Empfohlen
Weitere ähnliche Inhalte
Was ist angesagt?
Was ist angesagt? (20)
Andere mochten auch
Andere mochten auch (18)
Ähnlich wie St. Louis Employment Update
Ähnlich wie St. Louis Employment Update (20)
Mehr von Blaise Tomazic
Mehr von Blaise Tomazic (20)
Kürzlich hochgeladen
Kürzlich hochgeladen (20)
St. Louis Employment Update
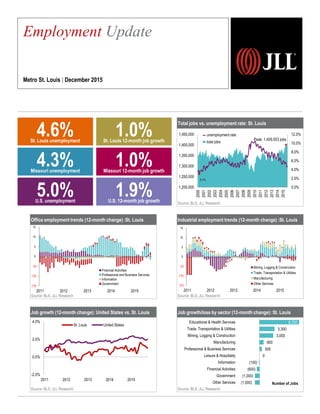
- 1. Total jobs vs. unemployment rate: St. Louis Source: BLS, JLL Research Industrial employment trends (12-month change) :St. Louis Source: BLS, JLL Research Job growth/loss by sector (12-month change): St. Louis Source: BLS, JLL Research Employment Update Metro St. Louis | December 2015 0.0% 2.0% 4.0% 6.0% 8.0% 10.0% 12.0% 1,200,000 1,250,000 1,300,000 1,350,000 1,400,000 1,450,000 2000 2001 2002 2003 2004 2005 2006 2007 2008 2009 2010 2011 2012 2013 2014 2015 Peak: 1,409,553 jobs 3.1% unemployment rate total jobs (1,000) (1,000) (600) (100) 0 500 900 3,000 3,300 8,700 Other Services Government Financial Activities Information Leisure & Hospitality Professional & Business Services Manufacturing Mining, Logging & Construction Trade, Transportation & Utilities Educational & Health Services Number of Jobs Office employment trends (12-month change) :St. Louis Source: BLS, JLL Research Job growth (12-month change): United States vs. St. Louis Source: BLS, JLL Research -2.0% 0.0% 2.0% 4.0% 2011 2012 2013 2014 2015 St. Louis United States 5.0%U.S. unemployment 1.9%U.S. 12-month job growth 4.6%St. Louis unemployment 1.0%St. Louis 12-month job growth 4.3%Missouri unemployment 1.0%Missouri 12-month job growth (15) (10) (5) 0 5 10 15 2011 2012 2013 2014 2015 Financial Activities Professional and Business Services Information Government (15) (10) (5) 0 5 10 15 2011 2012 2013 2014 2015 Mining, Logging & Construction Trade, Transportation & Utilities Manufacturing Other Services
- 2. Industry employment stratification St. Louis Source: JLL Research ©2015 Jones Lang LaSalle IP, Inc. All rights reserved.For more information, contact: Blaise Tomazic | blaise.tomazic@am.jll.com Employment statistics St. Louis Oct-13 Oct-14 Oct-15 Total Non-farm Employment 1,315,100 0.8% 1,315,100 1.3% 1,345,400 1.0% Unemployment Rate 6.6% 5.2% 4.6% St. Louis Supersectors Oct-13 Oct-14 Oct-15 Mining, Logging & Construction 60,600 2.9% 61,000 0.7% 64,000 4.9% Manufacturing 110,900 0.5% 113,100 2.0% 114,000 0.8% Trade, Transportation, & Utilities 247,300 0.7% 251,900 1.9% 255,200 1.3% Information 28,800 -1.7% 28,900 0.3% 28,800 -0.3% Financial Activities 85,700 0.0% 86,000 0.4% 85,400 -0.7% Professional & Business Services 201,200 4.8% 204,900 1.8% 205,400 0.2% Educational & Health Services 229,200 -2.0% 231,400 1.0% 240,100 3.8% Leisure & Hospitality 141,400 1.7% 146,100 3.3% 146,100 0.0% Other Services 45,000 -0.7% 45,600 1.3% 44,600 -2.2% Government 165,000 0.2% 162,800 -1.3% 161,800 -0.6% 19% 18% 15% 12% 11% 9% 6% 5% 3% 2% Trade, transportation and Utilities Educational and Health Services Professional and Business Services Government Leisure and Hospitality Manufacturing Financial Activities Mining, Logging and construction Other Services Information News on the street St. Louis businesses expanding, contracting, etc. AEP River Operations | Shipping: contracting In 2016, the 100 employees of AEP River Operations will vacate 41,000 square feet at 16150 Main Circle Drive in Chesterfield and move to Jefferson, Indiana. AEP, which controls 10.8 percent of the inland water transportation market, was recently acquired for $550 million by Ohio-based American Commercial Lines, LLC (ACL), which controls 7.4 percent of the market. ACL’s parent company, Platinum Equity, has its headquarters in Indiana. Gori Julian & Associates | Law firm: expanding Edwardsville-based law firm Gori Julian & Associates is spending $1 million to renovate 1133 Pine Street in downtown St. Louis for a new law office. The renovated building will be multiuse with apartments and retail space. Five lawyers and staff in the new office represent plaintiffs in asbestos exposure cases, products liability, and personal injury cases. Mallinckrodt | Technology: contracting Mallinckrodt PLC (NYSE: MNK) sold its global contrast media and delivery systems (CMDS) business to Guerbet for $270 million. The sale affects 75 St. Louis employees, who will relocate within the metro area to a Guerbet office. Mallinckrodt’s North American headquarters is located in North County at 675 James S. McDonnell Boulevard. Stifel Financial Corp. | Finance: expanding Stifel Financial Corp. has agreed to buy Connecticut-based financial advisory firm, Eaton Partners, LLC. Eaton has 60 employees in six global offices and has raised over $68 billion through 4,000 relationships with institutional investors. Barclays PLC’s U.S. wealth unit was also acquired by Stifel recently. Stifel, Nicolaus & Co. brokerage and other Stifel businesses occupy over half of One Financial Plaza at 501 North Broadway in downtown St. Louis. U.S. Steel | Steel: contracting For the second time this year, Pittsburgh-based U.S. Steel is idling steelmaking and finishing operations at Granite City Works in Granite City, Illinois. In response to decreased demand for steel, the plant shut down for a period in March 2015 but later resumed operations. U.S. Steel’s plants in Indiana, Michigan and Pennsylvania will continue production. Vectra | Technology: expanding Cleveland-based specialty chemicals firm, OM Group, has changed its name to Vectra and is relocating headquarters to St. Louis. Vectra currently employs 30 people in Cleveland and leased approximately 11,000 square feet in Clayton at 120 S. Central Avenue. The move and name change follow the company’s acquisition in October by Apollo Funds.