2. 1. GENERAL CONDITIONS FOR
PLANE FAILURE
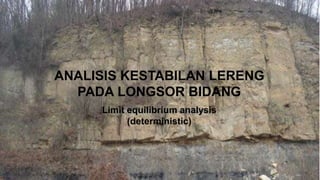
Figure 7.1 shows a typical plane failure in a
rock slope where a block of rock has slid on
a single plane dipping out of the face.
Figure 7.1 Plane failure on smooth, persistent
bedding planes in shale (Interstate 40, near
Newport, Tennessee).
Plane failure
3. In order for this type of failure to occur,
the following geometrical conditions
must be satisfied (Figure 7.2):
1. The plane on which sliding occurs must strike
parallel or nearly parallel (within approximately
±20°) to the slope face.
2. The sliding plane must ‘daylight’ in the slope face,
which means that the dip of the plane must be less
than the dip of the slope face, that is, yp < yf.
3. The dip of the sliding plane must be greater than
the angle of friction of this plane, that is, yp > ϕ.
4. The upper end of the sliding surface either
intersects the upper slope, or terminates in a
tension crack.
5. Release surfaces that provide negligible resistance
to sliding must be present in the rock mass to
define the lateral boundaries of the slide.
Alternatively, failure can occur on a sliding plane
passing through the convex ‘nose’ of a slope.
Figure 7.2 Geometry of slope exhibiting plane
failure: (a) cross-section showing planes
forming a plane failure; (b) unit thickness slide
used in stability analysis; (c) release surfaces
at the ends of plane failure.
4. 2. PLANE FAILURE ANALYSIS
The slope geometries and
ground water conditions
considered in this analysis are
defined in Figure 7.3, which
shows two geometries as
follows
Figure 7.3 Geometries of plane slope failure: (a) tension
crack in the upper slope; (b) tension crack in the face.
1. Slopes having a tension crack
in the upper surface
2. Slopes with a tension crack in
the face
5. When the upper surface is horizontal (ys = 0), the transition from one condition to another
occurs when the tension crack coincides with the slope crest, that is, when
z
H
yf
yp
(H-z)/tan yp
H cot yf
where z is the depth of the tension crack, H is
the slope height, yf is the slope face angle
and yp is the dip of the sliding plane.
(7.1)
=
6. The following assumptions are made in plane failure analysis:
1. Both sliding surface and tension crack strike parallel to the slope.
2. The tension crack is vertical and is filled with water to a depth zW.
3. Water enters the sliding surface along the base of the tension crack
and seeps along the sliding surface, escaping at atmospheric pressure
where the sliding surface daylights in the slope face. The pressure
distributions induced by the presence of water in the tension crack and
along the sliding surface are illustrated in Figure 7.3.
4. The forces W (the weight of the sliding block), U (uplift force due to
water pressure on the sliding surface) and V (force due to water
pressure in the tension crack) all act through the centroid of the sliding
mass. In other words, it is assumed that the forces produce no
moments that would tend to cause rotation of the block, and hence
failure is by sliding only. While this assumption may not be strictly true
for actual slopes, the errors introduced by ignoring moments are small
enough to neglect. However, in steep slopes with steeply dipping
discontinuities, the possibility of toppling failure should be kept in
mind (see Chapter 10).
7. 5. The shear strength t of the sliding surface is
defined by cohesion c and friction angle ϕ that are
related by the equation (t = c + σ tan ϕ) – as
discussed in Chapter 5. In the case of a rough
surface or a rock mass having a curvilinear shear
strength envelope, the apparent cohesion and
apparent friction angle are defined by a tangent that
takes into account the normal stress acting on the
sliding surface. The normal stress σ acting on a
sliding surface can be determined from the curves
given in Figure 7.4.
6. It is assumed that release surfaces are present so
that no resistance to sliding is generated at the
lateral boundaries of the failing rock mass.
Figure 7.4 Normal stress acting on
slide plane in a rock slope.
8. 7. In analysing two-dimensional slope problems, it is usual to
consider a slice of unit thickness taken at right angles to the slope
face. This means that on a vertical section through the slope, the
area of the sliding surface can be represented by the length of the
surface, and the volume of the sliding block is represented by the
cross-section area of the block (Figure 7.2b).
The factor of safety for plane failure is calculated by resolving all forces acting on the slope into
components parallel and normal to the sliding plane. The vector sum of the shear forces ΣS acting
down the plane is termed the driving force. The product of the total normal forces ΣN and the
tangent of the friction angle ϕ plus the cohesive force is termed the resisting force (see Section
1.4.2). The factor of safety FS of the sliding block is the ratio of the resisting forces to the driving
forces, and is calculated as follows:
(7.2)
(7.3)
where c is the cohesion and A is the area of the sliding plane.
9. Based on the concept illustrated in Equations 7.2 and 7.3, the
factor of safety for the slope configurations shown in Figure 7.3 is
given by
(7.4)
where A is given by
(7.5)
The slope height is H, the tension crack depth is z and it is located at a
distance b behind the slope crest. The dip of the slope above the crest
is ys.
When the depth of the water in the tension crack is zw, the forces
acting on the sliding plane U, and in the tension crack V, are given by
(7.6)
(7.7)
where gw is the unit weight of water.
10. The weights of the sliding block W for the two geometries shown in Figure
7.3 are given by Equations 7.8 and 7.9.
For the tension crack in the inclined upper slope surface (Figure 7.3a)
(7.8)
and, for the tension crack in the slope face (Figure 7.3b)
(7.9)
where gr is the unit weight of the rock.
Figure 7.3 and Equations 7.4 to 7.9 illustrate that the geometry of a
plane failure and the ground water conditions can be completely
defined by four dimensions (H, b, z and zw) and by three angles (yf,
yp and ys). These simple models, together with the ground water,
rock bolting and seismic ground motion concepts discussed in the
following sections allow stability calculations to be carried out for
a wide variety of conditions.
11. A = (H + b tanψs − z) cosecψp
U = 0.5 gwzw(H + b tan ψs − z)cosecψp
V = 0.5 gwzw2
W = gr [(1 − cot ψf tan ψp) (bH + ½ H2 cot ψf )+ ½ b2(tan ψs − tan ψp)]
12. ( bH + ½ H2 cot yf + ½ b2 tan ys ) – ( b.H cot yf tan yp + ½ H2 (cot yf)2 tan yp + ½ b2 tan yp)
( VOLUME/m ) =
b
H
ψs
ψp
ψf
H cot yf
b tan ys
H cot yf tan yp
b tan yp
ψp
A = (H + b tanψs − z) cosecψp
z
13. W sin yp + V cos yp = c.A + (W cos yp - U – V sin yp ) tan f
A = (H – z) cosec yp
U = (1/2) gw.zw (H – z) cosec yp
V = (1/2) gw.z2
w
W = (1/2) gr H2 ((1 – (z/H)2) cot yp - cot yf )
17. 2.1 Influence of ground water on stability
The following are four possible ground water conditions that may occur in rock
slopes, and the equations that can be used to calculate the water forces U and
V. In these examples, the pressure distributions in the tension crack and along
the sliding plane are idealised and judgement is required to determine the most
suitable condition for any particular slope.
1. Ground water level is above the base of tension crack so water pressures
act both in the tension crack and on the sliding plane. If the water discharges to
the atmosphere where the sliding plane daylights on the slope face, then it is
assumed that the pressure decreases linearly from the base of the tension
crack to zero at the face. This condition is illustrated in Figure 7.3 and the
method of calculating forces U and V is given by Equations 7.6 and 7.7,
respectively.
(7.6)
(7.7)
18. 2. Water pressure may develop in the tension crack only in conditions,
for example, where a heavy rainstorm after a long dry spell results in
surface water flowing directly into the crack. If the remainder of the rock
mass is relatively impermeable, or the sliding surface contains a low-
conductivity clay filling, then the uplift force U could also be zero or
nearly zero. In either case, the factor of safety of the slope for these
transient conditions is given by Equation 7.4 with U = 0 and V given by
Equation 7.7.
(7.4)
(7.7)
19. 3. Ground water discharge at the face may be blocked by freezing (Figure
7.5a). Where the frost penetrates only a few metres behind the face,
water pressures can build up in the slope and the uplift pressure U can
exceed that shown in Figure 7.3. For the idealised rectangular pressure
distribution shown in Figure 7.5a, the uplift force U is given by
U = A.p (7.10)
where A is the area of the sliding plane given by Equation 7.5 and p is the
pressure in the plane (and at the base of the tension crack) given by
p = gw . zw (7.11)
Figure 7.5: (a) uniform pressure on
slide plane for drainage blocked at
toe
The condition shown in Figure 7.5a may only occur rarely, but could
result in a low factor of safety; a system of horizontal drains may help to
limit the water pressure in the slope.
20. 4. Ground water level in the slope is below the base of the tension crack so water pressure acts
only on the sliding plane (Figure 7.5b). If the water discharges to the atmosphere where the
sliding plane daylights on the face, then the water pressure can be approximated by a triangular
distribution, for which the uplift force U is given by
(7.12)
where hw is the estimated depth of water at the
mid-point of the saturated portion of the sliding
plane.
Figure 7.5: (b) triangular pressure on slide plane for water
table below the base of tension crack.
21. 2.2 Critical tension crack depth and location
In the analysis it has been assumed that the position of the tension crack is known from its visible trace on
the upper surface or on the face of the slope, and that its depth can be established by constructing an
accurate cross-section of the slope. However, the tension crack position may be unknown due, for
example, to the presence of soil above the slope crest, or an assumed location may be required for
design. Under these circumstances, it becomes necessary to consider the most probable position of a
tension crack.
When the slope is dry or nearly dry (zw/z = 0), Equation 7.4 for the factor of safety can be modified as
follows:
(7.4)
(7.13)
22. The critical tension crack depth zc for a dry slope can be found by minimising the right-hand side
of Equation 7.13 with respect to z/H. This gives the critical tension crack depth as
(7.14)
and the corresponding position of the critical tension crack bc behind the crest is
(7.15)
Critical tension crack depths and locations for a range of dimensions for dry slopes are plotted in
Figure 7.6a and b. However, if the tension crack forms during heavy rain or if it is located on a pre-
existing geological feature such as a vertical joint, Equations 7.14 and 7.15 no longer apply.
23. Figure 7.6 Critical tension crack locations for a dry slope:
(a) critical tension crack depth relative to crest of cut;
(b) critical tension crack location behind crest of cut.
24. 2.3 Tension crack as an indicator of instability
Anyone who has examined excavated rock slopes cannot have failed to notice the occasional tension cracks
behind the crest (Figure 7.7). Some of these cracks have been visible for tens of years and, in many cases, do
not appear to have had any adverse influence on the stability of the slope. It is interesting, therefore, to consider
how such cracks are formed and whether they can give any indication of slope instability.
In a series of very detailed model studies on the failure of slopes in jointed rocks, Barton (1971) found that the
tension crack resulted from small shear movements within the rock mass. Although these individual movements
were very small, their cumulative effect was significant displacement of the slope surfaces – sufficient to cause
separation of vertical joints behind the slope crest and to form ‘tension’ cracks. The fact that the tension crack is
caused by shear movements in the slope is important because it suggests that, when a tension crack becomes
visible in the surface of a slope, it must be assumed that shear failure has initiated within the rock mass.
It is difficult to quantify the significance tension cracks since their formation is only the start of a complex
progressive failure process within the rock mass; such failure mechanisms can be studied with numerical models
as discussed in Chapter 12. It is probable that, in some cases, the improved drainage resulting from dilation of
the rock structure, combined with the interlocking of individual blocks within the rock mass, could result in an
increase in stability. However, where the failure surface comprises a single discontinuity surface such as a
bedding plane daylighting in the slope face, initial movement could be followed by a very rapid decrease in
stability because a small amount of movement could result in a reduction in the shear strength from the peak to
residual value.
In summary, the presence of a tension crack should be taken as an indication of potential instability and that, in
the case of an important slope, this should signal the need for a detailed investigation of stability.
25. Figure 7.7 A tension crack behind a sliding
rock mass in which significant horizontal
displacement has occurred (above: Kooteney
Lake, British Columbia).
26. 3.4 Critical slide plane inclination
When a persistent discontinuity such as a bedding plane exists in a slope and the inclination of this
discontinuity is such that it satisfies the conditions for plane failure defined in Figure 7.2, the stability of the
slope will be controlled by this feature. However, where no such feature exists and a sliding surface, if it
were to occur, would follow minor geological features and, in some places, pass through intact material,
how can the inclination of such a failure path be determined?
The first assumption that must be made concerns the shape of the slide surface. For a slope cut in weak
rock, or a soil slope with a face angle less than about 45°, the slide surface would have a circular shape.
The analysis of such a failure surface is discussed in Chapter 9.
In steep rock slopes, the slide surface is approximately planar and the inclination of such a plane can be
found by partial differentiation of Equation 7.4 with respect to ψp and by equating the resulting differential
to zero. For dry slopes, this gives the critical slide plane inclination ψpc as
(7.16)
The presence of water in the tension crack will cause the slide plane inclination to be reduced by as much
as 10%, but in view of the uncertainties associated with the inclination of this slide surface, the added
complication of including the influence of ground water is not considered justified. Consequently, Equation
7.16 can be used to obtain an estimate of the critical slide plane inclination in steep slopes that do not
contain through-going discontinuities.
27. 3.5 Analysis of failure on a rough plane
The stability analyses discussed so far in this section have used shear strength parameters that are
constant throughout the slope. However, as discussed in Section 5.2.4 on the shear strength of rough rock
surfaces, the friction angle that will be mobilised in the slope may depend on the normal stress acting on
the surface. That is, the friction angle will decrease with increasing normal stress as the asperities on the
surface are ground off, as defined by Equation 5.7. The significance of this relationship between friction
angle and normal stress is illustrated below.
Consider a plane slope failure with the geometry as shown in Figure 7.3a. For a dry slope (U = V = 0), the
normal stress σ acting on the sliding surface is given by
(7.17)
where W is the weight of the sliding block, ψp is the dip of the sliding surface and A is the area of this
surface. If the sliding plane contains no cohesive infilling so that the shear strength comprises only
friction, then the factor of safety can be calculated using Equations 1.2 to 1.6 for limit equilibrium analysis,
Equation 5.7 to define the shear strength of the rough surface, and Equation 7.17 to define the normal
stress on this surface. For these conditions, the factor of safety is given by
29. The application of these equations and the effect of a rough surface on the factor of safety can be illustrated
by the following example. Consider a slope with dimensions H = 30 m (98 ft), z = 15 m (49 ft), ψp = 30° and
ψf = 60°, in which the properties of the clean rough joint forming the sliding surface are ϕ = 25°, JRC = 15
and JCS = 5000 kPa (725 psi). From Figure 7.4, the normal stress ratio (σ/gr ⋅ H) is 0.36, and the value of σ
is 281 kPa (40.7 psi) if the rock density gr is 26 kN/m3 (165 lb/ft3). The value of the σ calculated from Figure
7.4 is the average normal stress acting on the sliding surface. However, the maximum stress acting on this
surface is below the crest of the slope where the depth of rock is 20 m (66 ft). The calculated maximum
stress is
Figure 4.9 Standard profiles defining joint
roughness coefficient (Barton, 1973).
30. Using Equation 5.7 and the roughness properties quoted in the previous paragraph, the shear strength
of the sliding surface and the corresponding factors of safety at the average and maximum normal
stresses can be calculated as
These results indicate that the effect of increasing normal stress level on the sliding surface is to
diminish the friction angle (due to the asperities being ground off) and that the corresponding decrease
in the factor of safety is 10%.
(7.17)
31. 3. REINFORCEMENT OF A SLOPE
When it has been established that a slope is potentially unstable, reinforcement may be an effective
method of improving the factor of safety. Methods of reinforcement include the installation of
tensioned anchors or fully grouted, untensioned dowels, or the construction of a toe buttress. Factors
that will influence the selection of an appropriate system for the site include the site geology, the
required capacity of the reinforcement force, drilling equipment availability and access, and time
required for construction. This section describes the design methods for slope reinforcement, while
Section 14.4.2 discusses construction aspects of slope reinforcement, and Section 16.2 discusses a
case study where a plane failure was reinforced with tensioned cables.
If rock anchors are to be installed, it is necessary to decide if they should be anchored at the distal end
and tensioned, or fully grouted and untensioned. Untensioned dowels are less costly to install, but
they will provide less reinforcement than tensioned anchors of the same dimensions, and their
capacity cannot be tested. One technical factor influencing the selection is that if a slope has relaxed
and loss of interlock has occurred on the sliding plane, then it is advisable to install tensioned anchors
to apply normal and shear forces on the sliding plane. However, if the reinforcement can be installed
before excavation takes place, then fully grouted dowels are effective in reinforcing the slope by
preventing relaxation on potential sliding surfaces (see Figure 14.5). Untensioned dowels can also be
used where the rock is randomly jointed and it is necessary to reinforce the overall slope, rather than a
particular plane.
32. 3.1 Reinforcement with tensioned anchors
A tensioned anchor installation involves drilling a hole extending below the sliding plane, installing a rock
bolt or strand cable that is bonded into the stable portion of the slope, and then tensioning the anchor
against the face (Figure 7.12). The tension in the anchor T modifies the normal and shear forces acting on
the sliding plane, and the factor of safety of the anchored slope is given by
Figure 7.12 Reinforcement of a slope with
tensioned rock bolt.
(7.25)
where T is the tension in the anchor inclined at an angle ψT
below the horizontal. Equation 7.25 shows that the normal
component of the anchor tension (T ⋅ sin (ψp + ψT)) is added
to the normal force acting on the sliding plane, which has the
effect of increasing the shear resistance to sliding. Also, the
shear component of the anchor tension (T ⋅ cos (ψp + ψT))
acting up the sliding plane is subtracted from the driving
forces, so the combined effect of the anchor force is to
improve the factor of safety (if (ψp + ψT) < 90°).
33. The factor of safety of a slope reinforced with tensioned rock anchors varies with the inclination
of the bolt (Figure 7.12). It can be shown that the most efficient angle (ψT(opt)) for a tensioned rock
bolt is when
(7.27)
This relationship shows that the optimum installation angle for a tensioned bolt is flatter than the
normal to the sliding plane. In practice, cement grouted anchors are installed at about 10–15°
below the horizontal to facilitate grouting, while resin grouted anchors may be installed in up-
holes. It should be noted that bolts installed at an angle steeper than the normal to the sliding
plane (i.e. (ψp + ψT) > 90°) can be detrimental to stability because the shear component of the
tension, acting down the plane, increases the magnitude of the displacing force.
Since the stability analysis of plane failures is carried out on a 1-m-thick slice of the slope, the
calculated value of T for a specified factor of safety has units kN/m. The procedure for designing a
bolting pattern using the calculated value of T is as follows. For example, if the tension in each bolt
is TB, and a pattern of bolts is installed with n bolts in each vertical row, then the total bolting force
in each vertical row is (TB ⋅ n). Since the required bolting force is T, then the horizontal spacing S
between each vertical row is given by
This design method is illustrated in the worked example at the end of this chapter.
(7.26)
34. EXAMPLE PROBLEM 7.1: PLANE FAILURE – ANALYSIS AND STABILISATION
Statement
A 12 m (40 ft) high-rock slope has been
excavated at a face angle of 60°. The rock in
which this cut has been made contains
persistent bedding planes that dip at an angle
of 35° into the excavation. The 4.35 m (14.3
ft) deep tension crack is 4 m (13.1 ft) behind
the crest, and is filled with water to a height
of 3 m (9.8 ft) above the sliding surface
(Figure 7.16). The strength parameters of the
sliding surface are as follows:
Figure 7.16 Plane failure geometry for Example
Problem 7.1.
Cohesion, c = 25 kPa (3.6 psi)
Friction angle, f = 37°
The unit weight of the rock is 26 kN/m3 (165 lb/ft3), and the unit weight of the water is 9.81 kN/m3 (62.4
lb/ft3).
Required
Assuming that a plane slope failure is the most likely type of instability, analyse the following
stability conditions.
35. Factor of safety calculations
1. Calculate the factor of safety of the slope for the conditions given in Figure 7.16.
2. Determine the factor of safety if the tension crack were completely filled with water due to
run-off collecting on the crest of the slope.
3. Determine the factor of safety if the slope was completely drained.
4. Determine the factor of safety if the cohesion were to be reduced to zero due to excessive
vibrations from nearby blasting operations, assuming that the slope was still completely
drained.
5. Determine whether the 4.35-m-deep tension crack is the critical depth (use Figure 7.6).
Slope reinforcement using rock bolts
1. It is proposed that the drained slope with zero cohesion be reinforced by installing tensioned
rock bolts anchored into sound rock beneath the sliding plane. If the rock bolts are installed
at right angles to the sliding plane, that is, ψT = 55°, and the total load on the anchors per
lineal metre of slope is 400 kN, calculate the factor of safety.
2. Calculate the factor of safety if the bolts are installed at a flatter angle so that the ψT is
decreased from 55° to 20°.
3. If the working load for each bolt is 240 kN, suggest a bolt layout, that is, the number of bolts
per vertical row, and the horizontal and vertical spacing between bolts to achieve a bolt load
of 400 kN/m of slope length.
36. Solution
Factor of safety calculations
1. The factor of safety is calculated using Equations 7.4 to 7.9: The weight W of the block is 1241 kN/m
(Equation 7.8), and the area A of the sliding plane is 13.34 m2/m (Equation 7.5). For water in the
tension crack to depth, zw = 3 m (9.86 ft), the values of the water forces U and V acting on the block
are 196.31 and 44.15 kN/m (Equations 7.6 and 7.7).
In civil applications, this FS is usually a marginal factor of safety for a permanent slope with a high
consequence of failure.
(Kondisi Basah)
37. 2. If the tension crack is completely filled with water, that is, zw = 4.35 m (14.3 ft), and the new factor of
safety is
This FS value indicates that the slope is
close to failure.
3. If the slope were drained so no water pressures act in the tension crack or on the sliding plane, that
is, zw = V = U = 0, then the new factor of safety is
This is usually an adequate factor of safety.
The relationship between the calculated factor of safety and the depth of the water in the tension
crack is plotted in Figure 7.17
(Kondisi Jenuh)
(Kondisi Kering)
38. Figure 7.17 Plot of factor of safety
against depth of water in tension crack
for Example Problem 7.1.
4. If the slope is drained and the cohesion on the sliding plane is
reduced from 25 kPa (3.6 psi) to zero by blast vibrations, then
the new factor of safety is
The loss of cohesion reduces the factor of safety from 1.54 to
1.08, which illustrates the sensitivity of the slope to the
cohesion on the sliding plane.
5. Figure 7.6a shows that the critical tension crack depth is 4.32 m
(i.e. z/H = 0.36), which is close to the position of the tension
crack (i.e. 4.35/12 = 0.36).
39. Slope reinforcement with rock bolts
1. The factor of safety of plane slope failure reinforced with rock bolts is calculated using Equation
7.25. In this case, the slope is drained and the cohesion is zero, that is,
c = U = V = 0
Therefore, for a reinforcement force of T of 400 kN/m installed at a dip angle ψT of 55°, the factor
of safety is
40. 2. If the bolts are installed at a flatter angle, ψT = 20°, then the factor of safety is
This shows the significant improvement that can be achieved by installing bolts at an angle flatter than
the normal to the sliding surface. The optimum angle is when (see Equation 7.26)
3. The rock bolt pattern should be laid out so that the distribution of bolts on the slope is as even as
possible. If four bolts are installed in each vertical row, the horizontal spacing S of the vertical rows is
calculated as follows: (see Equation 7.27)