

Empfohlen
Weitere ähnliche Inhalte
Was ist angesagt?
Was ist angesagt? (19)
Ähnlich wie Crisis and risk management
Ähnlich wie Crisis and risk management (20)
Mehr von ARMEN MEHRABYAN
Mehr von ARMEN MEHRABYAN (20)
Kürzlich hochgeladen
Kürzlich hochgeladen (20)
Crisis and risk management
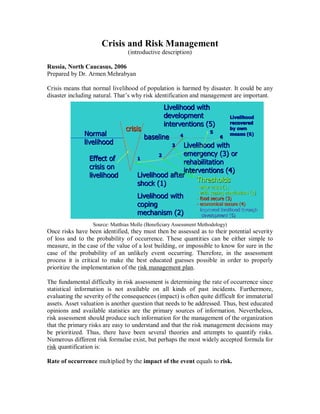
- 1. Crisis and Risk Management (introductive description) Russia, North Caucasus, 2006 Prepared by Dr. Armen Mehrabyan Crisis means that normal livelihood of population is harmed by disaster. It could be any disaster including natural. That’s why risk identification and management are important. Livelihood with development Livelihood interventions (5) recovered crisis 5 by own Normal baseline 4 6 means (6) livelihood 3Livelihood with 2 emergency (3) or Effect of 1 rehabilitation crisis on interventions (4) livelihood Livelihood after Thresholds shock (1) - after crisis (1) - with coping mechanism (2) Livelihood with - food secure (3) coping - economical secure (4) - improved livelihood through mechanism (2) development (5) Source: Matthias Molle (Beneficiary Assessment Methodology) Once risks have been identified, they must then be assessed as to their potential severity of loss and to the probability of occurrence. These quantities can be either simple to measure, in the case of the value of a lost building, or impossible to know for sure in the case of the probability of an unlikely event occurring. Therefore, in the assessment process it is critical to make the best educated guesses possible in order to properly prioritize the implementation of the risk management plan. The fundamental difficulty in risk assessment is determining the rate of occurrence since statistical information is not available on all kinds of past incidents. Furthermore, evaluating the severity of the consequences (impact) is often quite difficult for immaterial assets. Asset valuation is another question that needs to be addressed. Thus, best educated opinions and available statistics are the primary sources of information. Nevertheless, risk assessment should produce such information for the management of the organization that the primary risks are easy to understand and that the risk management decisions may be prioritized. Thus, there have been several theories and attempts to quantify risks. Numerous different risk formulae exist, but perhaps the most widely accepted formula for risk quantification is: Rate of occurrence multiplied by the impact of the event equals to risk.
- 2. Later research has shown that the financial benefits of risk management are less dependent on the formula used but are more dependent on the frequency and how risk assessment is performed. In business it is imperative to be able to present the findings of risk assessments in financial terms. Robert Courtney Jr. (IBM, 1970) proposed a formula for presenting risks in financial terms. The Courtney formula was accepted as the official risk analysis method for the US governmental agencies. The formula proposes calculation of ALE (annualized loss expectancy) and compares the expected loss value to the security control implementation costs (cost-benefit analysis). 3.1. Risk Assessment Risk assessment is measuring two quantities of the risk R, the magnitude of the potential loss L, and the probability p that the loss will occur. Risk assessment may be the most important step in the risk management process, and may also be the most difficult and prone to error. Once risks have been identified and assessed, the steps to properly deal with them are much more programmatical. A risk assessment is an important step in mitigating the impacted of climate changes. It helps you focus on the risks that really matter with the potential to cause real harm. This proposed methodology of risk assessment tells you how to achieve that with a minimum of fuss. This is not the only way to do a risk assessment and there are other methods that work well, particularly for more complex risks and circumstances. However, we believe this method is on of the most straightforward. A risk assessment is simply a careful examination of what could cause harm to people, so that you can weigh up whether you have taken enough precautions or should do more to prevent harm. Workers and others have a right to be protected from harm caused by a failure to take reasonable control measures. Natural disasters can ruin lives and affect country business. That’s why it is required to assess the risks so that you put in place a plan to control the risks. 3.1.1. Five steps to risk assessment Identify the hazards Decide who might be harmed and how Evaluate the risks and decide on precautions Record your findings and implement them Review your assessment and take appropriate measures Part of the difficulty of risk management is that measurement of both of the quantities in which risk assessment is concerned can be very difficult itself. Uncertainty in the
- 3. measurement is often large in both cases. Also, risk management would be simpler if a single metric could embody all of the information in the measurement. However, since two quantities are being measured, this is not possible. A risk with a large potential loss and a low probability of occurring must be treated differently than one with a low potential loss but a high likelihood of occurring. In theory both are of nearly equal priority in dealing with first, but in practice it can be very difficult to manage when faced with the scarcity of resources, especially time, in which to conduct the risk management process. Expressed mathematically, Financial decisions, such as insurance, often express loss terms in dollars. When risk assessment is used for public health or environmental decisions, there are differences of opinions as to whether the loss can be quantified in a common metric such as dollar values or some numerical measure of quality of life. Often for public health and environmental decisions, the loss term is simply a verbal description of the outcome, such as increased cancer incidence or incidence of birth defects. In that case, the "risk" is expressed as: If the risk estimate takes into account information on the number of individuals exposed, it is termed a "population risk" and is in units of expected increased cases per a time
- 4. period. If the risk estimate does not take into account the number of individuals exposed, it is termed an "individual risk" and is in units of incidence rate per a time period. Population risks are of more use for cost/benefit analysis; individual risks are of more use for evaluating whether risks to individuals are "acceptable". Risk of losses due to vulnerability and Benefit gain Potential risk treatments Once risks have been identified and assessed, all techniques to manage the risk fall into one or more of these four major categories: (Dorfman, 1997) (remember as 4 T's) Tolerate (aka retention) Treat (aka mitigation) Terminate (aka elimination) Transfer (aka buying insurance) Ideal use of these strategies may not be possible. Some of them may involve trade-offs that are not acceptable to the organization or person making the risk management decisions. 4.1. Risk avoidance Includes not performing an activity that could carry risk. Avoidance may seem the answer to all risks, but avoiding risks also means losing out on the potential gain that accepting (retaining) the risk may have allowed. 4.2. Risk reduction Involves methods that reduce the severity of the loss. Modern software development methodologies reduce risk by developing and delivering software incrementally. Early methodologies suffered from the fact that they only delivered software in the final phase of development; any problems encountered in earlier phases meant costly rework and often jeopardized the whole project. By developing in iterations, software projects can limit effort wasted to a single iteration. A current trend in software development,
- 5. spearheaded by the Extreme Programming community, is to reduce the size of iterations to the smallest size possible, sometimes as little as one week is allocated to an iteration. 4.3. Risk retention Involves accepting the loss when it occurs. True self insurance falls in this category. Risk retention is a viable strategy for small risks where the cost of insuring against the risk would be greater over time than the total losses sustained. All risks that are not avoided or transferred are retained by default. This includes risks that are so large or catastrophic that they either cannot be insured against or the premiums would be infeasible. Any amounts of potential loss (risk) over the amount insured are retained risk. This may also be acceptable if the chance of a very large loss is small or if the cost to insure for greater coverage amounts is so great it would hinder the goals of the organization too much. 4.4. Risk transfer Means causing another party to accept the risk, typically by contract or by hedging. Insurance is one type of risk transfer that uses contracts. Other times it may involve contract language that transfers a risk to another party without the payment of an insurance premium. Liability among construction or other contractors is very often transferred this way. On the other hand, taking offsetting positions in derivatives is typically how farms use hedging to financially manage risk. Some ways of managing risk fall into multiple categories. Risk retention pools are technically retaining the risk for the group, but spreading it over the whole group involves transfer among individual members of the group. This is different from traditional insurance, in that no premium is exchanged between members of the group up front, but instead losses are assessed to all members of the group. Risk Management Risk management is the process of measuring, or assessing, risk and developing strategies to manage it. Strategies include transferring the risk to another party, avoiding the risk, reducing the negative effect of the risk, and accepting some or all of the consequences of a particular risk. Traditional risk management focuses on risks stemming from physical or legal causes (e.g. natural disasters or fires, accidents, death, and lawsuits). Financial risk management, on the other hand, focuses on risks that can be managed using traded financial instruments. In ideal risk management, a prioritization process is followed whereby the risks with the greatest loss and the greatest probability of occurring are handled first, and risks with lower probability of occurrence and lower loss are handled in descending order. In practice the process can be very difficult, and balancing between risks with a high probability of occurrence but lower loss versus a risk with high loss but lower probability of occurrence can often be mishandled. Intangible risk management identifies a new type of risk - a risk that has a 100% probability of occurring but is ignored by the organization due to a lack of identification ability. For example, when deficient knowledge is applied to a situation, a knowledge risk
- 6. materializes. Relationship risk appears when ineffective collaboration occurs. Process- engagement risk may be an issue when ineffective operational procedures are applied. These risks directly reduce the productivity of knowledge workers, decrease cost effectiveness, profitability, service, quality, reputation, brand value, and earnings quality. Intangible risk management allows risk management to create immediate value from the identification and reduction of risks that reduce productivity. Risk management also faces difficulties allocating resources. This is the idea of opportunity cost. Resources spent on risk management could have been spent on more profitable activities. Again, ideal risk management minimizes spending while maximizing the reduction of the negative effects of risks. 5.1. Steps in the risk management process Establishing the context involves 1. Planning the remainder of the process. 2. Mapping out the following: the scope of the exercise, the identity and objectives of stakeholders, and the basis upon which risks will be evaluated. 3. Defining a framework for the process and an agenda for identification. 4. Developing an analysis of risk involved in the process. 5.2. Identification After establishing the context, the next step in the process of managing risk is to identify potential risks. Risks are about events that, when triggered, cause problems. Hence, risk identification can start with the source of problems, or with the problem itself. Source analysis Risk sources may be internal or external to the system that is the target of risk management. Examples of risk sources are: stakeholders of a drought project, employees of a trading company, etc. Problem analysis Risks are related to identify threats. For example: the threat of losing crop/profit, the threat of abuse of privacy information or the threat of accidents and casualties. The threats may exist with various entities, most important with shareholder, customers and legislative bodies such as the government. When either source or problem is known, the events that a source may trigger or the events that can lead to a problem can be investigated. The chosen method of identifying risks may depend on culture, industry practice and compliance. The identification methods are formed by templates or the development of templates for identifying source, problem or event. Common risk identification methods are: Hazards risk identification. Identification the risks on the base of most frequently hazards. Objectives-based risk identification. Organizations and project teams have objectives. Any event that may endanger achieving an objective partly or completely
- 7. is identified as risk. Objective-based risk identification is at the basis of Enterprise Risk Management - Integrated Framework Scenario-based risk identification. In scenario analysis different scenarios are created. The scenarios may be the alternative ways to achieve an objective, or an analysis of the interaction of forces in, for example, a market or battle. Any event that triggers an undesired scenario alternative is identified as risk. 5.3. Risk Charting This method combines the above approaches by listing Resources at risk, Threats to those resources Modifying Factors which may increase or reduce the risk and Consequences it is wished to avoid. Creating a matrix under these headings enables a variety of approaches. One can begin with resources and consider the threats they are exposed to and the consequences of each. Alternatively one can start with the threats and examine which resources they would affect, or one can begin with the consequences and determine which combination of threats and resources would be involved to bring them about 5.4. Create the plan Decide on the combination of methods to be used for each risk. Each risk management decision should be recorded and approved by the appropriate level of management. The risk management plan should propose applicable and effective security controls for managing the risks. For example, an observed high risk of drought in agriculture could be mitigated by acquiring and implementing Early Warning System. A good risk management plan should contain a schedule for control implementation and responsible persons for those actions. According to ISO/IEC 27001, the stage immediately after completion of the Risk Assessment phase consists of preparing a Risk Treatment Plan, which should document the decisions about how each of the identified risks should be handled. Mitigation of risks often means selection of Security Controls, which should be documented in a Statement of Applicability, which identifies which particular control objectives and controls from the standard have been selected, and why. 5.5. Implementation Follow all of the planned methods for mitigating the effect of the risks tray to avoid all risks that can be avoided without sacrificing the entity's goals, reduce others, and retain the rest. 5.5.1. Review and evaluation of the plan
- 8. Initial risk management plans will never be perfect. Practice, experience, and actual loss results will necessitate changes in the plan and contribute information to allow possible different decisions to be made in dealing with the risks being faced. Risk analysis results and management plans should be updated periodically. There are two primary reasons for this: 1. to evaluate whether the previously selected mitigation methods are still applicable and effective, and 2. to evaluate the possible risk level changes in the business environment. 5.5.2. Limitations If risks are improperly assessed and prioritized, time can be wasted in dealing with risk of losses that are not likely to occur. Spending too much time assessing and managing unlikely risks can divert resources that could be used more profitably. Unlikely events do occur but if the risk is unlikely enough to occur it may be better to simply retain the risk and deal with the result if the loss does in fact occur. Prioritizing too highly the risk management processes could keep an organization from ever completing a project or even getting started. This is especially true if other work is suspended until the risk management process is considered complete. It is also important to keep in mind the distinction between risk and uncertainty. Risk can be measured by impacts x probability. 5.5.3. Areas of risk management As applied to climate changes, risk management is the technique for measuring, monitoring and controlling the agriculture operational risk on a farm's balance sheet. The Basel II framework breaks risks into market risk (price risk), credit risk and operational risk and also specifies methods for calculating capital requirements for each of these components. 5.5.4. Farming Enterprise risk management In farming enterprise risk management, a risk is defined as a possible event or circumstance that can have negative influences on the Agriculture Enterprise in question. Its impact can be on the very existence, the resources (human and capital), the products and services, or the customers of the enterprise, as well as external impacts on society, markets, or the environment. In a financial institution, enterprise risk management is normally thought of as the combination of credit risk, market risk, interest rate risk, and operational risk. In the more general case, every probable risk can have a pre-formulated plan to deal with its possible consequences (to ensure contingency if the risk becomes a liability).
- 9. From the information above and the average cost per employee over time, or cost accrual ratio, a project manager can estimate: the cost associated with the risk if it arises, estimated by multiplying employee costs per unit time by the estimated time lost (cost impact, C where C = cost accrual ratio * S). the probable increase in time associated with a risk (schedule variance due to risk, Rs where Rs = P * S): Sorting on this value puts the highest risks to the schedule first. This is intended to cause the greatest risks to the project to be attempted first so that risk is minimized as quickly as possible. This is slightly misleading as schedule variances with a large P and small S and vice versa are not equivalent. (The risk of the RMS Titanic sinking vs. the passengers' meals being served at slightly the wrong time). the probable increase in cost associated with a risk (cost variance due to risk, Rc where Rc = P*C = P*CAR*S = P*S*CAR) sorting on this value puts the highest risks to the budget first. see concerns about schedule variance as this is a function of it, as illustrated in the equation above. Risk in a project or process can be due either to Special Cause Variation or Common Cause Variation and requires appropriate treatment. That is to re-iterate the concern about extremal cases not being equivalent in the list immediately above. 5.5.5. Risk management activities as applied to project management In project management, risk management includes the following activities: Planning how risk management will be held in the particular project. Plan should include risk management tasks, responsibilities, activities and budget. Assigning a risk officer - a team member other than a project manager who is responsible for foreseeing potential project problems. Typical characteristic of risk officer is a healthy skepticism. Maintaining live project risk database. Each risk should have the following attributes: opening date, title, short description, probability and importance. Optionally a risk may have an assigned person responsible for its resolution and a date by which the risk must be resolved. Creating anonymous risk reporting channel. Each team member should have possibility to report risk that he foresees in the project. Preparing mitigation plans for risks that are chosen to be mitigated. The purpose of the mitigation plan is to describe how this particular risk will be handled – what, when, by who and how will it be done to avoid it or minimize consequences if it becomes a liability. Summarizing planned and faced risks, effectiveness of mitigation activities and effort spend for the risk management 5. 6. Risk management and business continuity
- 10. Risk management is simply a practice of systematically selecting cost effective approaches for minimizing the effect of threat realization. All risks can never be fully avoided or mitigated simply because of financial and practical limitations. Therefore farmers have to accept some level of residual risks. Whereas risk management tends to be pre-emptive, farm management planning (FMP) was invented to deal with the consequences of realized residual risks. The necessity to have FMP (for large scale farming organization) in place arises because even very unlikely events will occur if given enough time. Risk management and FMP are often mistakenly seen as rivals or overlapping practices. In fact these processes are so tightly tied together that such separation seems artificial. For example, the risk management process creates important inputs for the FMP (assets, impact assessments, cost estimates etc). Risk management also proposes applicable controls for the observed risks. Therefore, risk management covers several areas that are vital for the FMP process. However, the FMP process goes beyond risk management's pre-emptive approach and moves on from the assumption that the disaster will realize at some point. Crisis Response and Assistance Monotoring Logical framework Impac t The overall change to which the outcomes contributes to achieve Outcomes Foreseen improvem ents of the situation of the beneficiary Outputs Products, goods, services, skills generated Ac tivities Actions or work needed for the project im plementation Inputs Financial, human & material resources needed
- 11. 7.1. Creating SMART Objectives Project outcome: “60 percent of farmers in the district of Gulu, northern Uganda, will have covered 70% of their basic food needs (maize, beans and sesame) through own production within 1 year, through the distribution of agricultural inputs (improved varieties, tools and fertilizer)and improved cultivation practices under the prevailing security situation”. To make sure that an objective is sufficiently detailed, use the SMART-rule: S specific specifies exactly the result 60% of farmers in the district of Gulu, northern Uganda M measurable the result can be tracked will have covered 70% of their basic food needs (maize, beans and sesame) through own production A attainable should be realistic the approach chosen will enable attaining the objective R relevant to the intended result influencing factors have been taken into consideration T time-framed indicates a specific period within 1 year
- 12. 7.2. Monitoring and Evaluation 7.2.1. Indicators for Measurement Objective hierarchy Indicators Means of Risk and verification assumptions Impact Improve the living Increased % of Impact Security remains standards of farmers. population: assessment, the same, no - with access to statistics from further schools & health health post and displacement, services; schools, EFSA school and health - reaching food from WFP, post working self–sufficiency; CFSAM reports, normally - ability to cover cash expenditures Outcome P1: increase food - Food availability Impact No adverse self-sufficiency with a per household; assessment, climatic 30% higher staple - reduced EFSA from conditions, access food production dependency on WFP, to land not (maize and beans) food aid; Impact restricted, security after the first - food purchased assessment, remains the same, harvest. by households; Field farmers have the P2: increase - shortened hunger observations, necessary inputs production by 20% gap. Attendance list and tools for through improved - % of farmers to training implementing the agricultural practices using improved course learned practices, - applying newly technologies; - Impact access to market learned technologies. increased assessment, and demand for P3: increase cash production; EFSA from vegetables exists income by 10% after - reduced WFP, one season by selling workload in the produce from field. vegetable cultivation. - Cash availability; - reduced debts. Output - Production; - Kg of maize and - improved skills; vegetables; - income - obtained knowledge; - amount of currency. Activities See implementation schedule
- 13. 7.2.2. Implementation Activities Hire staff Latest mid June Procurement of inputs “ mid June Coordinate with actors during whole June Contract with NGOs Latest end June Selection of beneficiaries Latest mid July Distribution of inputs Latest end July Post distribution evaluation Mid August Mid-term report End August Training sessions (three) In August, October and December Crop performance evaluation Mid September until Mid October Monitoring All along June until January Impact assessment January Reporting End of February 7.2.3. Potentialities and Constrains Parameter Potentialities Constrains Political security situation improvement worsening information access to good sources misinformation military supporting mistrust sovereignty of state support actions delays approvals state supporting / facilitator not in their interest Logistical communication available / radio licence remote area / no access to HF roads good whole year none or bad conditions / seasonal storage facilities available has to be set up Organisational mobility of beneficiaries are settled down further displacement possible again number of beneficiaries constant number fluctuating and / or high numbers professional workers motivated / skilled lack experience & professionalism local workers motivated / skilled low level education / commitment Financial cost are covered funded only part of all needs banking systems available cash transfers with high risks Impacts economical increase production disrupts local markets environmental avoids bigger problems deplete natural resources humanitarian efficient interventions creates dependency by the beneficiaries reached self-sufficiency lost by the population synergies working jealousy towards beneficiaries by the public supports intervention has other priorities (health for all) by the authorities supports intervention uses for political reasons 7.3. Evalu ation Metho dology
- 14. 7.3.1. Stakeholder analysis – Brainstorming – Discussion with focus groups – Strengths, Weaknesses, Opportunities and Threats (SWOT) – Drama and role plays – Dreams and visions – Impact flow diagram (or cause-effect diagram) – Institutional Linkage Diagram (or Venn / Chapatti diagram) – Problem and Objective Trees – Documentation review 7.3.2. Biophysical measurements – BMI (adults) – MUAC (school children) – UNICEF Table (children below 5) 7.3.3. Direct observations – Transect – Sketch – Mapping and GIS Mapping – Photographs and Video 7.3.4. Cost Benefit Analysis 7.3.5. Semi structured interviews 7.3.6. Case studies – Diaries – Historical Trends and Timelines – Seasonal Calendars – Table of most significant changes
- 15. 7.3.7. Impacted Assessment Surveys • When are the time-periods for implementing the surveys • Which kind of data will be collected – Design of questionnaire • Which is the sample size (beneficiaries & control group) • Who will do which work – Data collection, data entry, data analysis, reporting • How to outsource the data collection – Selection of institution or NGO (signing of contract) • Which are the available skills – Training needed • Which are the costs of the whole exercise – Budget • How are those costs covered – Which project budget line will be charged • Sample unit: households / beneficiaries • Sample size: around 7% of total beneficiaries • Sampling methodologies - Systematic sampling - Random sampling - Non-random sampling - Purposive sampling (targeting selected group) - Quota sampling (same sample size of each group) • Control group (non beneficiaries) 7.3.8. Survey Post distribution survey Crop performance survey Harvest crop performance Impact assessment 7.3.9. Data gathering Geographical data Household characteristics Household economy data 7.3.10. Data Analyzes • Data codification and conversion – List of codes – List of conversions
- 16. • Data entering (Excel or Access Database) • Data controlling (filtering) • Data analysis with Excel Pivot Tables • Proportional pilling • Pair wise ranking • Wealth ranking • Well-been ranking with cards • Mapping (soils, cops, ethnic groups, resources)