SlideShare a Scribd company logo
1 of 4
Download to read offline
6 • SEPTEMBER 2015 • NORTH AMERICAN WINDPOWER
R
egulators need to explicitly
consider the market values
of the power products pro-
vided by onshore and offshore wind
projects when setting development
policies. The values of those energy
and capacity products determined
in competitive markets – along with
emissions and other key factors such
as siting, transmission, supply chain
and avian or marine life impacts –
are important indicators of ratepayer
benefits, assuming that the local sys-
tem operator “gets the prices right.”
	 In order to compare the power
market values of hypothetical on-
shore and offshore wind projects in
New England, hourly wind produc-
tion and recent power market price
data were used for projects of equiva-
lent size. The results demonstrated
that an offshore project would have
generated more energy (due to the
wind resource) annually, with much
higher peak-hour deliveries that are
critical for capacity (as determined
under regional market rules) com-
pared to an onshore project. An off-
shore wind project would also have
benefited from slightly higher en-
ergy prices, reflecting the advantage
of delivering energy closer to load
centers.
Wind resource data and project
generation
	 A number of onshore wind proj-
ects have been successfully developed
in New England, while offshore proj-
ects have had limited development to
date. This paper examines the whole-
sale power market values of hypo-
thetical onshore and offshore wind
projects based on historical wind re-
source data and on energy and capac-
ity prices, with particular focus on
wind energy’s contribution to meet
peak energy demands.
	 The updated 2012 data set – pre-
pared by the National Renewable En-
ergy Laboratory (NREL) and covering
the period from 2004 to 2006 for like-
ly wind project locations throughout
New England – was used for the anal-
ysis. Most of New England’s onshore
wind projects have been developed in
northern Maine, and further develop-
ment is possible with transmission
upgrades. One offshore wind project
is under construction off of Block Is-
land, R.I., and there are other proj-
ects under development in Nantucket
Sound and off of the eastern Rhode
Island/southwestern Massachusetts
shoreline.
	 To facilitate comparisons, the
study assumed that an onshore proj-
ect in northern Maine and an offshore
project off of the Rhode Island/Mas-
sachusetts coast would be sized to de-
liver 100 MW (net of collection and
cable losses) into the transmission
grid administered by the Indepen-
dent System Operator – New England
(ISO-NE), the entity that administers
the regional bulk power market. The
study recognized that projects could
be larger, especially offshore projects
that are typically 400 MW or larger,
but we assumed projects of equivalent
size for the purpose of this analysis.
As Figure 1 illustrates, the offshore
project would generate 16.7% more
energy every year due to stronger and
more consistent wind resources at
these sites.
	 The hypothetical onshore project
would generate an average of 330,685
MWh/year, which would be equiva-
lent to a 37.8% capacity factor based
on the 100 MW net rating and 36.7%
based on a 103 MW gross rating.
	 Both wind project locations have
pronounced seasonal patterns with
energy generation peaking in the win-
ter months, especially in December
(months 12, 24, and 36) and January
(months 1, 13, and 25). New England
is predominantly a summer-peaking
system. However, both locations dis-
play markedly lower generation dur-
ing the summer months. Onshore
wind project generation from June
through September during peak
hours (from 1 p.m. to 6 p.m.) would
have an 18.5% capacity factor, while
offshore wind project generation
would have a 30.5% capacity factor
for those same peak hours. These
summer-generation profiles have sig-
nificant reliability and capacity value
implications, as explained below.
Energy market values
	 In order to calculate the market
energy value of the wind projects, we
utilized ISO-NE Real Time Market
Locational Marginal Price (LMP)
data for 2012 through 2014 at two
locations: the Kibby node in Frank-
lin County, Maine, for the onshore
project and the Brayton Point node
in Bristol County, Mass., for the off-
shore project. The Kibby node is used
Surprising Takeaways From
A New Power Market Analysis
A recent comparison of offshore and onshore wind prices in New England
revealed some surprising discoveries.
By Seth G. Parker & Dr. Angeliki A. Rigos
Industry At Large: Power Markets
Figure 1: Monthly Onshore and Offshore Wind Generation in New England (2004-2006)
Source: LAI Inc.
60,000
50,000
40,000
30,000
20,000
10,000
0
1 13 257 19 313 15 279 21 335 17 2911 23 35
Month
Offshore Onshore
Generation(MWh)
Figure 2: ISO-NE 2012-2014 Monthly Average LMPs for Kibby and Brayton Point Nodes
Source: LAI Inc.
180
160
140
120
100
80
60
40
20
0
1 13 257 19 313 15 279 21 335 17 2911 23 35
Month
Offshore Onshore
LMPs(Price/MWh)
NORTH AMERICAN WINDPOWER • SEPTEMBER 2015 • 7
by operating wind projects in Maine.
The Brayton Point node is likely to
be a future interconnection point for
large offshore projects once the Bray-
ton Point power plant retires in 2017;
that substation will then be able to
accept at least 1,500 MW and deliver
it into the ISO-NE transmission grid.
	 Monthly average LMPs for the two
nodes over the three-year period from
2012 to 2014 are illustrated in Figure 2.
The LMP spikes from January to Feb-
ruary 2013 and from December 2013
to March 2014 reflect high gas and oil
prices during cold weather periods.
	 Market energy prices are typically
higher when a project is close to load
centers due to lower losses and less
transmission congestion. The Kibby
and Brayton Point nodes are no excep-
tions. The Brayton Point energy prices
averaged about 9% higher than Kibby’s
prices. Therefore, an offshore wind
project interconnected to the Brayton
Point substation (and other locations
in southeastern Massachusetts with
similar LMPs) would receive slightly
higher energy revenues than an on-
shore project of equivalent size located
in northern Maine (see Figure 3).
Capacity market values
	 ISO-NE market rules require
new wind generators to provide
continued on page 21
Figure 3: Monthly Energy Revenues for Onshore and Offshore Wind Projects (2012-2014)
Source: LAI Inc.
$7,000,000
$6,000,000
$5,000,000
$4,000,000
$3,000,000
$2,000,000
$1,000,000
$0
1 13 257 19 313 15 279 21 335 17 2911 23 35
Month
Offshore Onshore
EnergyRevenues
Source: LAI Inc.
10 11 12
70
60
50
40
30
20
10
0
1 742 853 96
Month
CapacityFactor
Offshore Onshore
Figure 4: Average Monthly Capacity Factors for Hypothetical Offshore and Onshore Wind Projects
(based on 100 MW net capacities)
NORTH AMERICAN WINDPOWER • SEPTEMBER 2015 • 21
and 46.3% in the winter. It would
receive 31.2 MW of summer capac-
ity revenues and 46.3 MW of winter
capacity revenues at the southeastern
Massachusetts/Rhode Island (SEMA/
RI) zonal price.
	 Figure 4 illustrates the monthly
average capacity factors under ISO-
NE rules for the two projects and
highlights the significant difference
between them during summer hours.
	 ISO-NE sets capacity market pric-
es for annual capacity commitment
periods (from June 1 to May 31)
through forward capacity auctions
(FCAs). Therefore, capacity revenues
for a calendar year are based on the
last five months (January through
May) of one FCA and the first seven
months (June through December)
of the following FCA. The FCA re-
sults for the relevant years were the
administratively determined floor
prices and the Maine and SEMA/RI
zonal prices were identical, as shown
in Table 1, and are not proper indica-
tors now that ISO-NE has adopted
changes to how FCAs are tabulated.
	 The capacity revenues for the two
wind projects were calculated based
on their respective capacity values
and the ISO-NE capacity prices for
the calendar years 2012 through 2014,
as illustrated in Figure 5. The higher
capacity value for the offshore wind
project would have provided an ex-
tra $28,100 per month. Moreover, the
most recent auction, FCA 9 for 2018
through 2019, resulted in much high-
er prices, particularly for the SEMA/
RI zone, which would magnify the
capacity market value advantage for
future offshore wind projects.
Other considerations
	 There are a number of financial,
environmental and other factors that
should be considered in any policy
(and investment) decisions regarding
onshore and offshore wind projects.
First and foremost are the signifi-
cant capital cost and operations and
maintenance cost differences between
onshore and offshore projects that
reflect different design, access, equip-
ment and construction methods. The
net result of the power market rev-
enue and project cost differences are
manifested in renewable energy certif-
icate (REC) and offshore REC prices.
Air emissions considerations are also
important for policymakers – neither
wind technology emits carbon or oth-
er air pollutants, nor requires water
for cooling or for emissions control,
“… measured and recorded site-
specific summer and winter data …”
during intermittent reliability hours
to support a claimed qualified ca-
pacity and receive capacity market
revenues. Summer intermittent re-
liability hours are 1 p.m. to 6 p.m.
in June; September and winter inter-
mittent reliability hours are 5 p.m. to
7 p.m. from October through May.
ISO-NE also counts hours in which it
experiences shortage events, but those
events were ignored for the purpose
of this paper. Based on the NREL da-
ta, the following capacity values were
calculated:
■	 The hypothetical onshore wind
project would have capacity values
of 19.0% in the summer and 38.6%
in the winter. Based on 100 MW, it
would receive 19.0 MW of summer
capacity revenues and 38.6 MW of
winter capacity revenues at the Frank-
lin County zonal price.
■	 The hypothetical offshore wind
project would have much higher ca-
pacity values of 31.2% in the summer
continued from page 7
Industry At Large: Power Markets
Table 1: ISO-NE Wholesale Capacity Prices (Price Per kW/Month)
Wind
Project
FCA
Zone
2011-12
(FCA 2)
2012-13
(FCA 3)
2013-14
(FCA 4)
2014-15
(FCA 5)
Onshore ME $3.60 $2.95 $2.951 $3.209
Offshore SEMA/RI $3.60 $2.95 $2.951 $3.209
Source: LAI Inc.
22 • SEPTEMBER 2015 • NORTH AMERICAN WINDPOWER
WEB INDEX
AMG - RD
mize visual impact, but eliminating
impact completely may not be pos-
sible. Eventually, offshore projects
may be able to utilize floating wind
turbine technology that would enable
them to be built in deeper waters far-
ther offshore.
	 Transmission lines. Onshore proj-
ects often require new or upgraded
transmission lines to interconnect
them to the existing grid, and offshore
projects typically utilize underwater
cables to interconnect them to coastal
substations. So, both technologies
may require system upgrades to ac-
commodate the wind energy without
triggering reliability violations.
	 However, offshore wind is typically
closer to load centers and may reduce
overall transmission costs and losses
for the region in the long run.
which is a consideration in regions
with limited water resources. How-
ever, there are many other important
considerations:
	 Footprint. Although the individu-
al footprint of an onshore or offshore
turbine is relatively small, the area
covered by the wind farm is much
larger because the turbines have to be
spaced far enough from each other
to minimize interference of the wind
wake.
	 Siting. Though builders of off-
shore wind projects can minimize sit-
ing issues by building them in federal
waters and situating them more than
three miles from shore, there may be
opposition from local residents or
other stakeholders.
	 Visual impact. Onshore and off-
shore projects can be sited to mini-
Industry At Large: Power Markets
	 Acoustic impacts. Onshore proj-
ects that are located in remote areas
may not avoid noise issues; projects
situated closer to populated areas may
have problems, despite the background
noise to mask their sounds. Sounds
generated by offshore wind farms
should not be problematic given the
distance to population centers.
	 Supply chain. Due to the large
onshore wind market, turbine man-
ufacturers have invested heavily in
domestic manufacturing capability.
Offshore turbines will likely be im-
ported until manufacturers have a
reasonably steady domestic demand.
Offshore wind is very conducive
to building a local industry, how-
ever, given size and transportation
considerations.
	 Avian and marine life. There have
been instances of migratory bird
mortalities from onshore and off-
shore projects, as well as harm dur-
ing construction. Offshore projects
may also have both negative and posi-
tive marine wildlife impacts, such as
small protected zones around their
bases. w
Seth Parker is vice president and prin-
cipal of Levitan & Associates (LAI).
Dr. Angeliki Rigos is an executive con-
sultant at LAI and an associate profes-
sor at Merrimack College. They are
part of the LAI team implementing
Maryland’s Offshore Wind Energy Act
of 2013 for the Public Service Com-
mission. They can be reached at
sgp123@lai.com and dar@levitan.
com, respectively.
Figure 5: Monthly Capacity Revenues for Hypothetical Offshore and Onshore Wind Projects (2012-2014)
Source: LAI Inc.
180,000
160,000
140,000
120,000
100,000
80,000
60,000
40,000
20,000
0
1 13 257 19 313 15 279 21 335 17 2911 23 35
Month
Offshore Onshore
CapacityRevenues
Figure 6: Energy and Capacity Revenues for Hypothetical Onshore and Offshore Wind Projects (2012-2014)
Source: LAI Inc.
$30,000,000
$25,000,000
$20,000,000
$15,000,000
$10,000,000
$5,000,000
$0
Offshore 2012 Onshore Offshore 2013 Onshore Offshore 2014 Onshore
■ Capacity Revenues ■ Energy Revenues
TotalRevenues

More Related Content

What's hot

What's hot (8)

2018 Russia Gas Fields Map
2018 Russia Gas Fields Map2018 Russia Gas Fields Map
2018 Russia Gas Fields Map
 
Spatial flexibility in redispatch: Supporting low carbon energy systems with ...
Spatial flexibility in redispatch: Supporting low carbon energy systems with ...Spatial flexibility in redispatch: Supporting low carbon energy systems with ...
Spatial flexibility in redispatch: Supporting low carbon energy systems with ...
 
Long-term energy system modelling with improved resolution to address short-t...
Long-term energy system modelling with improved resolution to address short-t...Long-term energy system modelling with improved resolution to address short-t...
Long-term energy system modelling with improved resolution to address short-t...
 
Enhancement to the TIMES Source Code: Enabling REGIONS and TIME-SLICES to be ...
Enhancement to the TIMES Source Code: Enabling REGIONS and TIME-SLICES to be ...Enhancement to the TIMES Source Code: Enabling REGIONS and TIME-SLICES to be ...
Enhancement to the TIMES Source Code: Enabling REGIONS and TIME-SLICES to be ...
 
TIMES Course for Master Students in DTU: Reflections and Way Forward
TIMES Course for Master Students in DTU: Reflections and Way ForwardTIMES Course for Master Students in DTU: Reflections and Way Forward
TIMES Course for Master Students in DTU: Reflections and Way Forward
 
Addressing Uncertainty in TIMES Using Monte Carlo Analysis
Addressing Uncertainty in TIMES Using Monte Carlo AnalysisAddressing Uncertainty in TIMES Using Monte Carlo Analysis
Addressing Uncertainty in TIMES Using Monte Carlo Analysis
 
Load forecast
Load forecastLoad forecast
Load forecast
 
Achieving Sustainable Energy for All in South Asia: Modalities of Cooperation
Achieving Sustainable Energy for All in South Asia: Modalities of CooperationAchieving Sustainable Energy for All in South Asia: Modalities of Cooperation
Achieving Sustainable Energy for All in South Asia: Modalities of Cooperation
 

Viewers also liked

Megha's resume-1-2
Megha's resume-1-2Megha's resume-1-2
Megha's resume-1-2
Megha Sharma
 
Presention strasbourg mon amour
Presention strasbourg mon amourPresention strasbourg mon amour
Presention strasbourg mon amour
Pierre France
 
NEW CV(RESUME')
NEW CV(RESUME')NEW CV(RESUME')
NEW CV(RESUME')
fahad shah
 
Brennan_Kaitlyn_Arestyposter
Brennan_Kaitlyn_ArestyposterBrennan_Kaitlyn_Arestyposter
Brennan_Kaitlyn_Arestyposter
Kaitlyn Brennan
 

Viewers also liked (20)

PUFLinePack1_11_11
PUFLinePack1_11_11PUFLinePack1_11_11
PUFLinePack1_11_11
 
Charles Trenet - Sebastian Colley
Charles Trenet - Sebastian ColleyCharles Trenet - Sebastian Colley
Charles Trenet - Sebastian Colley
 
Mieux communiquer sur les réseaux sociaux
Mieux communiquer sur les réseaux sociauxMieux communiquer sur les réseaux sociaux
Mieux communiquer sur les réseaux sociaux
 
Global warming
Global warmingGlobal warming
Global warming
 
Global warming
Global warmingGlobal warming
Global warming
 
Resume
ResumeResume
Resume
 
Bevel
BevelBevel
Bevel
 
Megha's resume-1-2
Megha's resume-1-2Megha's resume-1-2
Megha's resume-1-2
 
matters in our surrounding
matters in our surroundingmatters in our surrounding
matters in our surrounding
 
Bevel
BevelBevel
Bevel
 
Schumpeter
SchumpeterSchumpeter
Schumpeter
 
Quoxymorons Quiz session-1
Quoxymorons Quiz session-1Quoxymorons Quiz session-1
Quoxymorons Quiz session-1
 
Kamal
KamalKamal
Kamal
 
Tcs 11
Tcs 11Tcs 11
Tcs 11
 
Presentation zac fegersheim
Presentation zac fegersheimPresentation zac fegersheim
Presentation zac fegersheim
 
Presention strasbourg mon amour
Presention strasbourg mon amourPresention strasbourg mon amour
Presention strasbourg mon amour
 
NEW CV(RESUME')
NEW CV(RESUME')NEW CV(RESUME')
NEW CV(RESUME')
 
Brennan_Kaitlyn_Arestyposter
Brennan_Kaitlyn_ArestyposterBrennan_Kaitlyn_Arestyposter
Brennan_Kaitlyn_Arestyposter
 
Reaccion de maillard
Reaccion de maillardReaccion de maillard
Reaccion de maillard
 
La television
La televisionLa television
La television
 

Similar to PowerMarkets_NAW1509

The Unheralded Value In Offshore Wind An Evaluation Using pCoudAnalytics
The Unheralded Value In Offshore Wind An Evaluation Using pCoudAnalyticsThe Unheralded Value In Offshore Wind An Evaluation Using pCoudAnalytics
The Unheralded Value In Offshore Wind An Evaluation Using pCoudAnalytics
Kofi Amoako-Gyan
 
Utility ownership of combined heat and power an economic model based approach
Utility ownership of combined heat and power an economic model based approachUtility ownership of combined heat and power an economic model based approach
Utility ownership of combined heat and power an economic model based approach
eSAT Journals
 
Updated plant costs 2010
Updated plant costs 2010Updated plant costs 2010
Updated plant costs 2010
myatom
 
Electrical power generation through concentrated solar technology for the sou...
Electrical power generation through concentrated solar technology for the sou...Electrical power generation through concentrated solar technology for the sou...
Electrical power generation through concentrated solar technology for the sou...
IJECEIAES
 

Similar to PowerMarkets_NAW1509 (20)

Report: Access Northeast Project - Reliability Benefits and Energy Cost Savin...
Report: Access Northeast Project - Reliability Benefits and Energy Cost Savin...Report: Access Northeast Project - Reliability Benefits and Energy Cost Savin...
Report: Access Northeast Project - Reliability Benefits and Energy Cost Savin...
 
The Unheralded Value In Offshore Wind An Evaluation Using pCoudAnalytics
The Unheralded Value In Offshore Wind An Evaluation Using pCoudAnalyticsThe Unheralded Value In Offshore Wind An Evaluation Using pCoudAnalytics
The Unheralded Value In Offshore Wind An Evaluation Using pCoudAnalytics
 
About rrf
About rrfAbout rrf
About rrf
 
Unit 9: Comparing the Costs of Renewable and Conventional Energy Sources
Unit 9: Comparing the Costs of Renewable and Conventional Energy SourcesUnit 9: Comparing the Costs of Renewable and Conventional Energy Sources
Unit 9: Comparing the Costs of Renewable and Conventional Energy Sources
 
PennEast Pipeline - Energy Market Savings Report & Analysis
PennEast Pipeline - Energy Market Savings Report & AnalysisPennEast Pipeline - Energy Market Savings Report & Analysis
PennEast Pipeline - Energy Market Savings Report & Analysis
 
Utility ownership of combined heat and power an economic model based approach
Utility ownership of combined heat and power an economic model based approachUtility ownership of combined heat and power an economic model based approach
Utility ownership of combined heat and power an economic model based approach
 
Offshore Wind Energy Market Trends and Forecast 2014 - 2022
Offshore Wind Energy Market Trends and Forecast 2014 - 2022Offshore Wind Energy Market Trends and Forecast 2014 - 2022
Offshore Wind Energy Market Trends and Forecast 2014 - 2022
 
Offshore Wind Energy Installed Capacity to Reach 52,120.9 MW by 2022
Offshore Wind Energy Installed Capacity to Reach 52,120.9 MW by 2022 Offshore Wind Energy Installed Capacity to Reach 52,120.9 MW by 2022
Offshore Wind Energy Installed Capacity to Reach 52,120.9 MW by 2022
 
Updated plant costs 2010
Updated plant costs 2010Updated plant costs 2010
Updated plant costs 2010
 
Sandia 2014 Wind Turbine Blade Workshop- Zayas
Sandia 2014 Wind Turbine Blade Workshop- ZayasSandia 2014 Wind Turbine Blade Workshop- Zayas
Sandia 2014 Wind Turbine Blade Workshop- Zayas
 
ISO New England - 2016 Regional Electricity Outlook
ISO New England - 2016 Regional Electricity OutlookISO New England - 2016 Regional Electricity Outlook
ISO New England - 2016 Regional Electricity Outlook
 
IRJET Wind Data Estimation of Kolhapur District using Improved Hybrid Opt...
IRJET  	  Wind Data Estimation of Kolhapur District using Improved Hybrid Opt...IRJET  	  Wind Data Estimation of Kolhapur District using Improved Hybrid Opt...
IRJET Wind Data Estimation of Kolhapur District using Improved Hybrid Opt...
 
Análisis estadístico de la dirección y velocidad del viento en Matehuala S.L.P.
Análisis estadístico de la dirección y velocidad del viento en Matehuala S.L.P.Análisis estadístico de la dirección y velocidad del viento en Matehuala S.L.P.
Análisis estadístico de la dirección y velocidad del viento en Matehuala S.L.P.
 
POWER SYSTEM PLANNING
POWER SYSTEM PLANNINGPOWER SYSTEM PLANNING
POWER SYSTEM PLANNING
 
Report: New England Energy Landscape Update
Report: New England Energy Landscape UpdateReport: New England Energy Landscape Update
Report: New England Energy Landscape Update
 
IRJET- A Revieiw of Wind Energy Potential in Kano State, Nigeria for the ...
IRJET-  	  A Revieiw of Wind Energy Potential in Kano State, Nigeria for the ...IRJET-  	  A Revieiw of Wind Energy Potential in Kano State, Nigeria for the ...
IRJET- A Revieiw of Wind Energy Potential in Kano State, Nigeria for the ...
 
Electrical power generation through concentrated solar technology for the sou...
Electrical power generation through concentrated solar technology for the sou...Electrical power generation through concentrated solar technology for the sou...
Electrical power generation through concentrated solar technology for the sou...
 
SLEMA Journal 2.pdf
SLEMA Journal 2.pdfSLEMA Journal 2.pdf
SLEMA Journal 2.pdf
 
Two difficulties
Two difficultiesTwo difficulties
Two difficulties
 
An Experimental Study of Weibull and Rayleigh Distribution Functions of Wind ...
An Experimental Study of Weibull and Rayleigh Distribution Functions of Wind ...An Experimental Study of Weibull and Rayleigh Distribution Functions of Wind ...
An Experimental Study of Weibull and Rayleigh Distribution Functions of Wind ...
 

PowerMarkets_NAW1509

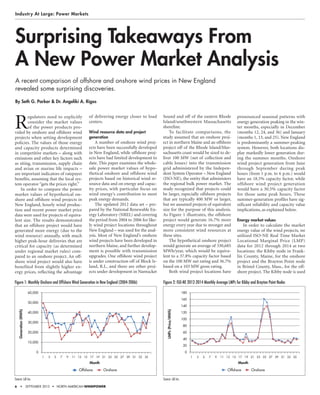
  • 1. 6 • SEPTEMBER 2015 • NORTH AMERICAN WINDPOWER R egulators need to explicitly consider the market values of the power products pro- vided by onshore and offshore wind projects when setting development policies. The values of those energy and capacity products determined in competitive markets – along with emissions and other key factors such as siting, transmission, supply chain and avian or marine life impacts – are important indicators of ratepayer benefits, assuming that the local sys- tem operator “gets the prices right.” In order to compare the power market values of hypothetical on- shore and offshore wind projects in New England, hourly wind produc- tion and recent power market price data were used for projects of equiva- lent size. The results demonstrated that an offshore project would have generated more energy (due to the wind resource) annually, with much higher peak-hour deliveries that are critical for capacity (as determined under regional market rules) com- pared to an onshore project. An off- shore wind project would also have benefited from slightly higher en- ergy prices, reflecting the advantage of delivering energy closer to load centers. Wind resource data and project generation A number of onshore wind proj- ects have been successfully developed in New England, while offshore proj- ects have had limited development to date. This paper examines the whole- sale power market values of hypo- thetical onshore and offshore wind projects based on historical wind re- source data and on energy and capac- ity prices, with particular focus on wind energy’s contribution to meet peak energy demands. The updated 2012 data set – pre- pared by the National Renewable En- ergy Laboratory (NREL) and covering the period from 2004 to 2006 for like- ly wind project locations throughout New England – was used for the anal- ysis. Most of New England’s onshore wind projects have been developed in northern Maine, and further develop- ment is possible with transmission upgrades. One offshore wind project is under construction off of Block Is- land, R.I., and there are other proj- ects under development in Nantucket Sound and off of the eastern Rhode Island/southwestern Massachusetts shoreline. To facilitate comparisons, the study assumed that an onshore proj- ect in northern Maine and an offshore project off of the Rhode Island/Mas- sachusetts coast would be sized to de- liver 100 MW (net of collection and cable losses) into the transmission grid administered by the Indepen- dent System Operator – New England (ISO-NE), the entity that administers the regional bulk power market. The study recognized that projects could be larger, especially offshore projects that are typically 400 MW or larger, but we assumed projects of equivalent size for the purpose of this analysis. As Figure 1 illustrates, the offshore project would generate 16.7% more energy every year due to stronger and more consistent wind resources at these sites. The hypothetical onshore project would generate an average of 330,685 MWh/year, which would be equiva- lent to a 37.8% capacity factor based on the 100 MW net rating and 36.7% based on a 103 MW gross rating. Both wind project locations have pronounced seasonal patterns with energy generation peaking in the win- ter months, especially in December (months 12, 24, and 36) and January (months 1, 13, and 25). New England is predominantly a summer-peaking system. However, both locations dis- play markedly lower generation dur- ing the summer months. Onshore wind project generation from June through September during peak hours (from 1 p.m. to 6 p.m.) would have an 18.5% capacity factor, while offshore wind project generation would have a 30.5% capacity factor for those same peak hours. These summer-generation profiles have sig- nificant reliability and capacity value implications, as explained below. Energy market values In order to calculate the market energy value of the wind projects, we utilized ISO-NE Real Time Market Locational Marginal Price (LMP) data for 2012 through 2014 at two locations: the Kibby node in Frank- lin County, Maine, for the onshore project and the Brayton Point node in Bristol County, Mass., for the off- shore project. The Kibby node is used Surprising Takeaways From A New Power Market Analysis A recent comparison of offshore and onshore wind prices in New England revealed some surprising discoveries. By Seth G. Parker & Dr. Angeliki A. Rigos Industry At Large: Power Markets Figure 1: Monthly Onshore and Offshore Wind Generation in New England (2004-2006) Source: LAI Inc. 60,000 50,000 40,000 30,000 20,000 10,000 0 1 13 257 19 313 15 279 21 335 17 2911 23 35 Month Offshore Onshore Generation(MWh) Figure 2: ISO-NE 2012-2014 Monthly Average LMPs for Kibby and Brayton Point Nodes Source: LAI Inc. 180 160 140 120 100 80 60 40 20 0 1 13 257 19 313 15 279 21 335 17 2911 23 35 Month Offshore Onshore LMPs(Price/MWh)
  • 2. NORTH AMERICAN WINDPOWER • SEPTEMBER 2015 • 7 by operating wind projects in Maine. The Brayton Point node is likely to be a future interconnection point for large offshore projects once the Bray- ton Point power plant retires in 2017; that substation will then be able to accept at least 1,500 MW and deliver it into the ISO-NE transmission grid. Monthly average LMPs for the two nodes over the three-year period from 2012 to 2014 are illustrated in Figure 2. The LMP spikes from January to Feb- ruary 2013 and from December 2013 to March 2014 reflect high gas and oil prices during cold weather periods. Market energy prices are typically higher when a project is close to load centers due to lower losses and less transmission congestion. The Kibby and Brayton Point nodes are no excep- tions. The Brayton Point energy prices averaged about 9% higher than Kibby’s prices. Therefore, an offshore wind project interconnected to the Brayton Point substation (and other locations in southeastern Massachusetts with similar LMPs) would receive slightly higher energy revenues than an on- shore project of equivalent size located in northern Maine (see Figure 3). Capacity market values ISO-NE market rules require new wind generators to provide continued on page 21 Figure 3: Monthly Energy Revenues for Onshore and Offshore Wind Projects (2012-2014) Source: LAI Inc. $7,000,000 $6,000,000 $5,000,000 $4,000,000 $3,000,000 $2,000,000 $1,000,000 $0 1 13 257 19 313 15 279 21 335 17 2911 23 35 Month Offshore Onshore EnergyRevenues Source: LAI Inc. 10 11 12 70 60 50 40 30 20 10 0 1 742 853 96 Month CapacityFactor Offshore Onshore Figure 4: Average Monthly Capacity Factors for Hypothetical Offshore and Onshore Wind Projects (based on 100 MW net capacities)
  • 3. NORTH AMERICAN WINDPOWER • SEPTEMBER 2015 • 21 and 46.3% in the winter. It would receive 31.2 MW of summer capac- ity revenues and 46.3 MW of winter capacity revenues at the southeastern Massachusetts/Rhode Island (SEMA/ RI) zonal price. Figure 4 illustrates the monthly average capacity factors under ISO- NE rules for the two projects and highlights the significant difference between them during summer hours. ISO-NE sets capacity market pric- es for annual capacity commitment periods (from June 1 to May 31) through forward capacity auctions (FCAs). Therefore, capacity revenues for a calendar year are based on the last five months (January through May) of one FCA and the first seven months (June through December) of the following FCA. The FCA re- sults for the relevant years were the administratively determined floor prices and the Maine and SEMA/RI zonal prices were identical, as shown in Table 1, and are not proper indica- tors now that ISO-NE has adopted changes to how FCAs are tabulated. The capacity revenues for the two wind projects were calculated based on their respective capacity values and the ISO-NE capacity prices for the calendar years 2012 through 2014, as illustrated in Figure 5. The higher capacity value for the offshore wind project would have provided an ex- tra $28,100 per month. Moreover, the most recent auction, FCA 9 for 2018 through 2019, resulted in much high- er prices, particularly for the SEMA/ RI zone, which would magnify the capacity market value advantage for future offshore wind projects. Other considerations There are a number of financial, environmental and other factors that should be considered in any policy (and investment) decisions regarding onshore and offshore wind projects. First and foremost are the signifi- cant capital cost and operations and maintenance cost differences between onshore and offshore projects that reflect different design, access, equip- ment and construction methods. The net result of the power market rev- enue and project cost differences are manifested in renewable energy certif- icate (REC) and offshore REC prices. Air emissions considerations are also important for policymakers – neither wind technology emits carbon or oth- er air pollutants, nor requires water for cooling or for emissions control, “… measured and recorded site- specific summer and winter data …” during intermittent reliability hours to support a claimed qualified ca- pacity and receive capacity market revenues. Summer intermittent re- liability hours are 1 p.m. to 6 p.m. in June; September and winter inter- mittent reliability hours are 5 p.m. to 7 p.m. from October through May. ISO-NE also counts hours in which it experiences shortage events, but those events were ignored for the purpose of this paper. Based on the NREL da- ta, the following capacity values were calculated: ■ The hypothetical onshore wind project would have capacity values of 19.0% in the summer and 38.6% in the winter. Based on 100 MW, it would receive 19.0 MW of summer capacity revenues and 38.6 MW of winter capacity revenues at the Frank- lin County zonal price. ■ The hypothetical offshore wind project would have much higher ca- pacity values of 31.2% in the summer continued from page 7 Industry At Large: Power Markets Table 1: ISO-NE Wholesale Capacity Prices (Price Per kW/Month) Wind Project FCA Zone 2011-12 (FCA 2) 2012-13 (FCA 3) 2013-14 (FCA 4) 2014-15 (FCA 5) Onshore ME $3.60 $2.95 $2.951 $3.209 Offshore SEMA/RI $3.60 $2.95 $2.951 $3.209 Source: LAI Inc.
  • 4. 22 • SEPTEMBER 2015 • NORTH AMERICAN WINDPOWER WEB INDEX AMG - RD mize visual impact, but eliminating impact completely may not be pos- sible. Eventually, offshore projects may be able to utilize floating wind turbine technology that would enable them to be built in deeper waters far- ther offshore. Transmission lines. Onshore proj- ects often require new or upgraded transmission lines to interconnect them to the existing grid, and offshore projects typically utilize underwater cables to interconnect them to coastal substations. So, both technologies may require system upgrades to ac- commodate the wind energy without triggering reliability violations. However, offshore wind is typically closer to load centers and may reduce overall transmission costs and losses for the region in the long run. which is a consideration in regions with limited water resources. How- ever, there are many other important considerations: Footprint. Although the individu- al footprint of an onshore or offshore turbine is relatively small, the area covered by the wind farm is much larger because the turbines have to be spaced far enough from each other to minimize interference of the wind wake. Siting. Though builders of off- shore wind projects can minimize sit- ing issues by building them in federal waters and situating them more than three miles from shore, there may be opposition from local residents or other stakeholders. Visual impact. Onshore and off- shore projects can be sited to mini- Industry At Large: Power Markets Acoustic impacts. Onshore proj- ects that are located in remote areas may not avoid noise issues; projects situated closer to populated areas may have problems, despite the background noise to mask their sounds. Sounds generated by offshore wind farms should not be problematic given the distance to population centers. Supply chain. Due to the large onshore wind market, turbine man- ufacturers have invested heavily in domestic manufacturing capability. Offshore turbines will likely be im- ported until manufacturers have a reasonably steady domestic demand. Offshore wind is very conducive to building a local industry, how- ever, given size and transportation considerations. Avian and marine life. There have been instances of migratory bird mortalities from onshore and off- shore projects, as well as harm dur- ing construction. Offshore projects may also have both negative and posi- tive marine wildlife impacts, such as small protected zones around their bases. w Seth Parker is vice president and prin- cipal of Levitan & Associates (LAI). Dr. Angeliki Rigos is an executive con- sultant at LAI and an associate profes- sor at Merrimack College. They are part of the LAI team implementing Maryland’s Offshore Wind Energy Act of 2013 for the Public Service Com- mission. They can be reached at sgp123@lai.com and dar@levitan. com, respectively. Figure 5: Monthly Capacity Revenues for Hypothetical Offshore and Onshore Wind Projects (2012-2014) Source: LAI Inc. 180,000 160,000 140,000 120,000 100,000 80,000 60,000 40,000 20,000 0 1 13 257 19 313 15 279 21 335 17 2911 23 35 Month Offshore Onshore CapacityRevenues Figure 6: Energy and Capacity Revenues for Hypothetical Onshore and Offshore Wind Projects (2012-2014) Source: LAI Inc. $30,000,000 $25,000,000 $20,000,000 $15,000,000 $10,000,000 $5,000,000 $0 Offshore 2012 Onshore Offshore 2013 Onshore Offshore 2014 Onshore ■ Capacity Revenues ■ Energy Revenues TotalRevenues