SlideShare a Scribd company logo
1 of 6
Annexure:
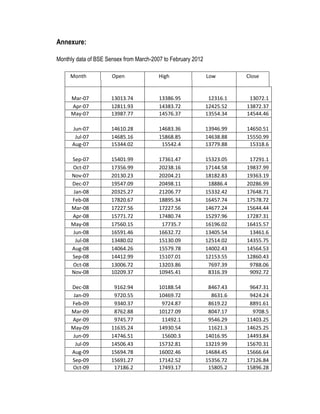
Monthly data of BSE Sensex from March-2007 to February 2012
Month Open High Low Close
Mar-07 13013.74 13386.95 12316.1 13072.1
Apr-07 12811.93 14383.72 12425.52 13872.37
May-07 13987.77 14576.37 13554.34 14544.46
Jun-07 14610.28 14683.36 13946.99 14650.51
Jul-07 14685.16 15868.85 14638.88 15550.99
Aug-07 15344.02 15542.4 13779.88 15318.6
Sep-07 15401.99 17361.47 15323.05 17291.1
Oct-07 17356.99 20238.16 17144.58 19837.99
Nov-07 20130.23 20204.21 18182.83 19363.19
Dec-07 19547.09 20498.11 18886.4 20286.99
Jan-08 20325.27 21206.77 15332.42 17648.71
Feb-08 17820.67 18895.34 16457.74 17578.72
Mar-08 17227.56 17227.56 14677.24 15644.44
Apr-08 15771.72 17480.74 15297.96 17287.31
May-08 17560.15 17735.7 16196.02 16415.57
Jun-08 16591.46 16632.72 13405.54 13461.6
Jul-08 13480.02 15130.09 12514.02 14355.75
Aug-08 14064.26 15579.78 14002.43 14564.53
Sep-08 14412.99 15107.01 12153.55 12860.43
Oct-08 13006.72 13203.86 7697.39 9788.06
Nov-08 10209.37 10945.41 8316.39 9092.72
Dec-08 9162.94 10188.54 8467.43 9647.31
Jan-09 9720.55 10469.72 8631.6 9424.24
Feb-09 9340.37 9724.87 8619.22 8891.61
Mar-09 8762.88 10127.09 8047.17 9708.5
Apr-09 9745.77 11492.1 9546.29 11403.25
May-09 11635.24 14930.54 11621.3 14625.25
Jun-09 14746.51 15600.3 14016.95 14493.84
Jul-09 14506.43 15732.81 13219.99 15670.31
Aug-09 15694.78 16002.46 14684.45 15666.64
Sep-09 15691.27 17142.52 15356.72 17126.84
Oct-09 17186.2 17493.17 15805.2 15896.28
Nov-09 15838.63 17290.48 15330.56 16926.22
Dec-09 16947.46 17530.94 16577.78 17464.81
Jan-10 17473.45 17790.33 15982.08 16357.96
Feb-10 16339.32 16669.25 15651.99 16429.55
Mar-10 16438.45 17793.01 16438.45 17527.77
Apr-10 17555.04 18047.86 17276.8 17558.71
May-10 17536.86 17536.86 15960.15 16944.63
Jun-10 16942.82 17919.62 16318.39 17700.9
Jul-10 17679.34 18237.56 17395.58 17868.29
Aug-10 17911.31 18475.27 17819.99 17971.12
Sep-10 18027.12 20267.98 18027.12 20069.12
Oct-10 20094.1 20854.55 19768.96 20032.34
Nov-10 20272.49 21108.64 18954.82 19521.25
Dec-10 19529.99 20552.03 19074.57 20509.09
Jan-11 20621.61 20664.8 18038.48 18327.76
Feb-11 18425.18 18690.97 17295.62 17823.4
Mar-11 17982.28 19575.16 17792.17 19445.22
Apr-11 19463.11 19811.14 18976.19 19135.96
May-11 19224.05 19253.87 17786.13 18503.28
Jun-11 18527.12 18873.39 17314.38 18845.87
Jul-11 18974.96 19131.7 18131.86 18197.2
Aug-11 18352.23 18440.07 15765.53 16676.75
Sep-11 16963.67 17211.8 15801.01 16453.76
Oct-11 16255.97 17908.13 15745.43 17705.01
Nov-11 17540.55 17702.26 15478.69 16123.46
Dec-11 16555.93 17003.71 15135.86 15454.92
Jan-12 15534.67 17258.97 15358.02 17193.55
Feb-12 17179.64 18523.78 17061.55 17752.68
Monthly data of S&P CNX NIFTY from March-2007 to February 2012
Date Open High Low Close
30-Mar-07 3788.85 3832.2 3785.3 3821.55
30-Apr-07 4081.6 4096.9 4028.9 4087.9
31-May-07 4250.25 4306.75 4250.25 4295.8
29-Jun-07 4282.4 4321.35 4280.95 4318.3
31-Jul-07 4444.25 4534.2 4432.85 4528.85
31-Aug-07 4412.6 4471.3 4403 4464
28-Sep-07 4996.45 5055.8 4996.45 5021.35
31-Oct-07 5868.9 5952.25 5861.3 5900.65
30-Nov-07 5633.9 5782.55 5632.65 5762.75
31-Dec-07 6095 6167.75 6095 6138.6
31-Jan-08 5172.25 5251.65 5071.15 5137.45
29-Feb-08 5285 5290.8 5098.35 5223.5
31-Mar-08 4942.15 4947 4703.85 4734.5
30-Apr-08 5198.35 5230.75 5155.85 5165.9
30-May-08 4844.05 4908.85 4833.45 4870.1
30-Jun-08 4136.25 4163 4021.7 4040.55
31-Jul-08 4314.35 4342 4285.55 4332.95
29-Aug-08 4230.6 4368.8 4230.6 4360
30-Sep-08 3848.7 3966.85 3715.05 3921.2
31-Oct-08 2696.3 2921.35 2696.3 2885.6
28-Nov-08 2745.7 2779 2690.3 2755.1
31-Dec-08 2979.8 3002.65 2937.35 2959.15
30-Jan-09 2824.05 2881 2774.1 2874.8
27-Feb-09 2785.7 2787.2 2708.45 2763.65
31-Mar-09 2981.7 3054.3 2966.4 3020.95
29-Apr-09 3371.65 3486.4 3366.7 3473.95
29-May-09 4340.75 4488.05 4340.75 4448.95
30-Jun-09 4391.5 4426.75 4267.35 4291.1
31-Jul-09 4571.6 4669.75 4571.6 4636.45
31-Aug-09 4730.85 4730.85 4635 4662.1
30-Sep-09 5007.65 5087.6 5004.35 5083.95
30-Oct-09 4751.1 4853.65 4687.5 4711.7
30-Nov-09 4942.25 5066.35 4942.25 5032.7
31-Dec-09 5171.2 5221.85 5168.75 5201.05
29-Jan-10 4866.15 4893.7 4766 4882.05
26-Feb-10 4858.5 4992 4858.45 4922.3
31-Mar-10 5260.4 5293.9 5235.15 5249.1
30-Apr-10 5254.2 5294.8 5254.2 5278
31-May-10 5076.1 5097.6 5038.55 5086.3
30-Jun-10 5254.25 5320.35 5210 5312.5
30-Jul-10 5408.4 5413.25 5349.2 5367.6
31-Aug-10 5413.55 5413.9 5348.9 5402.4
30-Sep-10 5991.35 6048.45 5963.6 6029.95
29-Oct-10 6021.15 6032.65 5937.1 6017.7
30-Nov-10 5811.6 5892.25 5768.35 5862.7
31-Dec-10 6105.1 6147.3 6103.55 6134.5
31-Jan-11 5452.55 5526.85 5416.65 5505.9
28-Feb-11 5330.15 5477 5308.6 5333.25
31-Mar-11 5803.05 5872 5778.65 5833.75
29-Apr-11 5782.5 5804.3 5706.05 5749.5
31-May-11 5492 5571.6 5489.7 5560.15
30-Jun-11 5614.5 5657.9 5606.1 5647.4
29-Jul-11 5479 5520.3 5453.95 5482
30-Aug-11 4973.25 5016.25 4927.55 5001
30-Sep-11 4990.15 5025.55 4924.3 4943.25
31-Oct-11 5358.9 5360.25 5314.6 5326.6
30-Nov-11 4766.15 4851.55 4754.8 4832.05
30-Dec-11 4659.95 4690.45 4608.9 4624.3
31-Jan-12 5125.25 5215.4 5120.15 5199.25
29-Feb-12 5424.95 5458.8 5352.25 5385.2
Monthly data of Foreign Institutional Investments from March-2007 to February 2012
Date Equity Debt Total
30-Mar-07 -1,082.00 1,442.60 360.6
30-Apr-07 6,679.20 1,042.30 7,721.50
31-May-07 3,959.70 1,360.10 5,319.80
29-Jun-07 1,643.10 -541.4 1,101.70
31-Jul-07 23,872.40 -1,263.00 22,609.40
31-Aug-07 -7,770.50 608.4 -7,162.10
28-Sep-07 16,132.60 2,655.80 18,788.40
31-Oct-07 20,590.90 2,499.50 23,090.40
30-Nov-07 -5,849.90 -469.3 -6,319.20
31-Dec-07 5,579.10 3,312.00 8,891.10
31-Jan-08 -13,035.70 1,953.80 -11,081.90
29-Feb-08 1,733.30 2,496.80 4,230.10
31-Mar-08 -130.4 -879.7 -1,010.10
30-Apr-08 1,074.80 -1,701.70 -626.9
30-May-08 -5,011.50 -162.9 -5,174.40
30-Jun-08 -10,095.80 -998.7 -11,094.50
31-Jul-08 -1,836.80 3,618.90 1,782.10
29-Aug-08 -1,211.70 1,257.80 46.1
30-Sep-08 -8,278.10 3,204.20 -5,073.90
31-Oct-08 -15,347.30 -1,858.10 -17,205.40
28-Nov-08 -2,598.30 4,215.00 1,616.70
31-Dec-08 1,750.10 626.5 2,376.60
30-Jan-09 -4,245.30 802.3 -3,443.00
27-Feb-09 -2,436.60 -687.8 -3,124.40
31-Mar-09 530.3 -6,420.30 -5,890.00
29-Apr-09 6,508.20 2,490.30 8,998.50
29-May-09 20,117.20 -2,711.40 17,405.80
30-Jun-09 3,830.00 1,068.30 4,898.30
31-Jul-09 11,066.30 2,115.40 13,181.70
31-Aug-09 4,902.70 -379.4 4,523.30
30-Sep-09 18,344.30 2,228.40 20,572.70
30-Oct-09 9,077.00 6,895.60 15,972.60
30-Nov-09 5,497.00 684.4 6,181.40
31-Dec-09 10,233.10 -1,522.40 8,710.70
29-Jan-10 -500.3 8,912.90 8,412.60
26-Feb-10 1,216.90 3,146.10 4,363.00
31-Mar-10 19,928.00 9,509.50 29,437.50
30-Apr-10 9,361.30 3,031.80 12,393.10
31-May-10 -9,436.70 2,450.60 -6,986.10
30-Jun-10 10,508.40 740.7 11,249.10
30-Jul-10 16,617.40 8,106.60 24,724.00
31-Aug-10 11,687.20 2,999.10 14,686.30
30-Sep-10 24,978.50 7,689.50 32,668.00
29-Oct-10 28,562.90 -4,260.30 24,302.60
30-Nov-10 18,293.10 2,917.60 21,210.70
31-Dec-10 2,049.60 1,164.20 3,213.80
31-Jan-11 -4813.2 10176.7 5363.5
28-Feb-11 -4,585.50 1,315.70 -3,269.80
31-Mar-11 6,897.80 -14.9 6,882.90
29-Apr-11 7,213.30 -17.2 7,196.10
31-May-11 -6,614.40 2,338.40 -4,276.00
30-Jun-11 4,572.20 311.1 4,883.30
29-Jul-11 8,030.10 2,622.80 10,652.90
30-Aug-11 -10,833.60 2,931.10 -7,902.50
30-Sep-11 -158.3 -1,707.40 -1,865.70
31-Oct-11 1,677.40 1,401.40 3,078.80
30-Nov-11 -4,197.90 934.7 -3,263.20
30-Dec-11 97.9 21,774.60 21,872.50
31-Jan-12 10,357.70 15,971.20 26,328.90
29-Feb-12 25,212.10 10,015.80 35,227.90

More Related Content

What's hot

Angelina RiverExercise FINAL
Angelina RiverExercise FINALAngelina RiverExercise FINAL
Angelina RiverExercise FINAL
JENNIFER FRANCO
 
Purchasing Managers' Index
Purchasing Managers' IndexPurchasing Managers' Index
Purchasing Managers' Index
Swedbank
 
Energy & Commodities
Energy & CommoditiesEnergy & Commodities
Energy & Commodities
Swedbank
 
Stock Indicies
Stock IndiciesStock Indicies
Stock Indicies
ukabuka
 

What's hot (12)

Angelina RiverExercise FINAL
Angelina RiverExercise FINALAngelina RiverExercise FINAL
Angelina RiverExercise FINAL
 
FHC BUDGET BAUSTRIAP 2017
FHC BUDGET BAUSTRIAP 2017FHC BUDGET BAUSTRIAP 2017
FHC BUDGET BAUSTRIAP 2017
 
Tillage and nitrogen rates influenced soil chemical properties
Tillage and nitrogen rates influenced soil chemical propertiesTillage and nitrogen rates influenced soil chemical properties
Tillage and nitrogen rates influenced soil chemical properties
 
The Woodlands Real Estate Home Sales Report - August/September 2014
The Woodlands Real Estate Home Sales Report - August/September 2014The Woodlands Real Estate Home Sales Report - August/September 2014
The Woodlands Real Estate Home Sales Report - August/September 2014
 
Calendar 2011 illustration
Calendar 2011 illustrationCalendar 2011 illustration
Calendar 2011 illustration
 
Ch 5 final seas factors
Ch 5 final seas factorsCh 5 final seas factors
Ch 5 final seas factors
 
Purchasing Managers' Index
Purchasing Managers' IndexPurchasing Managers' Index
Purchasing Managers' Index
 
Energy & Commodities
Energy & CommoditiesEnergy & Commodities
Energy & Commodities
 
12_S_Curve_Aug-14_HO
12_S_Curve_Aug-14_HO12_S_Curve_Aug-14_HO
12_S_Curve_Aug-14_HO
 
Stock Indicies
Stock IndiciesStock Indicies
Stock Indicies
 
Embarkasi surabaya
Embarkasi surabayaEmbarkasi surabaya
Embarkasi surabaya
 
BOR COVID-19 8 Agustus 2021
BOR COVID-19 8 Agustus 2021BOR COVID-19 8 Agustus 2021
BOR COVID-19 8 Agustus 2021
 

Viewers also liked (7)

Body
BodyBody
Body
 
2 chap
2 chap2 chap
2 chap
 
Fii
FiiFii
Fii
 
Certificates
CertificatesCertificates
Certificates
 
A study on ratio analysis at vst tillers tractors final
A study on ratio analysis at vst tillers tractors finalA study on ratio analysis at vst tillers tractors final
A study on ratio analysis at vst tillers tractors final
 
An Organisational study at TUMUL, Tumkur, Karnataka
An Organisational study at TUMUL, Tumkur, KarnatakaAn Organisational study at TUMUL, Tumkur, Karnataka
An Organisational study at TUMUL, Tumkur, Karnataka
 
Lesson guide gr. 3 chapter i -division v1.0
Lesson guide   gr. 3 chapter i -division v1.0Lesson guide   gr. 3 chapter i -division v1.0
Lesson guide gr. 3 chapter i -division v1.0
 

Similar to Annexure

Laporan Oktober 2010
Laporan Oktober 2010Laporan Oktober 2010
Laporan Oktober 2010
hilman shodri
 
Bekasi asri pemula tbk
Bekasi asri pemula tbkBekasi asri pemula tbk
Bekasi asri pemula tbk
Arga1693
 
PPF_7800_underlying_data
PPF_7800_underlying_dataPPF_7800_underlying_data
PPF_7800_underlying_data
Karan Dewan
 
The Woodlands Home Sales Report November/December 2014
The Woodlands Home Sales Report November/December 2014The Woodlands Home Sales Report November/December 2014
The Woodlands Home Sales Report November/December 2014
Ken Brand
 
MonthMonthly Returns ()MonthMonthly Returns ()MonthMonth.pdf
MonthMonthly Returns ()MonthMonthly Returns ()MonthMonth.pdfMonthMonthly Returns ()MonthMonthly Returns ()MonthMonth.pdf
MonthMonthly Returns ()MonthMonthly Returns ()MonthMonth.pdf
mckenziecast21211
 
Table 17 rate of growth (% yoy) gdp and its component at current prices
Table 17 rate of growth (% yoy) gdp and its component at current pricesTable 17 rate of growth (% yoy) gdp and its component at current prices
Table 17 rate of growth (% yoy) gdp and its component at current prices
Padma Natarajan
 

Similar to Annexure (20)

EmployeeGoalSetting
EmployeeGoalSettingEmployeeGoalSetting
EmployeeGoalSetting
 
Laporan Oktober 2010
Laporan Oktober 2010Laporan Oktober 2010
Laporan Oktober 2010
 
Nps list
Nps listNps list
Nps list
 
Magnolia Market Report July 2015
Magnolia Market Report July 2015Magnolia Market Report July 2015
Magnolia Market Report July 2015
 
Bekasi asri pemula tbk
Bekasi asri pemula tbkBekasi asri pemula tbk
Bekasi asri pemula tbk
 
PPF_7800_underlying_data
PPF_7800_underlying_dataPPF_7800_underlying_data
PPF_7800_underlying_data
 
Magnolia 77354 Home Sales Report June 2016
Magnolia 77354 Home Sales Report June 2016Magnolia 77354 Home Sales Report June 2016
Magnolia 77354 Home Sales Report June 2016
 
The woodlands august september market reports 2014
The woodlands august september market reports 2014The woodlands august september market reports 2014
The woodlands august september market reports 2014
 
February 2016 Real Estate Market Report for The Woodlands, Texas
February 2016 Real Estate Market Report for The Woodlands, TexasFebruary 2016 Real Estate Market Report for The Woodlands, Texas
February 2016 Real Estate Market Report for The Woodlands, Texas
 
June 2015 - General Overview
June 2015 - General Overview June 2015 - General Overview
June 2015 - General Overview
 
The Woodlands Home Sales Report November/December 2014
The Woodlands Home Sales Report November/December 2014The Woodlands Home Sales Report November/December 2014
The Woodlands Home Sales Report November/December 2014
 
Spring (77386) Home Sales Report - October 2015
Spring (77386) Home Sales Report - October 2015Spring (77386) Home Sales Report - October 2015
Spring (77386) Home Sales Report - October 2015
 
Data calculation of_thesis_2011
Data calculation of_thesis_2011Data calculation of_thesis_2011
Data calculation of_thesis_2011
 
April 2016 Real Estate Market Report, The Woodlands, TX
April 2016 Real Estate Market Report, The Woodlands, TX April 2016 Real Estate Market Report, The Woodlands, TX
April 2016 Real Estate Market Report, The Woodlands, TX
 
August 2015 - Market snapshot - General Overview
August 2015 - Market snapshot - General OverviewAugust 2015 - Market snapshot - General Overview
August 2015 - Market snapshot - General Overview
 
July 2015 - Market Snapshot - General Overview
July 2015  - Market Snapshot - General OverviewJuly 2015  - Market Snapshot - General Overview
July 2015 - Market Snapshot - General Overview
 
MonthMonthly Returns ()MonthMonthly Returns ()MonthMonth.pdf
MonthMonthly Returns ()MonthMonthly Returns ()MonthMonth.pdfMonthMonthly Returns ()MonthMonthly Returns ()MonthMonth.pdf
MonthMonthly Returns ()MonthMonthly Returns ()MonthMonth.pdf
 
Table 17 rate of growth (% yoy) gdp and its component at current prices
Table 17 rate of growth (% yoy) gdp and its component at current pricesTable 17 rate of growth (% yoy) gdp and its component at current prices
Table 17 rate of growth (% yoy) gdp and its component at current prices
 
March 2015 Magnolia 77354 Home Sales Report
March 2015 Magnolia 77354 Home Sales ReportMarch 2015 Magnolia 77354 Home Sales Report
March 2015 Magnolia 77354 Home Sales Report
 
Purchasing Managers' Index, 2010 March
Purchasing Managers' Index, 2010 MarchPurchasing Managers' Index, 2010 March
Purchasing Managers' Index, 2010 March
 

More from Anantha Bellary (20)

Chapter titles
Chapter titlesChapter titles
Chapter titles
 
Bibliography
BibliographyBibliography
Bibliography
 
Abstract
AbstractAbstract
Abstract
 
Table of content
Table of contentTable of content
Table of content
 
21 chap
21 chap21 chap
21 chap
 
20 chap
20 chap20 chap
20 chap
 
19 chap
19 chap19 chap
19 chap
 
18 chap
18 chap18 chap
18 chap
 
17 chap
17 chap17 chap
17 chap
 
16 chap
16 chap16 chap
16 chap
 
14 chap
14 chap14 chap
14 chap
 
13 chap
13 chap13 chap
13 chap
 
12 chap
12 chap12 chap
12 chap
 
11 chap
11 chap11 chap
11 chap
 
10 chap
10 chap10 chap
10 chap
 
9 chap
9 chap9 chap
9 chap
 
8 chap
8 chap8 chap
8 chap
 
7 chap
7 chap7 chap
7 chap
 
6 chap
6 chap6 chap
6 chap
 
5 chap
5 chap5 chap
5 chap
 

Recently uploaded

Artificial Intelligence: Facts and Myths
Artificial Intelligence: Facts and MythsArtificial Intelligence: Facts and Myths
Artificial Intelligence: Facts and Myths
Joaquim Jorge
 
Histor y of HAM Radio presentation slide
Histor y of HAM Radio presentation slideHistor y of HAM Radio presentation slide
Histor y of HAM Radio presentation slide
vu2urc
 

Recently uploaded (20)

Boost Fertility New Invention Ups Success Rates.pdf
Boost Fertility New Invention Ups Success Rates.pdfBoost Fertility New Invention Ups Success Rates.pdf
Boost Fertility New Invention Ups Success Rates.pdf
 
Strategize a Smooth Tenant-to-tenant Migration and Copilot Takeoff
Strategize a Smooth Tenant-to-tenant Migration and Copilot TakeoffStrategize a Smooth Tenant-to-tenant Migration and Copilot Takeoff
Strategize a Smooth Tenant-to-tenant Migration and Copilot Takeoff
 
Driving Behavioral Change for Information Management through Data-Driven Gree...
Driving Behavioral Change for Information Management through Data-Driven Gree...Driving Behavioral Change for Information Management through Data-Driven Gree...
Driving Behavioral Change for Information Management through Data-Driven Gree...
 
🐬 The future of MySQL is Postgres 🐘
🐬  The future of MySQL is Postgres   🐘🐬  The future of MySQL is Postgres   🐘
🐬 The future of MySQL is Postgres 🐘
 
Artificial Intelligence: Facts and Myths
Artificial Intelligence: Facts and MythsArtificial Intelligence: Facts and Myths
Artificial Intelligence: Facts and Myths
 
What Are The Drone Anti-jamming Systems Technology?
What Are The Drone Anti-jamming Systems Technology?What Are The Drone Anti-jamming Systems Technology?
What Are The Drone Anti-jamming Systems Technology?
 
Boost PC performance: How more available memory can improve productivity
Boost PC performance: How more available memory can improve productivityBoost PC performance: How more available memory can improve productivity
Boost PC performance: How more available memory can improve productivity
 
2024: Domino Containers - The Next Step. News from the Domino Container commu...
2024: Domino Containers - The Next Step. News from the Domino Container commu...2024: Domino Containers - The Next Step. News from the Domino Container commu...
2024: Domino Containers - The Next Step. News from the Domino Container commu...
 
Finology Group – Insurtech Innovation Award 2024
Finology Group – Insurtech Innovation Award 2024Finology Group – Insurtech Innovation Award 2024
Finology Group – Insurtech Innovation Award 2024
 
Powerful Google developer tools for immediate impact! (2023-24 C)
Powerful Google developer tools for immediate impact! (2023-24 C)Powerful Google developer tools for immediate impact! (2023-24 C)
Powerful Google developer tools for immediate impact! (2023-24 C)
 
TrustArc Webinar - Stay Ahead of US State Data Privacy Law Developments
TrustArc Webinar - Stay Ahead of US State Data Privacy Law DevelopmentsTrustArc Webinar - Stay Ahead of US State Data Privacy Law Developments
TrustArc Webinar - Stay Ahead of US State Data Privacy Law Developments
 
Histor y of HAM Radio presentation slide
Histor y of HAM Radio presentation slideHistor y of HAM Radio presentation slide
Histor y of HAM Radio presentation slide
 
Strategies for Landing an Oracle DBA Job as a Fresher
Strategies for Landing an Oracle DBA Job as a FresherStrategies for Landing an Oracle DBA Job as a Fresher
Strategies for Landing an Oracle DBA Job as a Fresher
 
Data Cloud, More than a CDP by Matt Robison
Data Cloud, More than a CDP by Matt RobisonData Cloud, More than a CDP by Matt Robison
Data Cloud, More than a CDP by Matt Robison
 
Apidays Singapore 2024 - Building Digital Trust in a Digital Economy by Veron...
Apidays Singapore 2024 - Building Digital Trust in a Digital Economy by Veron...Apidays Singapore 2024 - Building Digital Trust in a Digital Economy by Veron...
Apidays Singapore 2024 - Building Digital Trust in a Digital Economy by Veron...
 
Exploring the Future Potential of AI-Enabled Smartphone Processors
Exploring the Future Potential of AI-Enabled Smartphone ProcessorsExploring the Future Potential of AI-Enabled Smartphone Processors
Exploring the Future Potential of AI-Enabled Smartphone Processors
 
HTML Injection Attacks: Impact and Mitigation Strategies
HTML Injection Attacks: Impact and Mitigation StrategiesHTML Injection Attacks: Impact and Mitigation Strategies
HTML Injection Attacks: Impact and Mitigation Strategies
 
A Year of the Servo Reboot: Where Are We Now?
A Year of the Servo Reboot: Where Are We Now?A Year of the Servo Reboot: Where Are We Now?
A Year of the Servo Reboot: Where Are We Now?
 
Tata AIG General Insurance Company - Insurer Innovation Award 2024
Tata AIG General Insurance Company - Insurer Innovation Award 2024Tata AIG General Insurance Company - Insurer Innovation Award 2024
Tata AIG General Insurance Company - Insurer Innovation Award 2024
 
Handwritten Text Recognition for manuscripts and early printed texts
Handwritten Text Recognition for manuscripts and early printed textsHandwritten Text Recognition for manuscripts and early printed texts
Handwritten Text Recognition for manuscripts and early printed texts
 

Annexure

  • 1. Annexure: Monthly data of BSE Sensex from March-2007 to February 2012 Month Open High Low Close Mar-07 13013.74 13386.95 12316.1 13072.1 Apr-07 12811.93 14383.72 12425.52 13872.37 May-07 13987.77 14576.37 13554.34 14544.46 Jun-07 14610.28 14683.36 13946.99 14650.51 Jul-07 14685.16 15868.85 14638.88 15550.99 Aug-07 15344.02 15542.4 13779.88 15318.6 Sep-07 15401.99 17361.47 15323.05 17291.1 Oct-07 17356.99 20238.16 17144.58 19837.99 Nov-07 20130.23 20204.21 18182.83 19363.19 Dec-07 19547.09 20498.11 18886.4 20286.99 Jan-08 20325.27 21206.77 15332.42 17648.71 Feb-08 17820.67 18895.34 16457.74 17578.72 Mar-08 17227.56 17227.56 14677.24 15644.44 Apr-08 15771.72 17480.74 15297.96 17287.31 May-08 17560.15 17735.7 16196.02 16415.57 Jun-08 16591.46 16632.72 13405.54 13461.6 Jul-08 13480.02 15130.09 12514.02 14355.75 Aug-08 14064.26 15579.78 14002.43 14564.53 Sep-08 14412.99 15107.01 12153.55 12860.43 Oct-08 13006.72 13203.86 7697.39 9788.06 Nov-08 10209.37 10945.41 8316.39 9092.72 Dec-08 9162.94 10188.54 8467.43 9647.31 Jan-09 9720.55 10469.72 8631.6 9424.24 Feb-09 9340.37 9724.87 8619.22 8891.61 Mar-09 8762.88 10127.09 8047.17 9708.5 Apr-09 9745.77 11492.1 9546.29 11403.25 May-09 11635.24 14930.54 11621.3 14625.25 Jun-09 14746.51 15600.3 14016.95 14493.84 Jul-09 14506.43 15732.81 13219.99 15670.31 Aug-09 15694.78 16002.46 14684.45 15666.64 Sep-09 15691.27 17142.52 15356.72 17126.84 Oct-09 17186.2 17493.17 15805.2 15896.28
  • 2. Nov-09 15838.63 17290.48 15330.56 16926.22 Dec-09 16947.46 17530.94 16577.78 17464.81 Jan-10 17473.45 17790.33 15982.08 16357.96 Feb-10 16339.32 16669.25 15651.99 16429.55 Mar-10 16438.45 17793.01 16438.45 17527.77 Apr-10 17555.04 18047.86 17276.8 17558.71 May-10 17536.86 17536.86 15960.15 16944.63 Jun-10 16942.82 17919.62 16318.39 17700.9 Jul-10 17679.34 18237.56 17395.58 17868.29 Aug-10 17911.31 18475.27 17819.99 17971.12 Sep-10 18027.12 20267.98 18027.12 20069.12 Oct-10 20094.1 20854.55 19768.96 20032.34 Nov-10 20272.49 21108.64 18954.82 19521.25 Dec-10 19529.99 20552.03 19074.57 20509.09 Jan-11 20621.61 20664.8 18038.48 18327.76 Feb-11 18425.18 18690.97 17295.62 17823.4 Mar-11 17982.28 19575.16 17792.17 19445.22 Apr-11 19463.11 19811.14 18976.19 19135.96 May-11 19224.05 19253.87 17786.13 18503.28 Jun-11 18527.12 18873.39 17314.38 18845.87 Jul-11 18974.96 19131.7 18131.86 18197.2 Aug-11 18352.23 18440.07 15765.53 16676.75 Sep-11 16963.67 17211.8 15801.01 16453.76 Oct-11 16255.97 17908.13 15745.43 17705.01 Nov-11 17540.55 17702.26 15478.69 16123.46 Dec-11 16555.93 17003.71 15135.86 15454.92 Jan-12 15534.67 17258.97 15358.02 17193.55 Feb-12 17179.64 18523.78 17061.55 17752.68
  • 3. Monthly data of S&P CNX NIFTY from March-2007 to February 2012 Date Open High Low Close 30-Mar-07 3788.85 3832.2 3785.3 3821.55 30-Apr-07 4081.6 4096.9 4028.9 4087.9 31-May-07 4250.25 4306.75 4250.25 4295.8 29-Jun-07 4282.4 4321.35 4280.95 4318.3 31-Jul-07 4444.25 4534.2 4432.85 4528.85 31-Aug-07 4412.6 4471.3 4403 4464 28-Sep-07 4996.45 5055.8 4996.45 5021.35 31-Oct-07 5868.9 5952.25 5861.3 5900.65 30-Nov-07 5633.9 5782.55 5632.65 5762.75 31-Dec-07 6095 6167.75 6095 6138.6 31-Jan-08 5172.25 5251.65 5071.15 5137.45 29-Feb-08 5285 5290.8 5098.35 5223.5 31-Mar-08 4942.15 4947 4703.85 4734.5 30-Apr-08 5198.35 5230.75 5155.85 5165.9 30-May-08 4844.05 4908.85 4833.45 4870.1 30-Jun-08 4136.25 4163 4021.7 4040.55 31-Jul-08 4314.35 4342 4285.55 4332.95 29-Aug-08 4230.6 4368.8 4230.6 4360 30-Sep-08 3848.7 3966.85 3715.05 3921.2 31-Oct-08 2696.3 2921.35 2696.3 2885.6 28-Nov-08 2745.7 2779 2690.3 2755.1 31-Dec-08 2979.8 3002.65 2937.35 2959.15 30-Jan-09 2824.05 2881 2774.1 2874.8 27-Feb-09 2785.7 2787.2 2708.45 2763.65 31-Mar-09 2981.7 3054.3 2966.4 3020.95 29-Apr-09 3371.65 3486.4 3366.7 3473.95 29-May-09 4340.75 4488.05 4340.75 4448.95 30-Jun-09 4391.5 4426.75 4267.35 4291.1 31-Jul-09 4571.6 4669.75 4571.6 4636.45 31-Aug-09 4730.85 4730.85 4635 4662.1 30-Sep-09 5007.65 5087.6 5004.35 5083.95 30-Oct-09 4751.1 4853.65 4687.5 4711.7 30-Nov-09 4942.25 5066.35 4942.25 5032.7 31-Dec-09 5171.2 5221.85 5168.75 5201.05 29-Jan-10 4866.15 4893.7 4766 4882.05
  • 4. 26-Feb-10 4858.5 4992 4858.45 4922.3 31-Mar-10 5260.4 5293.9 5235.15 5249.1 30-Apr-10 5254.2 5294.8 5254.2 5278 31-May-10 5076.1 5097.6 5038.55 5086.3 30-Jun-10 5254.25 5320.35 5210 5312.5 30-Jul-10 5408.4 5413.25 5349.2 5367.6 31-Aug-10 5413.55 5413.9 5348.9 5402.4 30-Sep-10 5991.35 6048.45 5963.6 6029.95 29-Oct-10 6021.15 6032.65 5937.1 6017.7 30-Nov-10 5811.6 5892.25 5768.35 5862.7 31-Dec-10 6105.1 6147.3 6103.55 6134.5 31-Jan-11 5452.55 5526.85 5416.65 5505.9 28-Feb-11 5330.15 5477 5308.6 5333.25 31-Mar-11 5803.05 5872 5778.65 5833.75 29-Apr-11 5782.5 5804.3 5706.05 5749.5 31-May-11 5492 5571.6 5489.7 5560.15 30-Jun-11 5614.5 5657.9 5606.1 5647.4 29-Jul-11 5479 5520.3 5453.95 5482 30-Aug-11 4973.25 5016.25 4927.55 5001 30-Sep-11 4990.15 5025.55 4924.3 4943.25 31-Oct-11 5358.9 5360.25 5314.6 5326.6 30-Nov-11 4766.15 4851.55 4754.8 4832.05 30-Dec-11 4659.95 4690.45 4608.9 4624.3 31-Jan-12 5125.25 5215.4 5120.15 5199.25 29-Feb-12 5424.95 5458.8 5352.25 5385.2
  • 5. Monthly data of Foreign Institutional Investments from March-2007 to February 2012 Date Equity Debt Total 30-Mar-07 -1,082.00 1,442.60 360.6 30-Apr-07 6,679.20 1,042.30 7,721.50 31-May-07 3,959.70 1,360.10 5,319.80 29-Jun-07 1,643.10 -541.4 1,101.70 31-Jul-07 23,872.40 -1,263.00 22,609.40 31-Aug-07 -7,770.50 608.4 -7,162.10 28-Sep-07 16,132.60 2,655.80 18,788.40 31-Oct-07 20,590.90 2,499.50 23,090.40 30-Nov-07 -5,849.90 -469.3 -6,319.20 31-Dec-07 5,579.10 3,312.00 8,891.10 31-Jan-08 -13,035.70 1,953.80 -11,081.90 29-Feb-08 1,733.30 2,496.80 4,230.10 31-Mar-08 -130.4 -879.7 -1,010.10 30-Apr-08 1,074.80 -1,701.70 -626.9 30-May-08 -5,011.50 -162.9 -5,174.40 30-Jun-08 -10,095.80 -998.7 -11,094.50 31-Jul-08 -1,836.80 3,618.90 1,782.10 29-Aug-08 -1,211.70 1,257.80 46.1 30-Sep-08 -8,278.10 3,204.20 -5,073.90 31-Oct-08 -15,347.30 -1,858.10 -17,205.40 28-Nov-08 -2,598.30 4,215.00 1,616.70 31-Dec-08 1,750.10 626.5 2,376.60 30-Jan-09 -4,245.30 802.3 -3,443.00 27-Feb-09 -2,436.60 -687.8 -3,124.40 31-Mar-09 530.3 -6,420.30 -5,890.00 29-Apr-09 6,508.20 2,490.30 8,998.50 29-May-09 20,117.20 -2,711.40 17,405.80 30-Jun-09 3,830.00 1,068.30 4,898.30 31-Jul-09 11,066.30 2,115.40 13,181.70 31-Aug-09 4,902.70 -379.4 4,523.30 30-Sep-09 18,344.30 2,228.40 20,572.70 30-Oct-09 9,077.00 6,895.60 15,972.60 30-Nov-09 5,497.00 684.4 6,181.40 31-Dec-09 10,233.10 -1,522.40 8,710.70 29-Jan-10 -500.3 8,912.90 8,412.60 26-Feb-10 1,216.90 3,146.10 4,363.00 31-Mar-10 19,928.00 9,509.50 29,437.50
  • 6. 30-Apr-10 9,361.30 3,031.80 12,393.10 31-May-10 -9,436.70 2,450.60 -6,986.10 30-Jun-10 10,508.40 740.7 11,249.10 30-Jul-10 16,617.40 8,106.60 24,724.00 31-Aug-10 11,687.20 2,999.10 14,686.30 30-Sep-10 24,978.50 7,689.50 32,668.00 29-Oct-10 28,562.90 -4,260.30 24,302.60 30-Nov-10 18,293.10 2,917.60 21,210.70 31-Dec-10 2,049.60 1,164.20 3,213.80 31-Jan-11 -4813.2 10176.7 5363.5 28-Feb-11 -4,585.50 1,315.70 -3,269.80 31-Mar-11 6,897.80 -14.9 6,882.90 29-Apr-11 7,213.30 -17.2 7,196.10 31-May-11 -6,614.40 2,338.40 -4,276.00 30-Jun-11 4,572.20 311.1 4,883.30 29-Jul-11 8,030.10 2,622.80 10,652.90 30-Aug-11 -10,833.60 2,931.10 -7,902.50 30-Sep-11 -158.3 -1,707.40 -1,865.70 31-Oct-11 1,677.40 1,401.40 3,078.80 30-Nov-11 -4,197.90 934.7 -3,263.20 30-Dec-11 97.9 21,774.60 21,872.50 31-Jan-12 10,357.70 15,971.20 26,328.90 29-Feb-12 25,212.10 10,015.80 35,227.90