
Empfohlen
Weitere ähnliche Inhalte
Was ist angesagt?
Was ist angesagt? (16)
Andere mochten auch
Ähnlich wie Thinking map how to set up an experiment new
Ähnlich wie Thinking map how to set up an experiment new (20)
Mehr von Mrs. Henley
Mehr von Mrs. Henley (20)
Kürzlich hochgeladen
Kürzlich hochgeladen (20)
Thinking map how to set up an experiment new
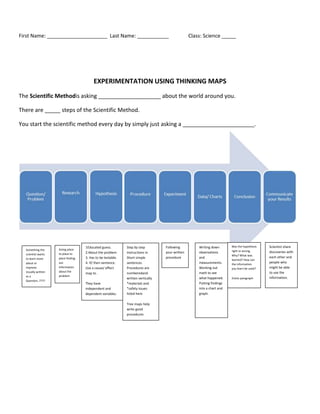
- 1. First Name: _____________________ Last Name: ___________ Class: Science _____ EXPERIMENTATION USING THINKING MAPS The Scientific Methodis asking ____________________ about the world around you. There are _____ steps of the Scientific Method. You start the scientific method every day by simply just asking a _______________________. Something the scientist wants to learn more about or improve. Usually written as a Question..???? Going place to place to place finding out information about the problem. 1Educated guess. 2.About the problem 3. Has to be testable. 4. If/ then sentence. Use a cause/ effect map to . They have independent and dependent variables. Step by step instructions in Short simple sentences. Procedures are numberedand written vertically *materials and *safety issues listed here Tree maps help write good procedures Tree maps help write good procedures Following your written procedure Writing down observations and measurements. Working out math to see what happened. Putting findings into a chart and graph. Was the hypothesis right or wrong. Why? What was learned? How can the information you learn be used? Entire paragraph Scientist share discoveries with each other and people who might be able to use the information.
- 2. To make a good Hypothesis we use the CAUSE AND EFFECT MAP CAUSE SIDE EFFECT SIDE (things you could change) (things you could measure) INDEPENDENT VARIABLES DEPENDENT VARIABLES &CONSTANTS Form a hypothesis: Choose one cause (from the left side of your cause/effect map). All variables not used on the left side are constants and will have to stay the same. Choose one effect (from the right side of your cause/effect map). To create a good hypothesis we take the two chosen squares and make them into an if/then sentence. (Ind. Variable) If ___________________________________________________________________________, (Dependent Variable) then_________________________________________________________________________ The “cause” you chose is your independent variable—the one thing you chose to change The “effect” you chose is your dependent variable—the variable you plan on observing & measuring You may only change 1 thing in an experiment. The other possible variables you listed on the cause side must stay constant! (The problem goes here)
- 3. How to write a good Procedure We use a Tree Map also called a T-chart Problem (written as a Question): _______________________________________ Hypothesis: If ___________________________, then _______________________________________ Group A Group B Independent variable Independent variable 1 constant 1 constant 1 constant 1 constant 1 constant 1 constant 1 constant 1 constant Dependent variable Dependent variable Variable—something that can change in an experiment 3 types of variables 1. Independent variable—the 1 thing a scientist changes in his experiment. There should be a difference in what is written on this line under Group A and Group B. 2. Constant—a variable that does not change. It stays the same throughout the experiment. The constant should match word for word on the left side and right side. A good experiment has no less than 3-5 constants. 3. Dependent variable—this is what the scientist chooses to measure or observe. The results may or may not be the same.
- 4. PROCEDURE We easily convert our T-chart into a well written procedure. A procedure includes a materials section. This lets us know ahead of time what items we need before we start the experiment. The procedure also includes any safety concerns that we should consider before we start the experiment. Materials Neeed: a list of all needed supplies Safety Concerns: 1. Explain the change of the independent variable from the T-chart above. 2. Explain each constant as its own step. 3. Record results 4. Dependent variables are not written into procedures b/c we do not know what the results will be until we have completed the experiment. EXPERIMENT Test your hypothesis by following the steps of your procedure. Collect any data you may need during the experiment and fill in the “dependent variable” section of the T- chart. Convert your data into a chart and graphs which easily illustrate what happened in your experiment Include any photos that may help people understand the experiment better. CONCLUSION Conclusions should be several sentences and form atleast 1 paragraph. Thoughts should include: Was the hypothesis correct or not Explain the data or the results of the experiment Why the information is useful/ helpful Who the information might be useful to How could the experiment have been improved created by : Mrs. Henley Dewey, OK