SlideShare a Scribd company logo
1 of 7
Download to read offline
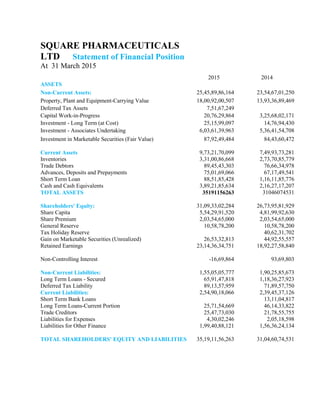
SQUARE PHARMACEUTICALS
LTD Statement of Financial Position
At 31 March 2015
2015 2014
ASSETS
Non-Current Assets: 25,45,89,86,164 23,54,67,01,250
Property, Plant and Equipment-Carrying Value 18,00,92,00,507 13,93,36,89,469
Deferred Tax Assets 7,51,67,249
Capital Work-in-Progress 20,76,29,864 3,25,68,02,171
Investment - Long Term (at Cost) 25,15,99,097 14,76,94,430
Investment - Associates Undertaking 6,03,61,39,963 5,36,41,54,708
Investment in Marketable Securities (Fair Value) 87,92,49,484 84,43,60,472
Current Assets 9,73,21,70,099 7,49,93,73,281
Inventories 3,31,00,86,668 2,73,70,85,779
Trade Debtors 89,45,43,303 76,66,34,978
Advances, Deposits and Prepayments 75,01,69,066 67,17,49,541
Short Term Loan 88,51,85,428 1,16,11,85,776
Cash and Cash Equivalents 3,89,21,85,634 2,16,27,17,207
TOTAL ASSETS 35191156263 31046074531
Shareholders' Equity: 31,09,33,02,284 26,73,95,81,929
Share Capita 5,54,29,91,520 4,81,99,92,630
Share Premium 2,03,54,65,000 2,03,54,65,000
General Reserve 10,58,78,200 10,58,78,200
Tax Holiday Reserve 40,62,31,702
Gain on Marketable Securities (Unrealized) 26,53,32,813 44,92,55,557
Retained Earnings 23,14,36,34,751 18,92,27,58,840
Non-Controlling Interest -16,69,864 93,69,803
Non-Current Liabilities: 1,55,05,05,777 1,90,25,85,673
Long Term Loans - Secured 65,91,47,818 1,18,36,27,923
Deferred Tax Liability 89,13,57,959 71,89,57,750
Current Liabilities: 2,54,90,18,066 2,39,45,37,126
Short Term Bank Loans 13,11,04,817
Long Term Loans-Current Portion 25,71,54,669 46,14,33,822
Trade Creditors 25,47,73,030 21,78,55,755
Liabilities for Expenses 4,30,02,246 2,05,18,598
Liabilities for Other Finance 1,99,40,88,121 1,56,36,24,134
TOTAL SHAREHOLDERS' EQUITY AND LIABILITIES 35,19,11,56,263 31,04,60,74,531
AMOUNT PERCENT
1,91,22,84,914 8.12%
4,07,55,11,038 29.25%
7,51,67,249 0.00%
-3,04,91,72,307 -8.66%
10,39,04,667 0.30%
67,19,85,255 1.91%
3,48,89,012 0.10%
2,23,27,96,818 6.34%
57,30,00,889 1.63%
12,79,08,325 0.36%
7,84,19,525 0.22%
-27,60,00,348 -0.78%
1,72,94,68,427 4.91%
4,14,50,81,732 11.78%
4,35,37,20,355 12.37%
72,29,98,890 2.05%
0 0.00%
0 0.00%
-40,62,31,702 -1.15%
-18,39,22,744 -0.52%
4,22,08,75,911 11.99%
-1,10,39,667 -0.03%
-35,20,79,896 -1.00%
-52,44,80,105 -1.49%
17,24,00,209 0.49%
15,44,80,940 0.44%
-13,11,04,817 -0.37%
-20,42,79,153 -0.58%
3,69,17,275 0.10%
2,24,83,648 0.06%
43,04,63,987 1.22%
4,14,50,81,732 11.78%
Square Pharmaceuticals Ltd. Horizontal
Analysis of Balance Sheet
Amount Percent Amount Percent
25458986164 72.34% 23,54,67,01,250 75.84%
18009200507 51.18% 13,93,36,89,469 44.88%
75167249 0.21% 0 0.00%
207629864 0.59% 3,25,68,02,171 10.49%
25,15,99,097 0.71% 14,76,94,430 0.48%
6,03,61,39,963 17.15% 5,36,41,54,708 17.28%
87,92,49,484 2.50% 84,43,60,472 2.72%
9,73,21,70,099 27.66% 7,49,93,73,281 24.16%
3,31,00,86,668 9.41% 2,73,70,85,779 8.82%
89,45,43,303 2.54% 76,66,34,978 2.47%
75,01,69,066 2.13% 67,17,49,541 2.16%
88,51,85,428 2.52% 1,16,11,85,776 3.74%
3,89,21,85,634 11.06% 2,16,27,17,207 6.97%
35,19,11,56,263 100.00% 31,04,60,74,531 100.00%
31,09,33,02,284 88.36% 26,73,95,81,929 86.13%
5,54,29,91,520 15.75% 4,81,99,92,630 15.53%
2,03,54,65,000 5.78% 2,03,54,65,000 6.56%
10,58,78,200 0.30% 10,58,78,200 0.34%
0.00% 40,62,31,702 1.31%
26,53,32,813 0.75% 44,92,55,557 1.45%
23,14,36,34,751 65.77% 18,92,27,58,840 60.95%
-16,69,864 0.00% 93,69,803 0.03%
1,55,05,05,777 4.41% 1,90,25,85,673 6.13%
65,91,47,818 1.87% 1,18,36,27,923 3.81%
89,13,57,959 2.53% 71,89,57,750 2.32%
2,54,90,18,066 7.24% 2,39,45,37,126 7.71%
0.00% 13,11,04,817 0.42%
25,71,54,669 0.73% 46,14,33,822 1.49%
25,47,73,030 0.72% 21,78,55,755 0.70%
4,30,02,246 0.12% 2,05,18,598 0.07%
1,99,40,88,121 5.67% 1,56,36,24,134 5.04%
35,19,11,56,263 100.00% 31,04,60,74,531 100.00%
Square Pharmaceuticals Ltd. Vertical
Analysis of Balance sheet
2015 2014
Amount Percent
3,88,78,83,691 14.57%
47,17,23,792 1.77%
3,41,61,59,899 12.80%
-1,98,21,31,472 -7.43%
1,43,40,28,427 5.37%
-35,20,70,119 -1.32%
-32,59,00,147 -1.22%
-4,46,87,061 -0.17%
1,85,17,089 0.07%
1,08,19,58,308 4.05%
4,85,96,632 0.18%
1,13,05,54,940 4.24%
-7,93,56,220 -0.30%
1,05,11,98,720 3.94%
-16,10,75,802 -0.60%
-2,94,34,161 -0.11%
7,51,67,249 0.00%
93,58,56,006 3.51%
9,95,75,169 0.37%
1,03,54,31,175 3.88%
0
-31,96,46,077 -1.20%
71,57,85,098 2.68%
1,03,54,31,175 3.88%
1,03,92,51,291 3.89%
-38,20,116 -0.01%
71,57,85,098 2.68%
71,96,05,214 2.70%
-38,20,116 -0.01%
0
2 0.00%
0 0.00%
Square Pharmaceuticals Ltd. Horizontal
Analysis of Income statement
Amount Percent Amount Percent
30,83,35,71,248 115.55% 26,94,56,87,557 115.80%
4,14,89,98,132 15.55% 3,67,72,74,340 15.80%
26,68,45,73,116 100.00% 23,26,84,13,217 100.00%
-14,94,28,70,155 -56.00% -12,96,07,38,683 -55.70%
11,74,17,02,961 44.00% 10,30,76,74,534 44.30%
-4,69,20,91,383 -17.58% -4,34,00,21,264 -18.65%
-3,75,78,38,863 -14.08% -3,43,19,38,716 -14.75%
-77,56,38,213 -2.91% -73,09,51,152 -3.14%
-15,86,14,307 -0.59% -17,71,31,396 -0.76%
7,04,96,11,578 26.42% 5,96,76,53,270 25.65%
29,37,30,506 1.10% 24,51,33,874 1.05%
7,34,33,42,084 27.52% 6,21,27,87,144 26.70%
-37,97,95,062 -1.42% -30,04,38,842 -1.29%
6,96,35,47,022 26.10% 5,91,23,48,302 25.41%
-1,67,98,77,193 -6.30% -1,51,88,01,391 -6.53%
-17,24,00,209 -0.65% -14,29,66,048 -0.61%
7,51,67,249 0.28% 0 0.00%
5,18,64,36,869 19.44% 4,25,05,80,863 18.27%
79,51,99,468 2.98% 69,56,24,299 2.99%
5,98,16,36,337 22.42% 4,94,62,05,162 21.26%
0.00%
-183922744.00 -0.69% 13,57,23,333 0.58%
5,79,77,13,593 21.73% 5,08,19,28,495 21.84%
5,98,16,36,337 22.42% 4,94,62,05,162 21.26%
5,98,38,06,201 22.42% 4,94,45,54,910 21.25%
-21,69,864 -0.01% 16,50,252 0.01%
5,79,77,13,593 21.73% 5,08,19,28,495 21.84%
5,79,98,83,457 21.73% 5,08,02,78,243 21.83%
-21,69,864 -0.01% 16,50,252 0.01%
0.00% 0.00%
11 0.00% 9 0.00%
55,42,99,152 2.08% 55,42,99,152 2.38%
Square Pharmaceuticals Ltd. Vertical
Analysis of Income statement
Square Pharmaceuticals Limited
Ratio Analysis
Liquidity Ratio
Current Ratio
Current Ratio = Current Asset ÷ Current Liability
9,732,170,099 ÷ 2,549,018,066 = 3.818
Quick ratio or acid test Ratio
(Current asset- inventories)/Current liabilities
9732170099- 3,310,086,668 / 2,549,018,066 =2.519
Accounts Receivable Turnover
Net credit sales/Average net Accounts Receivable
26684573116/ 894,543,303+766,634,978 /2 = 17.44 20.65 days
Inventory Turnover
Cost of Goods Sold / Average Inventory
14942870155/3,310,086,668+2,737,085,779 /2 = 4.51 80.93 Days
Profitability Ratio
profit margin
Net Income/Net sales
5186436869/26,684,573,116*100 = 19.45%
Total asset turnover Ratio
Net Sales / Total asset
26,684,573,116/ 35,191,156,263 = 75.83%
Return on asset Ratio
Net Income/Total Assets
5186436869/35,191,156,263= 14.738
total asset turnover Ratio
Net income / Common stockholders “equity
5186436869/31093302284 = 16.7%
Earnings Per Share
Net income /weighted average number of share outstanding
5186436869/4,819,992,630 + 5,542,991,520 /2 = 0.683
Price Earnings Ratio
Market price Per Share of Stock/Earning Per Share
270.3/0.683 = 395.754
payout Ratio
Cash dividend /Net Income
1,445,997,789/5186436869 = 27.88%
Solvency Ratios
Debt to Asset ratio:
Debt/Total Asset
4099523843/35,191,156,263 = 11.65%
Time Interest Earned :
Income before Income taxes and Interest Expense/ Interest Expense
7122161329/158614307 = 44.90 times

More Related Content

What's hot (20)

Indices 26 nov2013063907
Indices 26 nov2013063907Indices 26 nov2013063907
Indices 26 nov2013063907
 
Indices 11 nov2013060256
Indices 11 nov2013060256Indices 11 nov2013060256
Indices 11 nov2013060256
 
Indices 17 Dec 2013
Indices 17 Dec 2013Indices 17 Dec 2013
Indices 17 Dec 2013
 
Indices 05 nov2013055101
Indices 05 nov2013055101Indices 05 nov2013055101
Indices 05 nov2013055101
 
Indices 20 nov2013052438
Indices 20 nov2013052438Indices 20 nov2013052438
Indices 20 nov2013052438
 
65316900 cosechas-bp3
65316900 cosechas-bp365316900 cosechas-bp3
65316900 cosechas-bp3
 
Active duty quotas 2011
Active duty quotas 2011Active duty quotas 2011
Active duty quotas 2011
 
Indices 27 nov2013052236
Indices 27 nov2013052236Indices 27 nov2013052236
Indices 27 nov2013052236
 
Indices 08 nov2013061219
Indices 08 nov2013061219Indices 08 nov2013061219
Indices 08 nov2013061219
 
Indices 12 nov2013062219
Indices 12 nov2013062219Indices 12 nov2013062219
Indices 12 nov2013062219
 
Stainless Steel Tubing
Stainless Steel TubingStainless Steel Tubing
Stainless Steel Tubing
 
Indices 15 oct2013011141
Indices 15 oct2013011141Indices 15 oct2013011141
Indices 15 oct2013011141
 
Te dhena statistikore dhe analiza e tyre.
Te dhena statistikore dhe analiza e tyre.Te dhena statistikore dhe analiza e tyre.
Te dhena statistikore dhe analiza e tyre.
 
FHC P VEGAS M 2017
FHC P VEGAS M 2017FHC P VEGAS M 2017
FHC P VEGAS M 2017
 
Bart Van Looy a Quantitative approach to IP Management Research
Bart Van Looy a Quantitative approach to IP Management ResearchBart Van Looy a Quantitative approach to IP Management Research
Bart Van Looy a Quantitative approach to IP Management Research
 
CorrelationMIDWPV
CorrelationMIDWPVCorrelationMIDWPV
CorrelationMIDWPV
 
Indices 29 nov2013060630
Indices 29 nov2013060630Indices 29 nov2013060630
Indices 29 nov2013060630
 
Weight count chart m.o.
Weight count chart  m.o.Weight count chart  m.o.
Weight count chart m.o.
 
Indices 14 nov2013063015
Indices 14 nov2013063015Indices 14 nov2013063015
Indices 14 nov2013063015
 
Indices 04 dec2013051051
Indices 04 dec2013051051Indices 04 dec2013051051
Indices 04 dec2013051051
 

Similar to Square Pharmaceuticals LTD.

Tabla de comparacion pago de pmg 2020 completa
Tabla de comparacion pago de pmg 2020 completaTabla de comparacion pago de pmg 2020 completa
Tabla de comparacion pago de pmg 2020 completamarcosroa2
 
Résultats élections régionales 20151206
Résultats élections régionales 20151206Résultats élections régionales 20151206
Résultats élections régionales 20151206Grégory MACÉ
 
Escrutinio Defenitivo Elecciones 2011
Escrutinio Defenitivo Elecciones 2011Escrutinio Defenitivo Elecciones 2011
Escrutinio Defenitivo Elecciones 2011Petroleuse_
 
2008 09 thru 2013-2014 istep for sbsc - nov 2014
2008 09 thru 2013-2014   istep for sbsc - nov 20142008 09 thru 2013-2014   istep for sbsc - nov 2014
2008 09 thru 2013-2014 istep for sbsc - nov 2014Blacketor Consultants, LLC
 
Columbia Sportsware Valuation
Columbia Sportsware Valuation Columbia Sportsware Valuation
Columbia Sportsware Valuation Earl R. Hayton
 
Manufacturing Process Optimization Using Statistical Modeling 2015
Manufacturing Process Optimization Using Statistical Modeling 2015Manufacturing Process Optimization Using Statistical Modeling 2015
Manufacturing Process Optimization Using Statistical Modeling 2015Ronald Ortiz
 
Tabel Nilai Kritis Distribusi Chi-Square
Tabel Nilai Kritis Distribusi Chi-SquareTabel Nilai Kritis Distribusi Chi-Square
Tabel Nilai Kritis Distribusi Chi-SquareTrisnadi Wijaya
 
A Situación Laboral dos Enxeñeiros de Telecomunicación de Galicia
A Situación Laboral dos Enxeñeiros de Telecomunicación de GaliciaA Situación Laboral dos Enxeñeiros de Telecomunicación de Galicia
A Situación Laboral dos Enxeñeiros de Telecomunicación de GaliciaCarlos López Ardao
 
cobb500 broiler performance nutrition supplement 2022
cobb500 broiler performance nutrition supplement 2022 cobb500 broiler performance nutrition supplement 2022
cobb500 broiler performance nutrition supplement 2022 AbdelRahman Yousef
 
Valuation Of ASHOK LEYLAND
Valuation Of ASHOK LEYLANDValuation Of ASHOK LEYLAND
Valuation Of ASHOK LEYLANDAakash Singh
 
FI4240_Proj1_Gudldona_Sudanth - 401k
FI4240_Proj1_Gudldona_Sudanth - 401kFI4240_Proj1_Gudldona_Sudanth - 401k
FI4240_Proj1_Gudldona_Sudanth - 401kSudanth Gudladona
 
MP1 Grades
MP1 GradesMP1 Grades
MP1 Gradesbwlomas
 

Similar to Square Pharmaceuticals LTD. (20)

Tabla de comparacion pago de pmg 2020 completa
Tabla de comparacion pago de pmg 2020 completaTabla de comparacion pago de pmg 2020 completa
Tabla de comparacion pago de pmg 2020 completa
 
Résultats élections régionales 20151206
Résultats élections régionales 20151206Résultats élections régionales 20151206
Résultats élections régionales 20151206
 
Escrutinio Defenitivo Elecciones 2011
Escrutinio Defenitivo Elecciones 2011Escrutinio Defenitivo Elecciones 2011
Escrutinio Defenitivo Elecciones 2011
 
2008 09 thru 2013-2014 istep for sbsc - nov 2014
2008 09 thru 2013-2014   istep for sbsc - nov 20142008 09 thru 2013-2014   istep for sbsc - nov 2014
2008 09 thru 2013-2014 istep for sbsc - nov 2014
 
Columbia Sportsware Valuation
Columbia Sportsware Valuation Columbia Sportsware Valuation
Columbia Sportsware Valuation
 
Manufacturing Process Optimization Using Statistical Modeling 2015
Manufacturing Process Optimization Using Statistical Modeling 2015Manufacturing Process Optimization Using Statistical Modeling 2015
Manufacturing Process Optimization Using Statistical Modeling 2015
 
Amtrust metrics
Amtrust metricsAmtrust metrics
Amtrust metrics
 
Tabel Nilai Kritis Distribusi Chi-Square
Tabel Nilai Kritis Distribusi Chi-SquareTabel Nilai Kritis Distribusi Chi-Square
Tabel Nilai Kritis Distribusi Chi-Square
 
Fundeb por origem 2013
Fundeb por origem 2013Fundeb por origem 2013
Fundeb por origem 2013
 
A Situación Laboral dos Enxeñeiros de Telecomunicación de Galicia
A Situación Laboral dos Enxeñeiros de Telecomunicación de GaliciaA Situación Laboral dos Enxeñeiros de Telecomunicación de Galicia
A Situación Laboral dos Enxeñeiros de Telecomunicación de Galicia
 
cobb500 broiler performance nutrition supplement 2022
cobb500 broiler performance nutrition supplement 2022 cobb500 broiler performance nutrition supplement 2022
cobb500 broiler performance nutrition supplement 2022
 
Estratificacion(1) dane
Estratificacion(1) daneEstratificacion(1) dane
Estratificacion(1) dane
 
Estratificacion(1) dane
Estratificacion(1) daneEstratificacion(1) dane
Estratificacion(1) dane
 
Maverick sabate work
Maverick sabate workMaverick sabate work
Maverick sabate work
 
Amtrust metrics
Amtrust metricsAmtrust metrics
Amtrust metrics
 
Pirson
PirsonPirson
Pirson
 
Valuation Of ASHOK LEYLAND
Valuation Of ASHOK LEYLANDValuation Of ASHOK LEYLAND
Valuation Of ASHOK LEYLAND
 
FI4240_Proj1_Gudldona_Sudanth - 401k
FI4240_Proj1_Gudldona_Sudanth - 401kFI4240_Proj1_Gudldona_Sudanth - 401k
FI4240_Proj1_Gudldona_Sudanth - 401k
 
MP1 Grades
MP1 GradesMP1 Grades
MP1 Grades
 
Active quotas spring2011
Active quotas spring2011Active quotas spring2011
Active quotas spring2011
 

Recently uploaded

Market Analysis in the 5 Largest Economic Countries in Southeast Asia.pdf
Market Analysis in the 5 Largest Economic Countries in Southeast Asia.pdfMarket Analysis in the 5 Largest Economic Countries in Southeast Asia.pdf
Market Analysis in the 5 Largest Economic Countries in Southeast Asia.pdfRachmat Ramadhan H
 
Best VIP Call Girls Noida Sector 39 Call Me: 8448380779
Best VIP Call Girls Noida Sector 39 Call Me: 8448380779Best VIP Call Girls Noida Sector 39 Call Me: 8448380779
Best VIP Call Girls Noida Sector 39 Call Me: 8448380779Delhi Call girls
 
VidaXL dropshipping via API with DroFx.pptx
VidaXL dropshipping via API with DroFx.pptxVidaXL dropshipping via API with DroFx.pptx
VidaXL dropshipping via API with DroFx.pptxolyaivanovalion
 
April 2024 - Crypto Market Report's Analysis
April 2024 - Crypto Market Report's AnalysisApril 2024 - Crypto Market Report's Analysis
April 2024 - Crypto Market Report's Analysismanisha194592
 
Midocean dropshipping via API with DroFx
Midocean dropshipping via API with DroFxMidocean dropshipping via API with DroFx
Midocean dropshipping via API with DroFxolyaivanovalion
 
100-Concepts-of-AI by Anupama Kate .pptx
100-Concepts-of-AI by Anupama Kate .pptx100-Concepts-of-AI by Anupama Kate .pptx
100-Concepts-of-AI by Anupama Kate .pptxAnupama Kate
 
Chintamani Call Girls: 🍓 7737669865 🍓 High Profile Model Escorts | Bangalore ...
Chintamani Call Girls: 🍓 7737669865 🍓 High Profile Model Escorts | Bangalore ...Chintamani Call Girls: 🍓 7737669865 🍓 High Profile Model Escorts | Bangalore ...
Chintamani Call Girls: 🍓 7737669865 🍓 High Profile Model Escorts | Bangalore ...amitlee9823
 
Al Barsha Escorts $#$ O565212860 $#$ Escort Service In Al Barsha
Al Barsha Escorts $#$ O565212860 $#$ Escort Service In Al BarshaAl Barsha Escorts $#$ O565212860 $#$ Escort Service In Al Barsha
Al Barsha Escorts $#$ O565212860 $#$ Escort Service In Al BarshaAroojKhan71
 
FESE Capital Markets Fact Sheet 2024 Q1.pdf
FESE Capital Markets Fact Sheet 2024 Q1.pdfFESE Capital Markets Fact Sheet 2024 Q1.pdf
FESE Capital Markets Fact Sheet 2024 Q1.pdfMarinCaroMartnezBerg
 
Ravak dropshipping via API with DroFx.pptx
Ravak dropshipping via API with DroFx.pptxRavak dropshipping via API with DroFx.pptx
Ravak dropshipping via API with DroFx.pptxolyaivanovalion
 
ALSO dropshipping via API with DroFx.pptx
ALSO dropshipping via API with DroFx.pptxALSO dropshipping via API with DroFx.pptx
ALSO dropshipping via API with DroFx.pptxolyaivanovalion
 
Delhi Call Girls Punjabi Bagh 9711199171 ☎✔👌✔ Whatsapp Hard And Sexy Vip Call
Delhi Call Girls Punjabi Bagh 9711199171 ☎✔👌✔ Whatsapp Hard And Sexy Vip CallDelhi Call Girls Punjabi Bagh 9711199171 ☎✔👌✔ Whatsapp Hard And Sexy Vip Call
Delhi Call Girls Punjabi Bagh 9711199171 ☎✔👌✔ Whatsapp Hard And Sexy Vip Callshivangimorya083
 
Accredited-Transport-Cooperatives-Jan-2021-Web.pdf
Accredited-Transport-Cooperatives-Jan-2021-Web.pdfAccredited-Transport-Cooperatives-Jan-2021-Web.pdf
Accredited-Transport-Cooperatives-Jan-2021-Web.pdfadriantubila
 
(PARI) Call Girls Wanowrie ( 7001035870 ) HI-Fi Pune Escorts Service
(PARI) Call Girls Wanowrie ( 7001035870 ) HI-Fi Pune Escorts Service(PARI) Call Girls Wanowrie ( 7001035870 ) HI-Fi Pune Escorts Service
(PARI) Call Girls Wanowrie ( 7001035870 ) HI-Fi Pune Escorts Serviceranjana rawat
 
Best VIP Call Girls Noida Sector 22 Call Me: 8448380779
Best VIP Call Girls Noida Sector 22 Call Me: 8448380779Best VIP Call Girls Noida Sector 22 Call Me: 8448380779
Best VIP Call Girls Noida Sector 22 Call Me: 8448380779Delhi Call girls
 
Week-01-2.ppt BBB human Computer interaction
Week-01-2.ppt BBB human Computer interactionWeek-01-2.ppt BBB human Computer interaction
Week-01-2.ppt BBB human Computer interactionfulawalesam
 
Log Analysis using OSSEC sasoasasasas.pptx
Log Analysis using OSSEC sasoasasasas.pptxLog Analysis using OSSEC sasoasasasas.pptx
Log Analysis using OSSEC sasoasasasas.pptxJohnnyPlasten
 

Recently uploaded (20)

Market Analysis in the 5 Largest Economic Countries in Southeast Asia.pdf
Market Analysis in the 5 Largest Economic Countries in Southeast Asia.pdfMarket Analysis in the 5 Largest Economic Countries in Southeast Asia.pdf
Market Analysis in the 5 Largest Economic Countries in Southeast Asia.pdf
 
Best VIP Call Girls Noida Sector 39 Call Me: 8448380779
Best VIP Call Girls Noida Sector 39 Call Me: 8448380779Best VIP Call Girls Noida Sector 39 Call Me: 8448380779
Best VIP Call Girls Noida Sector 39 Call Me: 8448380779
 
VidaXL dropshipping via API with DroFx.pptx
VidaXL dropshipping via API with DroFx.pptxVidaXL dropshipping via API with DroFx.pptx
VidaXL dropshipping via API with DroFx.pptx
 
April 2024 - Crypto Market Report's Analysis
April 2024 - Crypto Market Report's AnalysisApril 2024 - Crypto Market Report's Analysis
April 2024 - Crypto Market Report's Analysis
 
Delhi 99530 vip 56974 Genuine Escort Service Call Girls in Kishangarh
Delhi 99530 vip 56974 Genuine Escort Service Call Girls in  KishangarhDelhi 99530 vip 56974 Genuine Escort Service Call Girls in  Kishangarh
Delhi 99530 vip 56974 Genuine Escort Service Call Girls in Kishangarh
 
Midocean dropshipping via API with DroFx
Midocean dropshipping via API with DroFxMidocean dropshipping via API with DroFx
Midocean dropshipping via API with DroFx
 
100-Concepts-of-AI by Anupama Kate .pptx
100-Concepts-of-AI by Anupama Kate .pptx100-Concepts-of-AI by Anupama Kate .pptx
100-Concepts-of-AI by Anupama Kate .pptx
 
Chintamani Call Girls: 🍓 7737669865 🍓 High Profile Model Escorts | Bangalore ...
Chintamani Call Girls: 🍓 7737669865 🍓 High Profile Model Escorts | Bangalore ...Chintamani Call Girls: 🍓 7737669865 🍓 High Profile Model Escorts | Bangalore ...
Chintamani Call Girls: 🍓 7737669865 🍓 High Profile Model Escorts | Bangalore ...
 
Al Barsha Escorts $#$ O565212860 $#$ Escort Service In Al Barsha
Al Barsha Escorts $#$ O565212860 $#$ Escort Service In Al BarshaAl Barsha Escorts $#$ O565212860 $#$ Escort Service In Al Barsha
Al Barsha Escorts $#$ O565212860 $#$ Escort Service In Al Barsha
 
FESE Capital Markets Fact Sheet 2024 Q1.pdf
FESE Capital Markets Fact Sheet 2024 Q1.pdfFESE Capital Markets Fact Sheet 2024 Q1.pdf
FESE Capital Markets Fact Sheet 2024 Q1.pdf
 
Ravak dropshipping via API with DroFx.pptx
Ravak dropshipping via API with DroFx.pptxRavak dropshipping via API with DroFx.pptx
Ravak dropshipping via API with DroFx.pptx
 
꧁❤ Aerocity Call Girls Service Aerocity Delhi ❤꧂ 9999965857 ☎️ Hard And Sexy ...
꧁❤ Aerocity Call Girls Service Aerocity Delhi ❤꧂ 9999965857 ☎️ Hard And Sexy ...꧁❤ Aerocity Call Girls Service Aerocity Delhi ❤꧂ 9999965857 ☎️ Hard And Sexy ...
꧁❤ Aerocity Call Girls Service Aerocity Delhi ❤꧂ 9999965857 ☎️ Hard And Sexy ...
 
ALSO dropshipping via API with DroFx.pptx
ALSO dropshipping via API with DroFx.pptxALSO dropshipping via API with DroFx.pptx
ALSO dropshipping via API with DroFx.pptx
 
Delhi Call Girls Punjabi Bagh 9711199171 ☎✔👌✔ Whatsapp Hard And Sexy Vip Call
Delhi Call Girls Punjabi Bagh 9711199171 ☎✔👌✔ Whatsapp Hard And Sexy Vip CallDelhi Call Girls Punjabi Bagh 9711199171 ☎✔👌✔ Whatsapp Hard And Sexy Vip Call
Delhi Call Girls Punjabi Bagh 9711199171 ☎✔👌✔ Whatsapp Hard And Sexy Vip Call
 
Accredited-Transport-Cooperatives-Jan-2021-Web.pdf
Accredited-Transport-Cooperatives-Jan-2021-Web.pdfAccredited-Transport-Cooperatives-Jan-2021-Web.pdf
Accredited-Transport-Cooperatives-Jan-2021-Web.pdf
 
(PARI) Call Girls Wanowrie ( 7001035870 ) HI-Fi Pune Escorts Service
(PARI) Call Girls Wanowrie ( 7001035870 ) HI-Fi Pune Escorts Service(PARI) Call Girls Wanowrie ( 7001035870 ) HI-Fi Pune Escorts Service
(PARI) Call Girls Wanowrie ( 7001035870 ) HI-Fi Pune Escorts Service
 
Best VIP Call Girls Noida Sector 22 Call Me: 8448380779
Best VIP Call Girls Noida Sector 22 Call Me: 8448380779Best VIP Call Girls Noida Sector 22 Call Me: 8448380779
Best VIP Call Girls Noida Sector 22 Call Me: 8448380779
 
Week-01-2.ppt BBB human Computer interaction
Week-01-2.ppt BBB human Computer interactionWeek-01-2.ppt BBB human Computer interaction
Week-01-2.ppt BBB human Computer interaction
 
CHEAP Call Girls in Saket (-DELHI )🔝 9953056974🔝(=)/CALL GIRLS SERVICE
CHEAP Call Girls in Saket (-DELHI )🔝 9953056974🔝(=)/CALL GIRLS SERVICECHEAP Call Girls in Saket (-DELHI )🔝 9953056974🔝(=)/CALL GIRLS SERVICE
CHEAP Call Girls in Saket (-DELHI )🔝 9953056974🔝(=)/CALL GIRLS SERVICE
 
Log Analysis using OSSEC sasoasasasas.pptx
Log Analysis using OSSEC sasoasasasas.pptxLog Analysis using OSSEC sasoasasasas.pptx
Log Analysis using OSSEC sasoasasasas.pptx
 

Square Pharmaceuticals LTD.

  • 1. SQUARE PHARMACEUTICALS LTD Statement of Financial Position At 31 March 2015 2015 2014 ASSETS Non-Current Assets: 25,45,89,86,164 23,54,67,01,250 Property, Plant and Equipment-Carrying Value 18,00,92,00,507 13,93,36,89,469 Deferred Tax Assets 7,51,67,249 Capital Work-in-Progress 20,76,29,864 3,25,68,02,171 Investment - Long Term (at Cost) 25,15,99,097 14,76,94,430 Investment - Associates Undertaking 6,03,61,39,963 5,36,41,54,708 Investment in Marketable Securities (Fair Value) 87,92,49,484 84,43,60,472 Current Assets 9,73,21,70,099 7,49,93,73,281 Inventories 3,31,00,86,668 2,73,70,85,779 Trade Debtors 89,45,43,303 76,66,34,978 Advances, Deposits and Prepayments 75,01,69,066 67,17,49,541 Short Term Loan 88,51,85,428 1,16,11,85,776 Cash and Cash Equivalents 3,89,21,85,634 2,16,27,17,207 TOTAL ASSETS 35191156263 31046074531 Shareholders' Equity: 31,09,33,02,284 26,73,95,81,929 Share Capita 5,54,29,91,520 4,81,99,92,630 Share Premium 2,03,54,65,000 2,03,54,65,000 General Reserve 10,58,78,200 10,58,78,200 Tax Holiday Reserve 40,62,31,702 Gain on Marketable Securities (Unrealized) 26,53,32,813 44,92,55,557 Retained Earnings 23,14,36,34,751 18,92,27,58,840 Non-Controlling Interest -16,69,864 93,69,803 Non-Current Liabilities: 1,55,05,05,777 1,90,25,85,673 Long Term Loans - Secured 65,91,47,818 1,18,36,27,923 Deferred Tax Liability 89,13,57,959 71,89,57,750 Current Liabilities: 2,54,90,18,066 2,39,45,37,126 Short Term Bank Loans 13,11,04,817 Long Term Loans-Current Portion 25,71,54,669 46,14,33,822 Trade Creditors 25,47,73,030 21,78,55,755 Liabilities for Expenses 4,30,02,246 2,05,18,598 Liabilities for Other Finance 1,99,40,88,121 1,56,36,24,134 TOTAL SHAREHOLDERS' EQUITY AND LIABILITIES 35,19,11,56,263 31,04,60,74,531
  • 2. AMOUNT PERCENT 1,91,22,84,914 8.12% 4,07,55,11,038 29.25% 7,51,67,249 0.00% -3,04,91,72,307 -8.66% 10,39,04,667 0.30% 67,19,85,255 1.91% 3,48,89,012 0.10% 2,23,27,96,818 6.34% 57,30,00,889 1.63% 12,79,08,325 0.36% 7,84,19,525 0.22% -27,60,00,348 -0.78% 1,72,94,68,427 4.91% 4,14,50,81,732 11.78% 4,35,37,20,355 12.37% 72,29,98,890 2.05% 0 0.00% 0 0.00% -40,62,31,702 -1.15% -18,39,22,744 -0.52% 4,22,08,75,911 11.99% -1,10,39,667 -0.03% -35,20,79,896 -1.00% -52,44,80,105 -1.49% 17,24,00,209 0.49% 15,44,80,940 0.44% -13,11,04,817 -0.37% -20,42,79,153 -0.58% 3,69,17,275 0.10% 2,24,83,648 0.06% 43,04,63,987 1.22% 4,14,50,81,732 11.78% Square Pharmaceuticals Ltd. Horizontal Analysis of Balance Sheet
  • 3. Amount Percent Amount Percent 25458986164 72.34% 23,54,67,01,250 75.84% 18009200507 51.18% 13,93,36,89,469 44.88% 75167249 0.21% 0 0.00% 207629864 0.59% 3,25,68,02,171 10.49% 25,15,99,097 0.71% 14,76,94,430 0.48% 6,03,61,39,963 17.15% 5,36,41,54,708 17.28% 87,92,49,484 2.50% 84,43,60,472 2.72% 9,73,21,70,099 27.66% 7,49,93,73,281 24.16% 3,31,00,86,668 9.41% 2,73,70,85,779 8.82% 89,45,43,303 2.54% 76,66,34,978 2.47% 75,01,69,066 2.13% 67,17,49,541 2.16% 88,51,85,428 2.52% 1,16,11,85,776 3.74% 3,89,21,85,634 11.06% 2,16,27,17,207 6.97% 35,19,11,56,263 100.00% 31,04,60,74,531 100.00% 31,09,33,02,284 88.36% 26,73,95,81,929 86.13% 5,54,29,91,520 15.75% 4,81,99,92,630 15.53% 2,03,54,65,000 5.78% 2,03,54,65,000 6.56% 10,58,78,200 0.30% 10,58,78,200 0.34% 0.00% 40,62,31,702 1.31% 26,53,32,813 0.75% 44,92,55,557 1.45% 23,14,36,34,751 65.77% 18,92,27,58,840 60.95% -16,69,864 0.00% 93,69,803 0.03% 1,55,05,05,777 4.41% 1,90,25,85,673 6.13% 65,91,47,818 1.87% 1,18,36,27,923 3.81% 89,13,57,959 2.53% 71,89,57,750 2.32% 2,54,90,18,066 7.24% 2,39,45,37,126 7.71% 0.00% 13,11,04,817 0.42% 25,71,54,669 0.73% 46,14,33,822 1.49% 25,47,73,030 0.72% 21,78,55,755 0.70% 4,30,02,246 0.12% 2,05,18,598 0.07% 1,99,40,88,121 5.67% 1,56,36,24,134 5.04% 35,19,11,56,263 100.00% 31,04,60,74,531 100.00% Square Pharmaceuticals Ltd. Vertical Analysis of Balance sheet 2015 2014
  • 4. Amount Percent 3,88,78,83,691 14.57% 47,17,23,792 1.77% 3,41,61,59,899 12.80% -1,98,21,31,472 -7.43% 1,43,40,28,427 5.37% -35,20,70,119 -1.32% -32,59,00,147 -1.22% -4,46,87,061 -0.17% 1,85,17,089 0.07% 1,08,19,58,308 4.05% 4,85,96,632 0.18% 1,13,05,54,940 4.24% -7,93,56,220 -0.30% 1,05,11,98,720 3.94% -16,10,75,802 -0.60% -2,94,34,161 -0.11% 7,51,67,249 0.00% 93,58,56,006 3.51% 9,95,75,169 0.37% 1,03,54,31,175 3.88% 0 -31,96,46,077 -1.20% 71,57,85,098 2.68% 1,03,54,31,175 3.88% 1,03,92,51,291 3.89% -38,20,116 -0.01% 71,57,85,098 2.68% 71,96,05,214 2.70% -38,20,116 -0.01% 0 2 0.00% 0 0.00% Square Pharmaceuticals Ltd. Horizontal Analysis of Income statement
  • 5. Amount Percent Amount Percent 30,83,35,71,248 115.55% 26,94,56,87,557 115.80% 4,14,89,98,132 15.55% 3,67,72,74,340 15.80% 26,68,45,73,116 100.00% 23,26,84,13,217 100.00% -14,94,28,70,155 -56.00% -12,96,07,38,683 -55.70% 11,74,17,02,961 44.00% 10,30,76,74,534 44.30% -4,69,20,91,383 -17.58% -4,34,00,21,264 -18.65% -3,75,78,38,863 -14.08% -3,43,19,38,716 -14.75% -77,56,38,213 -2.91% -73,09,51,152 -3.14% -15,86,14,307 -0.59% -17,71,31,396 -0.76% 7,04,96,11,578 26.42% 5,96,76,53,270 25.65% 29,37,30,506 1.10% 24,51,33,874 1.05% 7,34,33,42,084 27.52% 6,21,27,87,144 26.70% -37,97,95,062 -1.42% -30,04,38,842 -1.29% 6,96,35,47,022 26.10% 5,91,23,48,302 25.41% -1,67,98,77,193 -6.30% -1,51,88,01,391 -6.53% -17,24,00,209 -0.65% -14,29,66,048 -0.61% 7,51,67,249 0.28% 0 0.00% 5,18,64,36,869 19.44% 4,25,05,80,863 18.27% 79,51,99,468 2.98% 69,56,24,299 2.99% 5,98,16,36,337 22.42% 4,94,62,05,162 21.26% 0.00% -183922744.00 -0.69% 13,57,23,333 0.58% 5,79,77,13,593 21.73% 5,08,19,28,495 21.84% 5,98,16,36,337 22.42% 4,94,62,05,162 21.26% 5,98,38,06,201 22.42% 4,94,45,54,910 21.25% -21,69,864 -0.01% 16,50,252 0.01% 5,79,77,13,593 21.73% 5,08,19,28,495 21.84% 5,79,98,83,457 21.73% 5,08,02,78,243 21.83% -21,69,864 -0.01% 16,50,252 0.01% 0.00% 0.00% 11 0.00% 9 0.00% 55,42,99,152 2.08% 55,42,99,152 2.38% Square Pharmaceuticals Ltd. Vertical Analysis of Income statement
  • 6. Square Pharmaceuticals Limited Ratio Analysis Liquidity Ratio Current Ratio Current Ratio = Current Asset ÷ Current Liability 9,732,170,099 ÷ 2,549,018,066 = 3.818 Quick ratio or acid test Ratio (Current asset- inventories)/Current liabilities 9732170099- 3,310,086,668 / 2,549,018,066 =2.519 Accounts Receivable Turnover Net credit sales/Average net Accounts Receivable 26684573116/ 894,543,303+766,634,978 /2 = 17.44 20.65 days Inventory Turnover Cost of Goods Sold / Average Inventory 14942870155/3,310,086,668+2,737,085,779 /2 = 4.51 80.93 Days Profitability Ratio profit margin Net Income/Net sales 5186436869/26,684,573,116*100 = 19.45% Total asset turnover Ratio Net Sales / Total asset
  • 7. 26,684,573,116/ 35,191,156,263 = 75.83% Return on asset Ratio Net Income/Total Assets 5186436869/35,191,156,263= 14.738 total asset turnover Ratio Net income / Common stockholders “equity 5186436869/31093302284 = 16.7% Earnings Per Share Net income /weighted average number of share outstanding 5186436869/4,819,992,630 + 5,542,991,520 /2 = 0.683 Price Earnings Ratio Market price Per Share of Stock/Earning Per Share 270.3/0.683 = 395.754 payout Ratio Cash dividend /Net Income 1,445,997,789/5186436869 = 27.88% Solvency Ratios Debt to Asset ratio: Debt/Total Asset 4099523843/35,191,156,263 = 11.65% Time Interest Earned : Income before Income taxes and Interest Expense/ Interest Expense 7122161329/158614307 = 44.90 times