Indexing Structures in Database Management system.pdf
Giving usa 2013 synthèse
1. 1 Giving USA 2013
Researched and written by
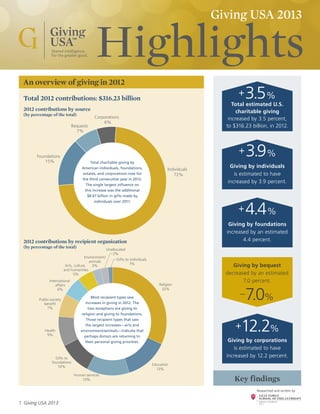
+ 3.9 %
Giving by individuals
is estimated to have
increased by 3.9 percent.
+ 3.5 %
Total estimated U.S.
charitable giving
increased by 3.5 percent,
to $316.23 billion, in 2012.
Giving USA 2013
Highlights
Key findings
Corporations
6%
Bequests
7%
Individuals
72%
Foundations
15% Total charitable giving by
American individuals, foundations,
estates, and corporations rose for
the third consecutive year in 2012.
The single largest influence on
this increase was the additional
$8.67 billion in gifts made by
individuals over 2011.
An overview of giving in 2012
Unallocated
2%
Religion
32%
Education
13%
Human services
13%
Health
9%
Public-society
benefit
7%
Arts, culture,
and humanities
5%
International
affairs
6%
Environment/
animals
3%
Gifts to individuals
1%
Gifts to
foundations
10%
Most recipient types saw
increases in giving in 2012. The
two exceptions are giving to
religion and giving to foundations.
Those recipient types that saw
the largest increases—arts and
environment/animals—indicate that
perhaps donors are returning to
their personal giving priorities.
2012 contributions by source
(by percentage of the total)
2012 contributions by recipient organization
(by percentage of the total)
+ 4.4 %
Giving by foundations
increased by an estimated
4.4 percent.
– 7.0 %
Giving by bequest
decreased by an estimated
7.0 percent.
+ 12.2 %
Giving by corporations
is estimated to have
increased by 12.2 percent.
Total 2012 contributions: $316.23 billion
2. 2 Giving USA 2013
Researched and written by
An overview of giving in 2012
Inflation-adjusted dollars Current dollars
Inflation-adjusted dollars in recessions
0
50
100
150
200
250
300
350
2003 2004 2005 2006 2007 2008 2009 2010 2011 2012
$316.23
zz Total giving rose 3.5 percent in current dollars in 2012, or 1.5
percent adjusted for inflation.
zz In the last decade, total giving has increased by $78.78 billion in
current dollars, or $19.79 billion in inflation-adjusted dollars.
zz While total charitable giving is growing, if it continues to grow at
current rates, giving will not reach the high of $344.48 billion in
2007 for at least six years (adjusted for inflation).
Refer to page 24 in the annual report for a complete review
of 2012 total giving trends.
Total giving: 2003–2012
(in billions of dollars)
Total giving as a percentage of GDP 2002–2012
(in inflation-adjusted dollars, 2012 = $100)
2.2% 2.2% 2.2%
2.1%
2.0% 2.0%
2002 2004 2006 2008 2010 2012
zz Several economic factors influence how much donors give to
charity. Gross Domestic Product (GDP) is one of those factors.
zz Inflation-adjusted GDP increased 2.0 percent between 2011 and
2012. This rate of change is compared with inflation-adjusted
growth in total giving of 1.5 percent. Total giving as a percentage
of GDP in 2012 was 2.0 percent.
Refer to page 36 in the annual report for a complete review
of 2012 total giving as a percentage of GDP trends.
Key factors related to the rise in total charitable giving in 2012
zz Growth in charitable giving by source and for particular recipient
types mirrors the mixed economic growth seen in the U.S.
economy in 2012.
zz The 2012 fiscal cliff and proposed changes in the charitable tax
deduction at year’s end may have affected how some individuals
chose to give—some may have decided to give in 2012, while
others may have taken a “wait and see” approach.
Refer to the Numbers section and chapters in the annual
report for a complete review of how changes in the economic
environment affected different aspects of giving in 2012.
Also, find a special section on the charitable deduction
beginning on page 239 in the annual report.
Key factors related to the rise in giving by individuals in 2012
zz The willingness of individuals and households to give to charity
is associated with feelings of financial security. As the economy
continues its slow upward climb, contributions from individuals
are rising in the same way.
zz Two economic factors that influence how much individuals
give—personal consumption expenditures and the S&P 500—
both rose in 2012. These factors contributed to the increase
of 3.9 percent in giving by individuals.
Refer to page 26 in the annual report for an overview of
2012 individual giving trends, as well as the chapter on
giving by individuals in the annual report.
Key factors related to the rise in giving by corporations in 2012
zz Growth in giving by corporations in 2012 was largely driven by
a 16.6 percent gain in corporate pre-tax profits and 4.0 percent
growth in the GDP (figures are in current dollars).
zz Corporations are increasingly giving in the form of in-kind gifts
and product donations—factors that have attributed to the
overall rise in corporate giving in recent years.
Refer to page 30 in the annual report for an overview of
2012 corporate giving trends, as well as the chapter on
giving by corporations in the annual report.
Key facts about giving to particular recipient types in 2012
zz Estimated giving to arts, culture, and humanities grew the
most, at 7.8 percent—likely the result of donors returning to
pre-recession giving priorities.
zz Giving to foundations was the only estimated decline in giving
to any recipient type (-4.6 percent).
zz An estimated increase of 7.0 percent for giving to education is,
in part, attributed to the growth in giving to K–12 schools and
community colleges.
zz Growth in giving to international affairs slowed, with an
estimated increase of 2.5 percent. A decline in high-profile
international disasters and increased giving for domestic issues
and disasters likely attributed to the slowing of giving to this
subsector compared with recent years.
Refer to pages 40-51 in the annual report for overviews of
2012 giving by recipient type, as well as the chapters on
giving to specific recipient types in the annual report.
3. 3 Giving USA 2013
Researched and written by
Giving USA 2013
Giving USA 2013: The Annual Report on Philanthropy for the Year 2012 includes the following items for
only $89.95!
zz The complete Giving USA 2013 Annual Report in print form as well as an immediately downloadable electronic copy
of the full report, which includes: “The Numbers” section, chapters on giving by source and giving by recipient type,
a chapter on legal and legislative issues, and a “hot topic” bonus chapter, “The charitable deduction.”
zz The Giving USA 2013 Graph Pack, which is a selection of Giving USA’s most popular graphs in PowerPoint format.
These graphs can be used in the purchaser’s own presentation or as a separate, short presentation on Giving USA
data for the year 2012. (Free! Valued at $49.95!)
Foreword...............................................................................1
Acknowledgments.................................................................5
GIVING USA ESTIMATES
1 Key findings....................................................................7
2 Giving USA: The Numbers............................................12
SOURCES OF CONTRIBUTIONS
3 Giving by individuals.....................................................65
4 Giving by foundations...................................................81
5 Giving by bequest.........................................................91
6 Giving by corporations................................................103
USES OF CONTRIBUTIONS
7 Giving to religion........................................................121
8 Giving to education....................................................135
9 Giving to human services............................................155
10 Giving to foundations.................................................165
11 Giving to health..........................................................171
12 Giving to public-society benefit...................................183
13 Giving to international affairs......................................197
14 Giving to arts, culture, and humanities........................209
15 Giving to environment/animals...................................221
16 Legal and legislative issues..........................................231
17 The charitable deduction............................................239
GIVING DATA
18 Data tables for charts in Giving USA: The Numbers.....248
METHODOLOGY
19 Brief summary of methods used..................................257
20 Glossary......................................................................269
21 Summary of the National Taxonomy of
Exempt Entities...........................................................272
The Giving Institute™ and the Giving USA Foundation™...274
Committees, Advisory Council, and Staff...........................277
Professional Code of Ethics................................................281
Standards of Practice.........................................................282
Index to Giving USA 2013
Legacy Circle: $25,000 and greater
The Giving Institute™
Keystone Circle: $15,000–$24,999
Dunham+Company
Foundation Circle: $10,000–$14,999
CCS Fund Raising
Grenzebach Glier and Associates
Marts & Lundy
Benefactor: $7,500–$9,999
None in this category in 2013
Patron: $5,000–$7,499
Bentz Whaley Flessner
Blackbaud
Campbell & Company
Collins Group
GuideStar
Harris Connect, LLC
Katha Kissman
Silicon Valley Community Foundation
Partner: $2,000–$4,999
Alexander Haas
Alexander Macnab & Co.
The Alford Group
Beazley Foundation Inc.
Cramer & Associates
The Curtis Group
Dini Partners
DonorPerfect
Jeffrey Byrne + Associates, Inc.
Johnson, Grossnickle and Associates
M. Anne Murphy
The Phoenix Philanthropy Group
Ruotolo Associates Inc.
Schwab Charitable
Smith Beers Yunker & Company
Builder: $1,000–$1,999
Arnoult & Associates, Inc.
Association for Healthcare
Philanthropy
Association of Fundraising
Professionals
Benefactor Group
Benevon
Carlson Fund Raising
Compton Fundraising
Consultants Ltd.
The EHL Consulting Group, Inc.
Global Advancement LLC
Indiana Grantmakers Alliance
Joyaux Associates
KCI-Ketchum Canada, Inc.
The Kellogg Organization
Lisa M. Dietlin & Associates
Tom and Margaret Mesaros
Otterbein Homes
Nancy L. Raybin and Bill Portlock
StaleyRobeson
Sponsor: $100–$999
Arthur Alley Associated
Geoffrey Brown
David and Linda Shaheen
Foundation
Event 360
Edith Falk
Don Fellows
Peter Fissinger
Kim Hawkins
Richard T. Jolly
Wendy McGrady
Sandy Macnab
Melissa S. Brown & Associates, LLC
Jack Miller
PG Calc
Philanthropy Northwest
George and Joanne Ruotolo
Semple Bixel Associates, Inc.
Sentergroup, Inc.
David and Patricia Shufflebarger
Richard Tollefson and
Marc Kellenberger
Winkler Group
Contributors