This document contains 3 stem-and-leaf plots showing the ages of US presidents and vice presidents from 1800 to 2008, as well as a frequency table showing the number of Republican and Democratic presidents during that time period. The author chose stem-and-leaf plots to organize the age data because they are good for large data sets and easy to read, and used a frequency table for the party data because there were fewer entries and it is simple. They include an example bar graph that could be used to visualize the party frequency data.
1. ▯ Adam Varela
October 1, 2009
Grade 6
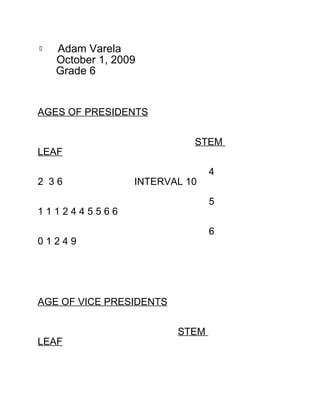
AGES OF PRESIDENTS
STEM
LEAF
4
2 36 INTERVAL 10
5
1112445566
6
01249
AGE OF VICE PRESIDENTS
STEM
LEAF
2. 4
023599 INTERVAL 10
5
1334479
6
0569
7
2
PARTIES
FREQUENCY
REPUBLICANS
11
DEMOCRATS
7
I chose the stem and leaf for charts 1 and
2 because they are very good to keep large sets of
data and easy to read.
3. I chose a frequency chart for the parties
because there is not a lot of data and it is simple to
read.
If I drew a bar graph for the parties data I
would start it with zero, because the numbers for this
data is low.
11 ┃
9 ┃
7 ┃ ┃
5 ┃ ┃
3 ┃ ┃
1 ┃ ┃
0 ┃ ┃
REP DEM