SlideShare a Scribd company logo
1 of 30
Download to read offline
International Journal of Scientific and Research Publications, Volume 5, Issue 10, October 2015 1
ISSN 2250-3153
www.ijsrp.org
An Analytical Study of FDI in India
(2000-2015)
Abhishek Vijaykumar Vyas
MBA – International Business, Sinhgad Institute of Technology and Science (SITS), Pune, Maharashtra, India
Abstract- Foreign Direct investment plays a very important role
in the development of the nation. Sometimes domestically
available capital is inadequate for the purpose of overall
development of the country. Foreign capital is seen as a way of
filling in gaps between domestic savings and investment. India
can attract much larger foreign investments than it has done in
the past. The present study has focused on the trends of FDI
Flow in India during 2000-01 to 2014-15 (up to June, 2015).
The study also highlights country wise approvals of FDI
inflows to India and the FDI inflows in different sector for the
period April 2000 to June 2015. The study based on Secondary
data which have been collected through reports of the Ministry of
Commerce and Industry, Department of Industrial Promotion and
Policy, Government of India, Reserve Bank of India, and World
Investment Report. The study concludes that Mauritius emerged
as the most dominant source of FDI contributing. It is because
the India has Double Taxation Avoidance Agreement (DTAA)
with Mauritius and most of the foreign countries like to invest in
service sector.
Index Terms- foreign direct investment; economic growth, FDI
2000 to 2015.
I. INTRODUCTION
oreign Direct Investment (FDI) is a type of investment in to
an enterprises in a country by another enterprises located in
another country by buying a company in the target country or by
expanding operations of an existing business in that country. In
the era of globalization FDI takes vital part in the development of
both developing and developed countries.
FDI has been associated with improved economic growth and
development in the host countries which has led to the
emergence of global competition to attract FDI.
FDI offers number of benefits like overture of new
technology, innovative products, and extension of new markets,
opportunities of employment and introduction of new skills etc.,
which reflect in the growth of income of any nation.
Foreign direct investment is one of the measures of growing
economic globalization. Investment has always been an issue for
the developing economies such as India. The world has been
globalizing and all the countries are liberalizing their policies for
welcoming investment from countries which are abundant in
capital resources. The countries which are developed are
focusing on new markets where there is availability of abundant
labors, scope for products, and high profits are achieved.
Therefore Foreign Direct Investment (FDI) has become a battle
ground in the emerging markets.
Foreign investment plays a significant role in development of
any economy as like India. Many countries provide many
incentives for attracting the foreign direct investment (FDI).
Need of FDI depends on saving and investment rate in any
country. Foreign Direct investment acts as a bridge to fulfill the
gap between investment and saving. In the process of economic
development foreign capital helps to cover the domestic saving
constraint and provide access to the superior technology that
promote efficiency and productivity of the existing production
capacity and generate new production opportunity.
India’s recorded GDP growth throughout the last decade has
lifted millions out of poverty & made the country a favoured
destination for foreign direct investment. A recent UNCTAD
survey projected India as the second most important FDI
destination after China for transnational corporations during
2010-2015. Services, telecommunication, construction activities,
computer software & hardware and automobile are major sectors
which attracted higher inflows of FDI in India. Countries like
Mauritius, Singapore, US & UK were among the leading sources
of FDI in India.
FDI inflow routes: An Indian company may receive Foreign
Direct Investment under the two routes as given under:
1. Automatic Route: FDI in sectors /activities to the extent
permitted under the automatic route does not require any prior
approval either of the Government or the Reserve Bank of India.
2. Government Route: FDI in activities not covered under
the automatic route requires prior approval of the Government
which are considered by the Foreign Investment Promotion
Board (FIPB), Department of Economic Affairs, and Ministry of
Finance.
FDI is not permitted in the following industrial sectors:
 Arms and ammunition.
 Atomic Energy,
 Railway Transport.
 Coal and lignite.
 Mining of iron, manganese, chrome, gypsum, sulphur,
gold, diamonds, copper, zinc.
 Lottery Business
 Gambling and Betting
 Business of Chit Fund
 Agricultural (excluding Floriculture, Horticulture,
Development of seeds, Animal Husbandry, Pisciculture
and cultivation of vegetables, mushrooms, etc. under
controlled conditions and services related to agro and
F
International Journal of Scientific and Research Publications, Volume 5, Issue 10, October 2015 2
ISSN 2250-3153
www.ijsrp.org
allied sectors) and Plantations activities (other than Tea
Plantations) .
 Housing and Real Estate business.
 Trading in Transferable Development Rights (TDRs).
 Manufacture of cigars, cheroots, cigarillos and
cigarettes, of tobacco or of tobacco substitutes.

II. REVIEW OF LITERATURE
Singh Kr. Arun and Agarwal P.K., (2012) “Foreign direct
investment: The big bang in Indian retail”. In this article they
have studied the relation of foreign investment and Indian retail
business. The study is based on different literatures, case studies
and analysis of organised retail market. The author discusses the
policy development for FDI in the two retail categories: single
brand and multi brand. The author concludes that FDI in multi
brand retail should be considered, better technology and
employment. The paper also concludes that openness of FDI in
India would help India to integrate into worldwide market.
Dr. Mamata Jain and Mrs. Meenal Lodhana Sukhlecha,
(2012), “FDI in multi brand retail: Is it the need of the hour?”
The paper studies the need of the retail community to invite FDI
in retailing. The study is under taken through analysis of positive
and negative impacts of reforms. The study shows various
advantages of FDI, which suggests for foreign participation in
retailing, but the author also suggests that the ceiling should not
exceed 51% even for single brands to ensure check and control
on business operations.
Rajalakshmi K. and Ramachandran F., (2011), “Impact of
FDI in India’s automobile sector with reference to passenger car
segment.” The author has studied the foreign investment flows
through the automobile sector with special reference to passenger
cars. The research methodology used for analysis includes the
use of ARIMA, coefficient, linear and compound model. The
period of study is from 1991to 2011. This paper is an empirical
study of FDI flows after post liberalisation period. The author
has also examined the trend ad composition of FDI flow and the
effect of FDI on economic growth. The author has also identified
the problems faced by India in FDI growth of automobile sector
through suggestions of policy implications.
Dr. S N Babar and Dr. B V Khandare, (2012), “Structure of
FDI in India during globalisation period”. The study is mainly
focused on changing structure and direction of India’s FDI
during globalisation period. The study is done through analysis
of benefits of FDI for economic growth. The study has been done
through sect oral analysis of FDI participation, as well as through
study of country wise flow of foreign inflow in India till 2010.
Singh (2009) stated in their study that foreign direct
investment (FDI) policies play a major role in the economic
growth of developing countries around the world. Attracting FDI
inflows with conductive policies has therefore become a key
battleground in the emerging markets. The paper highlighted the
trend of FDI in India after the sector-wise economic reforms.
Devajit (2012) conducted the study to find out the impact of
foreign direct investments on Indian economy and concluded that
Foreign Direct Investment (FDI) as a strategic component of
investment is needed by India for its sustained economic growth
and development through creation of jobs, expansion of existing
manufacturing industries, short and long term project in the field
of healthcare, education, research and development.
Sharma Reetu and Khurana Nikita (2013) in their study on
the sector-wise distribution of FDI inflow to know about which
has concerned with the chief share, used a data from 1991-92 to
2011-2012 (post-liberalization period). This paper also discusses
the various problems about the foreign direct investment and
suggests the some recommendations for the same. In this study
found that, Indian economy is mostly based on agriculture. So,
there is a most important scope of agriculture services.
Therefore, the foreign direct investment in this sector should be
encouraged.
III. FDI POLICY FRAMEWORK IN INDIA
Policy regime is one of the key factors driving investment
flows to a country. Apart from underlying overall fundamentals,
ability of a nation to attract foreign investment essentially
depends upon its policy regime - whether it promotes or restrains
the foreign investment flows.
This section undertakes a review of India’s FDI policy
framework. There has been a sea change in India’s approach to
foreign investment from the early 1990s when it began structural
economic reforms about almost all the sectors of the economy.
a) Pre-Liberalisation Period:
Historically, India had followed an extremely careful and
selective approach while formulating FDI policy in view of the
governance of „import-substitution strategy‟ of industrialisation.
The regulatory framework was consolidated through the
enactment of Foreign Exchange Regulation Act (FERA), 1973
wherein foreign equity holding in a joint venture was allowed
only up to 40 per cent. Subsequently, various exemptions were
extended to foreign companies engaged in export oriented
businesses and high technology and high priority areas including
allowing equity holdings of over 40 per cent. Moreover, drawing
from successes of other country experiences in Asia,
Government not only established special economic zones (SEZs)
but also designed liberal policy and provided incentives for
promoting FDI in these zones with a view to promote exports.
The announcements of Industrial Policy (1980 and 1982) and
Technology Policy (1983) provided for a liberal attitude towards
foreign investments in terms of changes in policy directions. The
policy was characterised by de-licensing of some of the industrial
rules and promotion of Indian manufacturing exports as well as
emphasising on modernisation of industries through liberalised
imports of capital goods and technology. This was supported by
trade liberalisation measures in the form of tariff reduction and
shifting of large number of items from import licensing to Open
General Licensing (OGL).
b) Post-Liberalisation Period:
A major shift occurred when India embarked upon economic
liberalisation and reforms program in 1991 aiming to raise its
growth potential and integrating with the world economy.
Industrial policy reforms slowly but surely removed restrictions
on investment projects and business expansion on the one hand
and allowed increased access to foreign technology and funding
on the other. A series of measures that were directed towards
liberalizing foreign investment included:
International Journal of Scientific and Research Publications, Volume 5, Issue 10, October 2015 3
ISSN 2250-3153
www.ijsrp.org
1) Introduction of dual route of approval of FDI–RBI‟s
automatic route and Government’s approval (SIA/FIPB) route.
2) Automatic permission for technology agreements in high
priority industries and removal of restriction of FDI in low
technology areas as well as liberalisation of technology imports.
3) Permission to Non-resident Indians (NRIs) and Overseas
Corporate Bodies (OCBs) to invest up to 100 per cent in high
priorities sectors.
4) Hike in the foreign equity participation limits to 51 per
cent for existing companies and liberalisation of the use of
foreign “brands name”.
5) Signing the Convention of Multilateral Investment
Guarantee Agency (MIGA) for protection of foreign
Investments.
These efforts were boosted by the enactment of Foreign
Exchange Management Act (FEMA), 1999 [that replaced the
Foreign Exchange Regulation Act (FERA), 1973] which was less
stringent. In 1997, Indian Government allowed 100% FDI in
cash and carry wholesale and FDI in single brand retailing was
allowed 51% in June, 2006. After a long debate, further
amendment was made in December, 2012 which led FDI to
100% in single brand retailing and 51% in multiple brand
retailing.
IV. OBJECTIVES AND METHODOLOGY
A. Research Objectives :
 To discuss the FDI policy framework in India.
 To identify the various determinants of FDI.
 To understand the need for FDI in India.
 To Study the trends of FDI Flow in India during 2000-
01 to 2014-15 (up to June, 2015).
 To analysis the FDI flows as to identify country wise
approvals of FDI inflows to India.
 To analysis sector wise inflow of FDI in India.
 To identify the problems relating to low inflow of FDI
and to make suitable suggestions for attracting more
FDI inflow to India.
B. RESEARCH METHODOLOGY :
 Type of research: - Quantitative & Analytical
Research.
 Data: - Data of Manufacturing, Services &
Construction, Real estate, mining sectors etc.
from year April 2000 to June 2015 is
considered for the study.
 Data Collection Method: - Secondary data
from different web sites & reports of RBI,
CEDAR-USIBC report on FDI, reports of
Asian development bank.
 Sources of data collection: -
The study is based on published sources of data collected
from various sources. The data was extracted from the following
sources:
 Handbook of Statistics on the Indian economy,
RBI.
 Economic Survey, Government of India.
 Department of Industrial Policy and Promotion
(DIPP).
 Secretariat of Industrial Assistance (SIA).
 Central Statistical Organization (CSO).
This research is a descriptive study in nature. The secondary
data was collected from various journals, magazines, and
websites particularly from the Department of Industrial Policy &
Promotion, Ministry of Commerce and Industry, India stat etc.
Simple percentages have been used to defect the growth rate of
India. Graphs and tables have also been used where ever required
to depict statistical data of FDI during the study period. The time
period of the study has been taken from the April 2000 to June
2015.
CURRENT STATUS OF FDI IN INDIA RETAIL
SECTOR:-
As of June 2015, the Government of India allowed FDI in
single and multi brand retailing along with the following
conditions:-
1) Up to 100% FDI in single brand retail trading.
 By only one non-resident entity whether owner or the
brand or otherwise.
 30% domestic sourcing requirement eased to preferable
sourcing rather than compulsory.
 Further clarification on FDI companies that cannot
engage in B2C e-commerce.
 Products to be sold should be of a “single brand”.
Product should be sold under the same brand
internationally.
 “Single brand” product retailing would cover only
products, which are branded during manufacturing.
2) Up to 51% FDI in multi brand retail trading.
 At least 100 million US$ must be invested into Indian
company.
 At least 50% of the total FDI is to be invested in back
end infrastructure within 3 years.
 At least 30% of the value of procurement of processed
product shall be sourced from Indian small industry.
 Fresh agriculture produce is permitted to be sold
unbranded.
 Indian states have been given the discretion to accept of
refuse the implementation of FDI.
 Retail outlets can be set up in cities having population
of at least 1 million.
 Application needs to be approved by two levels at
Department of Industrial Policy and Promotion and
Foreign Investment Promotion Board.
CURRENT STATUS OF FDI IN INDIA SERVICE
SECTOR:-
FDI plays a major role in the dynamic growth of the service
sector. The service sector in India has tremendous growth
potential and as a result it attracts huge FDI.
International Journal of Scientific and Research Publications, Volume 5, Issue 10, October 2015 4
ISSN 2250-3153
www.ijsrp.org
 The Computer Software and Hardware enjoy the
permission of 100% FDI under automatic route.
 The limit of FDI in Telecom sector was increased from
49% to 74%. FDI up to 49% is permissible under
automatic route but FDI in the licensee company/Indian
promoters including their holding companies shall
require approval of FIPB.
PROBLEMS FOR LOW FDI FLOW TO INDIA:-
India, the largest democratic country with the second largest
population in the world, with rule of law and a highly educated
English speaking work force, the country is considered as a safe
haven for foreign investors.
Yet, India seems to be suffering from a host of self-imposed
restrictions and problems regarding opening its markets
completely too global investors by implementing full scale
economic reforms. Some of the major impediments for India’s
poor performance in the area of FDI are: political instability,
poor infrastructure, confusing tax and tariff policies, Draconian
labour laws, well entrenched corruption and governmental
regulations.
1. Lack of adequate infrastructure:
It is cited as a major hurdle for FDI inflows into India. This
bottleneck in the form of poor infrastructure discourages foreign
investors in investing in India. India’s age old and biggest
infrastructure problem is the supply of electricity. Power cuts are
considered as a common problem and many industries are forced
to close their business.
2. Stringent labor laws:
Large firms in India are not allowed to retrench or layoff any
workers, or close down the unit without the permission of the
state government. These laws protect the workers and thwart
legitimate attempts to restructure business. To retrench
unnecessary workers, firms require approval from both
employees and state governments-approval that is rarely given.
Further, Trade Unions extort huge sums from companies through
over-generous voluntary retirement schemes.
3. Corruption:
Corruption is found in nearly every public service, from
defense to distribution of subsidized food to the poor people, to
the generation and transmission of electric power. The
combination of legal hurdles, lack of institutional reforms,
bureaucratic decision-making and the allegations of corruption at
the top have turned foreign investors away from India.
4. Lack of decision making authority with the state
governments:
The reform process of liberalizing the economy is
concentrated mainly in the Centre and the State Governments are
not given much power. In most key infrastructure areas, the
central government remains in control. Brazil, China, and Russia
are examples where regional governments take the lead in
pushing reforms and prompting further actions by the central
government.
5. Limited scale of export processing zones:
India’s export processing zones have lacked dynamism
because of several reasons, such as their relatively limited scale;
the Government’s general ambivalence about attracting FDI; the
unclear and changing incentive packages attached to the zones;
and the power of the central government in the regulation of the
zones. India which established its first Export Processing Zone
(EPZ) in 1965 has failed to develop the zones when compared to
China which took initiative for establishment only in 1980.
6. High corporate tax rates:
Corporate tax rates in East Asia are generally in the range of
15 to 30 percent, compared with a rate of 48 percent for foreign
companies in India. High corporate tax rate is definitely a major
disincentive to foreign corporate investment in India.
7. Indecisive government and political instability:
There were too many anomalies on the government side
during past two decades and they are still affecting the direct
inflow of FDI in India such as mismanagement and oppression
by the different company, which affect the image of the country
and also deject the prospective investor, who is very much
conscious about safety and constant return on their investment.
DETERMINANTS OF FDI:-
The determinant varies from one country to another due their
unique characteristics and opportunities for the potential
investors. In specific the determinants of FDI in India are:
1) Stable policies:
India stable economic and socio policies have attracted
investors across border. Investors prefer countries which stable
economic policies. If the government makes changes in policies
which will have effect on the business. The business requires a
lot of funds to be deployed and any change in policy against the
investor will have a negative effect.
2) Economic factors:
Different economic factors encourage inward FDI. These
include interest loans, tax breaks, grants, subsidies and the
removal of restrictions and limitation. The government of India
has given many tax exemption and subsidies to the foreign
investors who would help in developing the economy.
3) Cheap and labour:
There is abundant labour available in India in terms of skilled
and unskilled human resources. Foreign investors will to take
advantage of the difference in the cost of labour as we have
cheap and skilled labours. Example: Foreign firms have invested
in BPO’s in India which require skilled labour and we have been
providing the same.
4) Basic infrastructure:
India though is a developing country, it has developed
special economic zone where there have focused to build
required infrastructure such as roads, effective transportation and
registered carrier departure worldwide, Information and
communication network/technology, powers, financial
institutions, and legal system and other basic amenities which are
must for the success of the business.
A sound legal system and modern infrastructure supporting
an efficient distribution of goods and services in the host country.
International Journal of Scientific and Research Publications, Volume 5, Issue 10, October 2015 5
ISSN 2250-3153
www.ijsrp.org
5) Unexplored markets:
In India there is large scope for the investors because there is
a large section of markets have not explored or unutilized. In
India there is enormous potential customer market with large
middle class income group who would be target group for new
markets.
Example: BPO was one sector where the investors had large
scope exploring the markets where the service was provided with
just a call, with almost customer satisfaction.
6) Availability of natural resources:
As we that India has large volume of natural resources such
as coal, iron ore, Natural gas etc. If natural resources are
available they can be used in production process or for extraction
of mines by the foreign investors.
V. NEED FOR FDI IN INDIA
As India is a developing country, capital has been one of the
scare resources that are usually required for economic
development. Capital is limited and there are many issues such as
Health, poverty, employment, education, research and
development, technology obsolesce, global competition.
The flow of FDI in India from across the world will help in
acquiring the funds at cheaper cost, better technology,
employment generation, and upgraded technology transfer, scope
for more trade, linkages and spillovers to domestic firms. The
following arguments are advanced in favour of foreign capital.
1) Sustaining a high level of investment:
As all the under-developed and the developing countries want
to industrialize and develop themselves, therefore it becomes
necessary to raise the level to investment substantially. Due to
poverty and low GDP the saving are low. Therefore there is a
need to fill the gap between income and savings through foreign
direct investments.
2) Technological gap:
In Indian scenario we need technical assistance from foreign
source for provision if expert services, training of Indian
personnel and educational, research and training institutions in
the industry. It only comes through private foreign investment or
foreign collaborations.
3) Exploitation of natural resources:
In India we have abundant natural resources such as coal,
iron and steel but to extract the resources we require foreign
collaboration.
4) Understanding the initial risk:
In developing countries as capital is a scare resource, the risk
of investments in new ventures or projects for industrialization is
high. Therefore foreign capital helps in these investments which
require high risk.
5) Development of basic economic infrastructure:
In the recent years foreign financial institutions and
government of advanced countries have made substantial capital
available to the under developed countries. FDI will help in
developing the infrastructure by establishing firm’s different
parts of the country.
There are special economic zones which have been
developed by government for improvising the industrial growth.
6) Improvement in the balance of payments position:
The inflow FDI will help in improving the balance of
payment. Firms which feel that the goods produced in India will
have a low cost, will produce the goods and export the same to
other country. This helps in increasing the exports.
7) Foreign firm’s helps in increasing the competition:
Foreign firms have always come up with better technology,
process, and innovations comparing with the domestic firms.
They develop a completion in which the domestic firms will
perform better it survive in the market.
VI. DATA ANALYSIS AND INTERPRETATION
Fact sheet on foreign direct investment (FDI)
Table No. 1
Total FDI Inflows
(From April, 2000 to June, 2015):-
1
CUMULATIVE AMOUNT OF FDI INFLOWS
US$
(Equity inflows + ‘Re-invested earnings’ +‘Other capital’)
- 380,215
Million
2 CUMULATIVE AMOUNT OF FDI EQUITY INFLOWS Rs. US$
(excluding, amount remitted through RBI’s NRI Schemes) 1,293,303 258,020
Crore Million
International Journal of Scientific and Research Publications, Volume 5, Issue 10, October 2015
6
ISSN 2250-3153
www.ijsrp.org
Source: FDI Statistics, Department of Industrial Policy& Promotion, Ministry of Commerce & Industry, Government of
India, 2015.
Table 1 shows the amount of FDI inflows from April, 2000 to June, 2015. It shows the cumulative amount of FDI
Inflows both in terms of Crore and in US $ million.
Point 1 shows the sum of equity inflows, reinvested earnings and other capital. Cumulative amount of inflows are
380,215 in US $ million. Other than this, cumulative FDI equity inflows which excludes amount remitted through RBI’s-NRI
schemes are 1,293,303 in Crore and 258,020 in US $ million.
Table No. 2
FDI Inflows during Financial Year
2015-16 (June, 2015):-
1. TOTAL FDI INFLOWS INTO INDIA US$
(Equity inflows + ‘Re-invested earnings’ + ‘Other
capital’) - 2,929
(As per RBI’s Monthly bulletin dated: 10.08.2015). Million
2.
FDI EQUITY INFLOWS
Rs. US$
13,115 2,054
Crore Million m
Source: FDI Statistics, Department of Industrial Policy& Promotion, Ministry of Commerce & Industry, Government of
India, 2015.
Table 2 shows the amount of FDI inflows during the Financial Year, 2015(June). It shows the total amount of FDI
Inflows both in terms of Crore and in US $ million.
Point 1 shows the sum of equity inflows, reinvested earnings and other capital. Total amount of inflows are 2,929 in US
$ million. Point 2 shows the FDI equity inflows amounted 13,115 in Crore and 2,054 in US $ million.
International Journal of Scientific and Research Publications, Volume 5, Issue 10, October 2015 7
ISSN 2250-3153
www.ijsrp.org
Table No. 3
FDI Equity Inflows (Month-wise) during the Financial Year 2015-16:-
Financial Year 2015-16 Amount of FDI Equity inflows
( April-March ) (In Rs. Crore)
(In US$
mn)
1. April, 2015 22,620 3,605
2. May, 2015 24,564 3,850
3. June, 2015 13,115 2,054
2015-16 (from April, 2015 to June, 2015) 60,299 9,508
2014-15 (from April, 2014 to June, 2014) 43,171 7,235
%age growth over last year ( + ) 40 % ( + ) 31%
Source: FDI Statistics, Department of Industrial Policy& Promotion, Ministry of Commerce & Industry, Government of India, 2015.
The above Table 3 shows the amount of FDI inflows during Financial Year from April, 2015 to March, 2016 (up to June, 2015). It
shows the amount in Rs Crore and in US $ mn. The highest FDI inflows in the country is in the month of May 2015 i.e. 24,564 in Rs
Crore and 3,850 in US $ mn. Followed by April, 2015 and June, 2015 with inflows 22,620 in Rs. Crore (3,605 in US$ mn) and 13,115 in
Rs. Crore (2,045 in US$ mn) respectively. It can also be observed that there is 40% growth over last year.
Table No. 4
FDI Equity Inflows (Month-wise) during the Calendar Year 2015:
Calendar Year 2015 Amount of FDI Equity inflows
(Jan.-Dec.) (In Rs. Crore) (In US$ mn)
1. January, 2015 27,880 4,481
2. February, 2015 20,397 3,288
3. March, 2015 13,221 2,117
4. April, 2015 22,620 3,605
5. May, 2015 24,564 3,850
6. June, 2015 13,115 2,054
Year 2015 (up to June, 2015) # 121,797 19,394
Year 2014 (up to June, 2014) # 90,876 14,975
%age growth over last year ( + ) 34 % ( + ) 30%
International Journal of Scientific and Research Publications, Volume 5, Issue 10, October 2015 8
ISSN 2250-3153
www.ijsrp.org
Source: FDI Statistics, Department of Industrial Policy& Promotion, Ministry of Commerce & Industry, Government of India, 2015.
The above Table 4 shows the amount of FDI inflows during the Calendar Year January, 2015 to December, 2015(up to June, 2015).
It shows the amount in Rs Crore and in US $ mn. The highest FDI inflows in the country is in the month January 2015 i.e. 27,880 in Rs
Crore and 4,481 in US $ mn. Month like January 2014 have 13,589 in Rs Crore and 2,189 in US $ mn. Comparing both we can observe
that there is a 34% growth in FDI inflow.
Table No. 5
Share of Top Investing Countries FDI Equity Inflows (Financial Years):-
Amount Rupees in Crores (US$ in
millions)
Ranks Country 2013-14 2014-15 2015-16 Cumulative %age to total
( April - (April – (April,15 – Inflows Inflows
March) March) June, 15 ) (April ’00 - (in terms
June ‘15) of US $)
1. MAURITIUS
29,360 55,172 13,236 438,892
35 %
(4,859) (9,030) (2,089) (89,644)
2. SINGAPORE
35,625 41,350 23,320 190,477
14 %
(5,985) (6,742) (3,673) (35,861)
3. U.K.
20,426 8,769 755 110,409
9 %
(3,215) (1,447) (119) (22,329)
4. JAPAN
10,550 12,752 2,916 96,312
7 %
(1,718) (2,084) (459) (18,811)
5. NETHERLANDS
13,920 20,960 4,123 81,381
6 %
(2,270) (3,436) (652) (15,323)
6. U.S.A.
4,807 11,150 3,959 70,839
6 %
(806) (1,824) (627) (14,378)
7. GERMANY
6,093 6,904 3,497 42,007
3 %
(1,038) (1,125) (554) (8,198)
8. CYPRUS
3,401 3,634 608 39,971
3 %
(557) (598) (96) (8,140)
9 FRANCE
1,842 3,881 877 23,465
2 %
(305) (635) (138) (4,651)
10. SWITZERLAND
2,084 2,066 598 15,812
1 %
(341) (337) (94) (3,139)
TOTAL FDI INFLOWS
FROM 147,518 189,107 60,298 1,293,836
-ALL COUNTRIES *
(24,299)
(30,931) (9,508) (258,141)
International Journal of Scientific and Research Publications, Volume 5, Issue 10, October 2015 9
ISSN 2250-3153
www.ijsrp.org
Source: FDI Statistics, Department of Industrial Policy& Promotion, Ministry of Commerce & Industry, Government of India,
2015.
The above Table No.5 depicts the country having the highest FDI in India. The report shows that the MAURITIUS country has the
highest foreign investor in India with 34%. After Mauritius, Singapore and U.K. invest the highest FDI in India with 14% and 9%
respectively. Japan also gets 4th position with 7% FDI in India.
Table No. 6
SECTORS ATTRACTING HIGHEST FDI EQUITY INFLOWS:
Amount in Rs. Crores (US$ in millions)
Ranks Sector 2013-14 2014-15 2015-16 Cumulative % age to total
(April - (April- (April,15 – Inflows Inflows
March) March) June, 15 ) (April ’00 - (In terms of
June ‘15) US$)
1. SERVICES SECTOR 13,294 19,963 4,036 209,578
17 %
(2,225) (3,253) (636) 43,350)
2.
CONSTRUCTION
DEVELOPMENT: 7,508 4,582 216 113,355
TOWNSHIPS, HOUSING,
BUILT-UP (1,226) (758) (34) (24,098) 9 %
INFRASTRUCTURE
3. COMPUTER SOFTWARE & 6,896 13,564 16,245 89,481
7 %
HARDWARE
(1,126) (2,200) (2,556) (17,575)
4. TELECOMMUNICATIONS 7,987 17,372 2,517 86,609
7 %
(radio paging, cellular mobile,
basic (1,307) (2,895) (395) (17,453)
telephone services)
5. AUTOMOBILE INDUSTRY 9,027 15,794 6,914 70,906
5 %
(1,517) (2,570) (1,094) (13,477)
6.
DRUGS &
PHARMACEUTICALS 7,191 9,211 1,370 66,652
5 %
(1,279)
(1,523)
(215) (13,336)
7. CHEMICALS (OTHER THAN 4,738 4,077 1,598 50,909
4 %
FERTILIZERS) (878) (669) (251) (10,588)
8. POWER 6,519 3,985 1,717 48,357
4 %
(1,066) (657) (271) (9,828)
9.
TRADING
8,191 16,962 5,679 49,479 4 %
(1,343) (2,761) (897) (8,958)
10 METALLURGICAL
INDUSTRIES
3,436 2,897 845 41,992
3 %
(568) (472) (133) (8,680)
International Journal of Scientific and Research Publications, Volume 5, Issue 10, October 2015 10
ISSN 2250-3153
www.ijsrp.org
Source: FDI Statistics, Department of Industrial Policy& Promotion, Ministry of Commerce & Industry, Government of
India, 2015.
The above Table No.6 depicts the sector having the highest FDI equity inflow in India. The report shows that Service sector has the
highest FDI Equity inflow 17%, followed by Construction development, Computer Software and Hardware, Telecommunication,
Automobile Industry sector having 9%, 7%, 7%, and 5% respectively.
Other sectors like Drugs and Pharmaceuticals carries 5% and Chemicals, Power, Trading Industries carries 4% FDI inflow each ,
whereas the least is of Metallurgical industries – 3%.
Table No. 7
FINANCIAL YEAR-WISE FDI INFLOWS DATA:
I. As per International Best Practices.
Amount in (US$ in millions)
S. Financial Year
FOREIGN DIRECT INVESTMENT (FDI)
Investment
No. (April-March) by FII’s
Equity
Re- Other
FDI FLOWS INTO
INDIA
Foreign
invested capital Institutional
earnings +
l Investors
RBI’s capital of
+
%age Fund
Automatic unincorpora
growth (net)
Route/ ted bodies
Total over
Acquisition
FDI previous
Route
Flows year
(in US$
terms)
FINANCIAL YEARS 2000-01 to 2015-16 (up to JUNE, 2015)
1. 2000-01 2,339 61 1,350 279 4,029 - 1,847
2. 2001-02 3,904 191 1,645 390 6,130 (+) 52 % 1,505
3. 2002-03 2,574 190 1,833 438 5,035 (-) 18 % 377
4. 2003-04 2,197 32 1,460 633 4,322 (-) 14 % 10,918
5. 2004-05 3,250 528 1,904 369 6,051 (+) 40 % 8,686
6. 2005-06 5,540 435 2,760 226 8,961 (+) 48 % 9,926
7. 2006-07 15,585 896 5,828 517 22,826
(+) 155
% 3,225
8. 2007-08 24,573 2,291 7,679 300 34,843 (+) 53 % 20,328
9. 2008-09 31,364 702 9,030 777 41,873 (+) 20 % (-) 15,017
10. 2009-10 25,606 1,540 8,668 1,931 37,745 (-) 10 % 29,048
11. 2010-11 (P) 21,376 874 11,939 658 34,847 (-) 08 % 29,422
12. 2011-12 (P) 34,833 1,022 8,206 2,495 46,556 (+) 34 % 16,812
13. 2012-13 (P) 21,825 1,059 9,880 1,534 34,298 (-) 26% 27,582
14 2013-14 (P) 24,299 975 8,978 1,794 36,046 ( + ) 5% 5,009
15. 2014-15 (P) 30,933 952 8,983 3,423 44,291 ( + ) 23%40,923
16.
2015-16 (P) (Apr - June
2015) 9,508 223 2,059 572 12,362 (-) 1,642
CUMULATIVE TOTAL
259,706 11,971 92,202 16,336 380,215 - 188,949(from April, 2000 to June, 2015)
International Journal of Scientific and Research Publications, Volume 5, Issue 10, October 2015 11
ISSN 2250-3153
www.ijsrp.org
Source:
RBI’s Bulletin July, 2015 dt.10.08.2015 (Table No. 34 – FOREIGN INVESTMENT
INFLOWS).
Table No. 8
II. DIPP’s – Financial Year-wise FDI Equity Inflows:
(As per DIPP’s FDI data base – equity capital components only):
S. No. Financial Year Amount of FDI Inflows %age growth
(April – March) over previous
FINANCIAL YEARS 2000-01 to 2015-16 (up to June,
2015)
In Rs Crores
In US$
million
year (in terms of
US $)
1. 2000-01 10,733 2,463 -
2. 2001-02 18,654 4,065 ( + ) 65 %
3. 2002-03 12,871 2,705 ( - ) 33 %
4. 2003-04 10,064 2,188 ( - ) 19 %
5. 2004-05 14,653 3,219 ( + ) 47 %
6. 2005-06 24,584 5,540 ( + ) 72 %
7. 2006-07 56,390 12,492 (+ )125 %
8. 2007-08 98,642 24,575 ( + ) 97 %
9. 2008-09 142,829 31,396 ( + ) 28 %
10. 2009-10 123,120 25,834 ( - ) 18 %
11. 2010-11 97,320 21,383 ( - ) 17 %
12. 2011-12 165,146 35,121 (+) 64 %
13. 2012-13 121,907 22,423 (-) 36 %
14. 2013-14 147,518 24,299 (+) 8%
15. 2014-15 189,107 30,931 (+) 27%
16. 2015-16 (Apr - June 2015) 60,298 9,508
CUMULATIVE TOTAL (from April, 2000 to June,
2015) 1,293,836 258,142 -
Source: RBI’s Bulletin July, 2015 dt.10.08.2015 (Table No. 34 – FOREIGN INVESTMENT INFLOWS).
The above Table No. 8 shows the total amount of FDI inflows in India during the last 15 years i.e. 2000 to 2015. The FDI inflow
from 2000-2001 i.e. 10,733 Crore Rs. in 2001-02 it was 18,654 Crore rupees.
It shows the Good result in the FDI inflows in India. Little bit ups and downs in FDI inflows up to 2005-06, but after that great hike in
the year 2007-08 i.e. 98,642crore rupees as compare to earlier years.
In 2008-2009 there was a huge investment in FDI in 142,829 Crore Rupees and so on. But again there were some fluctuations in
inflow of FDI in the years between 2010-2014,soon giving the highest figures in last 15 years 1,89,107 Crore Rupees FDI in 2014-2015
So we can say that the foreign investment have been on rise in India. Currently the inflow of FDI from April, 2015 to June, 2015 figures
60,298.
Table No. 9
III. RBI’S REGIONAL OFFICES (WITH STATE COVERED)
RECEIVED FDI EQUITY INFLOWS
(From April, 2000 to June, 2015)
Amount Rupees in Crores (US$ in millions)
S. RBI’s - Regional State covered 2013-14 2014-15 2015-16 Cumulative %age to
No. Office2
( April - ( April - (April,15 Inflows total
March) March) – June, 15 ) (April ’00 - Inflows
June ‘15) (in terms
of US$)
1 MUMBAI
MAHARASHTR
A, 20,595 38,933 12,538 365,560 29
DADRA & (3,420) (6,361) (1,979) (75,097)
International Journal of Scientific and Research Publications, Volume 5, Issue 10, October 2015 12
ISSN 2250-3153
www.ijsrp.org
NAGAR
HAVELI,
DAMAN & DIU
2 NEW DELHI
DELHI, PART
OF 38,190 42,252 19,892 268,915 20
UP AND (6,242) (6,875) (3,128) (52,539)
HARYANA
3 CHENNAI TAMIL NADU, 12,595 23,361 5,828 94,595 7
PONDICHERR
Y (2,116) (3,818) (924) (17,938)
4 BANGALORE KARNATAKA 11,422 21,255 8,447 90,569 7
(1,892) (3,444) (1,336) (17,456)
5 AHMEDABAD GUJARAT 5,282 9,416 4,732 58,529 5
(860) (1,531) (745) (11,786)
6 HYDERABAD ANDHRA 4,024 8,326 2,681 51,921 4
PRADESH (678) (1,369) (422) (10,437)
7 KOLKATA
WEST
BENGAL, 2,659 1,464 689 15,316 1
SIKKIM, (436) (239) (108) (3,089)
ANDAMAN &
NICOBAR
ISLANDS
8 CHANDIGARH` CHANDIGARH,562 234 91 6,452 1
PUNJAB, (91) (39) (14) (1,345)
HARYANA,
HIMACHAL
PRADESH
9 JAIPUR RAJASTHAN 233 3,237 109 6,904 1
(38) (541) (17) (1,281)
10. BHOPAL MADHYA 708 601 9 6,105 1
PRADESH, (119) (100) (2) (1,217)
CHATTISGAR
H
11 KOCHI KERALA, 411 1,418 35 6,186 1
LAKSHADWEE
P (70) (230) (6) (1,216)
12 PANAJI GOA 103 211 81 3,949 0.3
(17) (35) (13) (836)
13 KANPUR UTTAR 150 679 137 2,581 0.2
PRADESH, (25) (110)
(22)
(504)
UTTRANCHAL
14
BHUBANESHWA
R ORISSA 288 56 3 1,964 0.2
(48) (9) (0.4) (398)
15 GUWAHATI ASSAM, 4 29 37 418 0.03
ARUNACHAL (0.6) (5) (6 (89)
PRADESH,
MANIPUR,
MEGHALAYA,
MIZORAM,
NAGALAND,
TRIPURA
16 PATNA BIHAR, 9 68 234 501 0.03
JHARKHAND (1) (11) (37) (87)
17 JAMMU JAMMU & 1 25 0.00 26 0.00
International Journal of Scientific and Research Publications, Volume 5, Issue 10, October 2015 13
ISSN 2250-3153
www.ijsrp.org
KASHMIR (0.2) (4) (0.00) (4)
18 REGION NOT INDICATED 50,283 37,544 4,754 (750) 312,814 24
(8,245) (6,211) (62,700)
SUB. TOTAL 147,518 189,107 60,298 1,293,303
(24,299) (30,931) (9,508) (258,020)
19 RBI’S-NRI SCHEMES 0 0 0 533 -
(from 2000 to
2002) (121)
GRAND TOTAL 147,518 189,107 60,298 1,293,836 -
(24,299) (30,931) (9,508)) (258,141)
The above table represents region-wise FDI equity inflows from 2000-15 both in terms of ` Crore and US $ million. Table shows that
Mumbai has registered largest FDI inflow (365,560 Crore) amounting to 29% of total inflow received in last 15 years. New Delhi is the
second preferred region for FDI inflow (268,915 Crore) with 20% of total inflows received in last 15 years. This is due to good quality
infrastructure and better quality of life provided in these cities.
Other regions like Bangalore (90,569 Crore), Chennai (94,595 Crore), Ahmedabad (58,529 Crore), Hyderabad (51,921 Crore) have
also recorded FDI with 7%, 7%, 5% and 4% of total FDI in the country respectively.
Bangalore is the primary destination for property investment and the city has riding high on the Information Technology (IT). Other
regions like Kolkata (15,316 Crore), Chandigarh (6,452 Crore), Jaipur (6,904 Crore) and Bhopal (6,105 Crore) have been able to attract
very less FDI because they lack in infrastructure and information technology (IT) developments.
Sectors like service, construction developments, telecommunications and computer software & hardware have been registering
highest FDI inflows in India. Therefore, Mumbai, New Delhi, Bangalore and Chennai are the favourite destinations for FDI in India.
Table No. 10
Statement on Country-wise FDI Equity Inflows
From April 2000 to June 2015
Sr.No Name of the Country Amount of Foreign Direct Investment Inflows %age with Inflows
(In Rs Crore) (In US$ million)
1. Mauritius 438,892.83 89,644.04 34.74
2. Singapore 190,477.19 35,860.84 13.90
3. United Kingdom 110,409.19 22,329.12 8.65
4. Japan 96,312.05 18,811.08 7.29
5. Netherlands 81,381.00 15,323.43 5.94
6. U.S.A 70,838.85 14,377.97 5.57
7. Germany 42,006.79 8,197.45 3.18
8. Cyprus 39,971.34 8,139.55 3.15
9. France 23,464.77 4,651.30 1.80
10. Switzerland 15,812.31 3,138.47 1.22
11. UAE 15,633.58 3,125.58 1.21
12. Spain 10,938.49 2,115.93 0.82
13. Italy 8,207.00 1,651.98 0.64
International Journal of Scientific and Research Publications, Volume 5, Issue 10, October 2015 14
ISSN 2250-3153
www.ijsrp.org
14. South Korea 8,097.50 1,602.61 0.62
15. Hong Kong 7,970.71 1,557.56 0.60
16. Luxembourg 7,345.75 1,306.38 0.51
17. Cayman Islands 5,861.47 1,214.92 0.47
18. China 6,941.05 1,160.64 0.45
19. Sweden 5,342.40 1,103.84 0.43
20. Russia 5,874.87 1,070.57 0.41
21. British Virginia 3,993.91 858.89 0.33
22. Belgium 4,255.84 814.58 0.32
23. Malaysia 3,894.87 744.14 0.29
24. Australia 3,463.02 695.21 0.27
25. Indonesia 2,902.07 623.09 0.24
26. Poland 3,300.58 619.56 0.24
27. Canada 2,776.75 559.60 0.22
28. The Bermudas 2,252.20 502.07 0.19
29. Denmark 2,085.54 417.37 0.16
30. Oman 1,797.55 380.15 0.15
31. Finland 1,799.71 354.10 0.14
32. Ireland 1,759.34 332.37 0.13
33. South Africa 1,537.33 290.01 0.11
34. Austria 1,292.03 252.68 0.10
35. Thailand 1,105.29 207.27 0.08
36. Seychelles 1,107.50 183.69 0.07
37. Norway 941.15 181.16 0.07
38. Chile 710.49 150.23 0.06
39. Morocco 654.96 137.85 0.05
International Journal of Scientific and Research Publications, Volume 5, Issue 10, October 2015 15
ISSN 2250-3153
www.ijsrp.org
40. Philippines 765.53 129.03 0.05
41. Turkey 696.10 127.70 0.05
42. British Isles 463.88 100.65 0.04
Sr.No Name of the Country Amount of Foreign Direct Investment Inflows %age with Inflows
(In Rs Crore) (In US$ million)
43. Taiwan 512.88 99.78 0.04
44. Israel 445.28 87.02 0.03
45. Mexico 438.76 80.08 0.03
46. West Indies 348.17 78.28 0.03
47. Saudi Arabia 300.70 58.13 0.02
48. St. Vincent 277.61 53.44 0.02
49. New Zealand 266.11 52.01 0.02
50. Virgin Islands(US) 278.61 50.73 0.02
51. Bahrain 275.46 52.86 0.02
52. Panama 204.45 43.69 0.02
53. Bahamas 190.35 38.66 0.01
54. Sri Lanka 189.72 37.71 0.01
55. Korea(North) 188.88 37.22 0.01
56. Saint Kitts & Nevis 148.66 33.66 0.01
57. Channel Islands 173.21 31.90 0.01
58. Portugal 160.21 31.75 0.01
59. Jordan 159.58 29.30 0.01
60. Kuwait 143.68 27.96 0.01
61. Kazakhstan 134.16 26.11 0.01
62. Brazil 116.68 23.60 0.01
63. Kenya 102.52 21.75 0.01
International Journal of Scientific and Research Publications, Volume 5, Issue 10, October 2015 16
ISSN 2250-3153
www.ijsrp.org
64. Czech Republic 99.97 21.37 0.01
65. Iceland 93.72 21.14 0.01
66. Bermuda 127.07 20.31 0.01
67. Gibraltar 85.36 19.79 0.01
68. Hungary 90.77 17.23 0.01
69. Isle of Man 82.23 15.58 0.01
70. Malta 69.10 14.65 0.01
71. Liberia 64.54 14.56 0.01
72. Nigeria 66.39 13.22 0.01
73. Scotland 73.29 12.83 0.00
74. Belarus 50.52 12.27 0.00
75. SAMOA ISLANDS 74.13 11.83 0.00
76. Argentina 46.35 10.17 0.00
77. Liechtenstein 47.69 9.49 0.00
78. Myanmar 35.75 8.96 0.00
79. Slovenia 40.58 8.49 0.00
80. Ghana 40.53 7.68 0.00
81. Romania 37.86 7.01 0.00
82. Greece 36.07 6.52 0.00
83. Maldives 26.85 5.84 0.00
84. Belize 25.68 5.61 0.00
85. Slovakia 23.89 5.42 0.00
86. Qatar 28.51 5.16 0.00
87. Rep. of Fiji Islands 22.30 5.07 0.00
International Journal of Scientific and Research Publications, Volume 5, Issue 10, October 2015 17
ISSN 2250-3153
www.ijsrp.org
88. Uruguay 21.38 4.49 0.00
Sr.No Name of the Country Amount of Foreign Direct Investment Inflows %age with Inflows
(In Rs Crore) (In US$ million)
89. Tunisia 19.84 4.31 0.00
90. Guernsey 23.84 4.30 0.00
91. Ukraine 21.80 3.81 0.00
92. Egypt 17.90 3.30 0.00
93. Colombia 14.18 2.59 0.00
94. West Africa 12.31 2.47 0.00
95. Trinidad & Tobago 12.73 2.34 0.00
96. Nepal 9.71 2.03 0.00
97. Yemen 7.74 1.87 0.00
98. Tanzania 8.35 1.74 0.00
99. Lebanon 9.70 1.67 0.00
100 Monaco 7.49 1.52 0.00
101 SAN MARINO 9.41 1.52 0.00
102 Bulgaria 8.21 1.41 0.00
103 Uganda 5.07 1.10 0.00
104 Cuba 4.73 1.04 0.00
105 Guyana 4.60 1.00 0.00
106 Vanuatu 4.41 0.94 0.00
107 Togolese Republic 4.65 0.86 0.00
108 Botswana 3.79 0.60 0.00
109 Iran 3.30 0.57 0.00
110 Estonia 2.99 0.57 0.00
111 Congo (DR) 2.41 0.54 0.00
International Journal of Scientific and Research Publications, Volume 5, Issue 10, October 2015 18
ISSN 2250-3153
www.ijsrp.org
112 Croatia 2.29 0.52 0.00
113 Jamaica 2.70 0.50 0.00
114 TAJIKISTAN 2.87 0.46 0.00
115 Vietnam 2.33 0.43 0.00
116 Aruba 1.96 0.43 0.00
117 Anguilla 1.47 0.29 0.00
118 Lithuania 1.84 0.29 0.00
119 Yugoslavia 1.13 0.24 0.00
120 Iraq 1.02 0.22 0.00
121 Zambia 0.88 0.18 0.00
122 Peru 0.82 0.14 0.00
123 Latvia 0.52 0.10 0.00
124 Georgia 0.62 0.10 0.00
125 St. Lucia 0.61 0.10 0.00
126 SURINAME 0.54 0.09 0.00
127 Libya 0.28 0.07 0.00
128 Mongolia 0.27 0.06 0.00
129 Bangladesh 0.31 0.05 0.00
130 Sudan 0.24 0.05 0.00
131 Costa Rica 0.29 0.05 0.00
132 Afghanistan 0.12 0.03 0.00
133 Muscat 0.06 0.01 0.00
134 Venezuela 0.03 0.01 0.00
International Journal of Scientific and Research Publications, Volume 5, Issue 10, October 2015 19
ISSN 2250-3153
www.ijsrp.org
Sr.No Name of the Country Amount of Foreign Direct Investment Inflows %age with Inflows
(In Rs Crore) (In US$ million)
135 Algeria 0.03 0.00 0.00
136 East Africa 0.02 0.00 0.00
137 Cameroon 0.01 0.00 0.00
138 Bolivia 0.01 0.00 0.00
139 Barbados 0.01 0.00 0.00
140 Kyrgyzstan 0.01 0.00 0.00
141 Djibouti 0.00 0.00 0.00
142 Paraguay 0.00 0.00 0.00
143 MOZAMBIQUE 0.00 0.00 0.00
144 SENEGAL 0.00 0.00 0.00
145 Ivory Coast 0.00 0.00 0.00
146 FII's 0.25 0.06 0.00
147 NRI 20,383.66 4,684.25 1.82
148 Country Details Awaited 30,875.37 6,964.32 2.70
Source: (i) RBI’s Bulletin July, 2015 dt.10.08.2015.
1,293,302.75 258,020.10
Sub Total
149 RBI’S-NRI SCHEMES (2000- 533.06 121.33
2002)
Grand Total 1,293,835.81 258,141.43
International Journal of Scientific and Research Publications, Volume 5, Issue 10, October 2015 20
ISSN 2250-3153
www.ijsrp.org
Table No. 11
STATEMENT ON SECTOR-WISE FDI EQUITY INFLOWS
FROM APRIL, 2000 TO JANUARY, 2015
Sr.
No Sector Amount of FDI Inflows %age of
Total
Inflows
(In Rs (In US$
Crore) millions)
1 Services Sector 201,728.28 42,101.98 17.32
2 Construction Development: Townships, Housing, Built-Up 112,916.36 24,028.19 9.88
Infrastructure And Construction-Development Projects
3 Telecommunications 83,697.07 16,994.68 6.99
4 Computer Software & Hardware 67,693.78 14,125.19 5.81
5 Drugs & Pharmaceuticals 63,629.47 12,856.02 5.29
6 Automobile Industry 60,725.08 11,857.11 4.88
7 Chemicals (Other Than Fertilizers) 48,641.77 10,229.69 4.21
8 Power 46,358.87 9,512.02 3.91
9 Metallurgical Industries 40,737.61 8,480.90 3.49
10 Hotel & Tourism 40,198.41 7,774.03 3.20
11 Trading 41,315.28 7,660.73 3.15
12 Petroleum & Natural Gas 31,650.29 6,519.53 2.68
13 Food Processing Industries 36,360.11 6,215.46 2.56
14 Miscellaneous Mechanical & Engineering Industries 20,572.50 3,948.17 1.62
15 Information & Broadcasting (Including Print Media) 19,156.59 3,890.94 1.60
16 Electrical Equipments 18,298.41 3,786.22 1.56
17 Non-Conventional Energy 18,524.21 3,521.78 1.45
18 Industrial Machinery 18,420.29 3,515.67 1.45
19 Cement And Gypsum Products 14,625.29 3,085.60 1.27
20 Construction (Infrastructure) Activities 14,807.38 2,923.64 1.20
21 Hospital & Diagnostic Centers 14,565.34 2,793.72 1.15
22 Consultancy Services 13,908.16 2,786.52 1.15
International Journal of Scientific and Research Publications, Volume 5, Issue 10, October 2015 21
ISSN 2250-3153
www.ijsrp.org
23 Fermentation Industries 11,347.67 2,137.36 0.88
24 Agriculture Services 8,625.15 1,744.02 0.72
25 Rubber Goods 9,445.03 1,722.64 0.71
26 Mining 8,460.61 1,668.50 0.69
27 Ports 6,730.91 1,637.30 0.67
28 Textiles (Including Dyed, Printed) 7,710.42 1,555.69 0.64
29 Electronics 6,752.74 1,417.42 0.58
30 Sea Transport 6,546.83 1,368.93 0.56
31 Prime Mover (Other Than Electrical Generators) 6,299.78 1,200.92 0.49
32 Education 5,649.81 1,071.50 0.44
33 Paper And Pulp (Including Paper Products) 4,327.04 910.25 0.37
34 Medical And Surgical Appliances 4,608.04 887.09 0.36
35 Soaps, Cosmetics & Toilet Preparations 4,430.06 848.74 0.35
36 Machine Tools 3,511.68 711.51 0.29
37 Ceramics 3,321.89 699.57 0.29
International Journal of Scientific and Research Publications, Volume 5, Issue 10, October 2015 22
ISSN 2250-3153
www.ijsrp.org
Sr.No Sector Amount of FDI Inflows %age of
Total
Inflows
(In Rs (In US$
Crore) millions)
38 Railway Related Components 3,425.97 634.20 0.26
39 Diamond, Gold Ornaments 2,904.78 569.14 0.23
40 Air Transport (Including Air Freight) 2,720.46 562.65 0.23
41 Fertilizers 2,915.62 543.14 0.22
42 Vegetable Oils And Vanaspati 2,861.12 541.65 0.22
43 Glass 2,362.19 459.16 0.19
44 Printing Of Books (Including Litho Printing Industry) 2,326.52 446.09 0.18
45 Agricultural Machinery 2,127.62 413.93 0.17
46 Commercial, Office & Household Equipments 1,516.81 309.34 0.13
47 Retail Trading (Single Brand) 1,549.92 275.38 0.11
48 Earth-Moving Machinery 1,138.86 234.81 0.10
49 Scientific Instruments 960.98 171.98 0.07
50 Leather, Leather Goods And Pickers 709.83 137.92 0.06
51 Tea And Coffee (Processing & Warehousing Coffee & Rubber) 497.78 108.41 0.04
52 Timber Products 537.09 101.93 0.04
53 Sugar 405.65 78.07 0.03
54 Dye-Stuffs 417.28 74.38 0.03
55 Photographic Raw Film And Paper 273.76 67.29 0.03
56 Industrial Instruments 310.86 67.11 0.03
57 Boilers And Steam Generating Plants 314.80 63.33 0.03
58 Glue And Gelatin 211.68 37.86 0.02
59 Coal Production 119.19 27.73 0.01
60 Mathematical, Surveying And Drawing Instruments 39.80 7.98 0.00
International Journal of Scientific and Research Publications, Volume 5, Issue 10, October 2015 23
ISSN 2250-3153
www.ijsrp.org
Source: (i) RBI’s Bulletin July, 2015 dt.10.08.2015.
 GRAPHICAL REPRESENTATION OF THE ABOVE TABLES :-
I. Graph 1(Table 5) :-
The largest inflows of FDI’s over the period of April 2000 to June 2015 have been received from Mauritius, its share in these
inflows have being as high as 35%. Singapore is second with a share of 14%. The other major sources of foreign direct investment are
from UK, Japan, Netherlands, U.S.A., Cyprus, Germany, France, Switzerland and their respective share of inflow of FDI are 9%, 7%,
6%, 6%, 3%, 3%, 2%, and 1`% respectively.
The inflows from U.S.A are routed through Mauritius due to tax advantage. The tax advantage emanates from the double tax
avoidance agreement that India has with that country USA. This agreement means that any foreign investor has the option of paying
tax either in India or in Mauritius.
61 Defense Industries 24.84 5.02 0.00
62 Coir 22.05 4.07 0.00
63 Miscellaneous Industries 42,392.57 8,975.05 3.69
Sub Total 1,199,386.19 243,106.84 100
64 RBI’s- NRI Schemes (2000-2002) 533.06 121.33 -
Grand Total 1,199,919.25 243,228.17
International Journal of Scientific and Research Publications, Volume 5, Issue 10, October 2015 24
ISSN 2250-3153
www.ijsrp.org
The tax rates in Mauritius are amongst the lowest in the world. The other big investors included Singapore, the US, Britain and
the Netherlands. While investors get higher returns on their money in India, those from Mauritius “get even higher returns on their
capital as we have a double taxation avoidance treaty (DTAT) (with the island nation),” Crisil principal economist, Mr. D.K. Joshi.
There have been changes in the source countries due to the change of policies in 1991. Prior to 1991, India depended on a few
developed western countries for capital. These included countries like Israel, Australia, South Korea, Malaysia; Singapore etc. after
the policies have been implemented countries which did not had any share in India’s FDI such as Thailand, Saudi Arabia and South
Africa etc.
II. Graph 2(Table 6) :-
International Journal of Scientific and Research Publications, Volume 5, Issue 10, October 2015 25
ISSN 2250-3153
www.ijsrp.org
SECTORAL COMPOSITION OF FDI:-
The Sectoral composition of FDI over the period of April 2000 to June 2015, we can find that the largest recipient of such
investment is service sector (Financial and non-financial services). The share of this sector in cumulative FDI flows is 27 % of the
inflow total foreign direct investment.
The foreign investors are interested in mainly financial services due its profit generating advantage. This sector gives scope for
the foreign investor to takes back the profits to the home country. As service sector the services are consumed in the host country and
there by generating outflow of funds from the host country.
The second recipient is Construction Development sector which shares 14% of total FDI. Telecommunication, Computer software
and hardware, Drugs and pharmaceuticals, Automobile industry, Chemical ( Other than Fertilizers),Power, Metallurgical industries,
Hotel and tourism contribute 11%,11%,8%,8%,7%,6%,6%2% respectively.
The keys takeaways regarding global flows are – the increase in the relative share of developing countries as both destination and
sources and flow to the sector gaining over manufacturing.
There are Sectoral limits or caps designed by the RBI to limit the foreign direct investments. 100% investment has been allowed
to the following sectors- private sector banking, NBFC’S, petroleum, housing and Real estate, Hotel and tourism, road and highways,
ports and harbors, advertising, films, mass raped transportation, power, drug and pharmaceuticals, pollutions control and management
and special economic zones. Other sectors such as airports are allowed with 74% caps and telecommunication with 49% and insurance
with 26%.
III. Graph 3(Table 8) :-
PERCENTAGE GROWTH ANALYSIS (YEAR WISE):
The above graph shows the total amount of FDI inflows in India during the last 15 years i.e. 2000 to 2015. The FDI inflow from
2000-2001 i.e. 10,733crore Rs. in 2001-02 it was 18,654 Crore rupees. It shows the Good result in the FDI inflows in India. Little bit
ups and downs in FDI inflows up to 2005-06, but after that great hike in the year 2007-08 i.e. 98,642crore rupees as compare to earlier
years. In 2008-2009 there was a huge investment in FDI in 142,829 Crore Rupees.
But then there was a downfall in Inflow of FDI in two consecutive years 2009-2010 and 2010-2011, with figures 123,120 and
97,320 respectively. We can analysis from the graph that in the year 2011-2012 the inflow of FDI was second highest of last 15 years
i.e. 165,146.Year 2012-13 and 2013-14 the FDI inflow fluctuated from 121,907 to 147,618 respectively. In last Financial Year i.e.
2014-2015 the amount of FDI Inflow were 189,107 which is the highest FDI inflow in last 15 years. Recently in the month of June
2015 there was inflow of 60,298 Crore Rs. .
International Journal of Scientific and Research Publications, Volume 5, Issue 10, October 2015 26
ISSN 2250-3153
www.ijsrp.org
So we can say that the foreign investment have been fluctuating but rising as well in India.
IV. Graph 4(Table 3) :-
The above bar graph represents the amount of FDI inflows from April 2015 to June, 2015. It shows the amount in Crore Rs. The
highest FDI inflows in the country is in the month May 2015 i.e. 24,564 in Rs Crores and 3,850 in US $ mn. Other months shows the
fluctuating trend.
V. Graph 5(Table 9) :-
The above Figure shows the top five regions in India attracting FDI. It shows that out of 51,437 of Cumulative FDI inflow in the
financial year April, 2015 to June, 2015, 43% share of the total investment is carried by Mumbai region; also it continues to attract
maximum foreign investments followed by 30% - New Delhi, 10% - Chennai, 10% - Bangalore and 7% - Ahmedabad.
VI. ATTRACTING LARGER FDI INFLOWS IN INDIA-
PROBLEMS AND CHALLENGES
Both India and China are competing to get a larger share in
world trade and investment. Although China continues to be
India’s major competitor, many new economies like Indonesia,
Vietnam and Philippines have emerged as strong competitors.
India’s main competitive advantage lies in its lower labour costs
and remunerative domestic markets. But India is fast losing its
competitive advantage to countries like Indonesia and Vietnam
as investors are shifting FDI away from known growth engines
towards these new emerging economies.
International Journal of Scientific and Research Publications, Volume 5, Issue 10, October 2015 27
ISSN 2250-3153
www.ijsrp.org
No doubt Indian government has implemented several reform
measures in order to attract greater FDI but there are several
studies which have highlighted India’s weak spots. One such
report is “Doing Business 2014”, an annual report co-published
by the World Bank and International Finance Corporation that
brings out the differences in business regulations and their
implementation across economies.
Table:
Doing Business in India Rank
Ease of doing business 134
Starting a business 179
Dealing with construction
permits
182
Getting electricity 111
Registering property 92
Getting credit 28
Protecting investors 34
Paying taxes 158
Trading across borders 132
Enforcing contracts 186
Resolving insolvency 121
Analysis of Inflows of Foreign Direct Investment in India:
The table above indicates that India is performing well only
on two indicators, namely, getting credit and protecting
investors. India’s performance on three indicators, namely,
starting a business, dealing with construction permits and
enforcing contracts shows a dismal picture of the investment
climate in India.
Another report “Global Competitiveness Report” published
annually by “World Economic Forum” ranks 148 economies on
their competitiveness with respect to indicators like
infrastructure, institutions, macro-economic stability, innovation
etc. India’s overall rank for 2013-14 on the Global
Competitiveness Index was 60.
The most problematic factors for doing business identified in
the report are inadequate supply of infrastructure, corruption,
inefficient government bureaucracy, policy instability, tax
regulation and restrictive labor regulations.
 MAJOR IMPEDIMENTS:
The major deterrents to larger flows of FDI to India are
listed below:
1) Weak infrastructure: Infrastructural bottlenecks
continue to be a major cause of concern in India.
When it comes to competition, India doesn’t stand
against other emerging markets in terms of ports,
roads, skills sets, education etc. Even after six
decades of planned economic development, India
suffers from poor transport links, inadequate power
supply, poor roads, and frequent power cuts, delays
in ports, water and sewerage problems and so on.
A study conducted by the Federation of Indian Chambers of
Commerce and Industry in 2013, revealed that each day Indian
companies are losing up to Rs. 40,000 because of power
shortages; and due to power cuts, 61% companies suffer more
than 10% loss in production. Warehousing and cold storage
facilities are also in short supply, because of which 40% of the
fruits, vegetables and other perishable products get destroyed
before reaching the markets. In the World Competitiveness Index
for 2013-14, India ranked 85 out of 148 countries for its
infrastructure, much behind China which ranked 48.
2) Complicated tax structure: Stability and
transparency in tax regime along with clarity in tax
laws can have far reaching impact on investments
in any country. The taxation policies in India
remain inherently complex despite the fact that
government has taken several steps to simplify and
redesign it. In the recent years, India has witnessed
several tax disputes with respect to cross border
transactions involving big MNCs. According to a
report in 2011-12, 30 corporations which comprise
the BSE Sensex had USD 7 billion clogged in tax
law suits. Again, while corporate tax rates in most
of the nations are in the range of 15 to 25%, in
India foreign companies are taxed at a rate of 40%.
The corporate tax rate for foreign companies is 25% in
China along with tax holidays for qualified tax payers. India’s
indirect tax regime is also very complex, imposing several taxes
such as central sales tax, VAT, service tax, central excise duty,
octroi etc. and calls for a number of compliances increasing the
burden on companies. Moreover, there is a lack of uniformity in
the tax rates across the country increasing the complexities for
tax payers.
3) Restrictive labor laws: India is known worldwide
for its stringent and rigid labor laws and over-
regulated labor market. Over the years, Indian
government has enacted a large number of
legislations to protect the interests of labor covering
different aspects namely fixation and revision of
wages, worker’s health and safety, mode of
payment of wages, payment of compensation in the
event of industrial accident, provision of social
security such as provident fund, gratuity, insurance
and so on. Indian economy has turned highly
inflexible due to these laws. These laws contain
strict rules regarding overtime and imposes
financial obligation on the employer upon worker
retrenchment.
Laws such as taking prior permission from the government
before firing any worker in an organization employing more than
100 workers continues to haunt corporations. On several
occasions OECD and World Bank studies have highlighted the
need to bring reforms in Indian labor laws.
International Journal of Scientific and Research Publications, Volume 5, Issue 10, October 2015 28
ISSN 2250-3153
www.ijsrp.org
4) Bureaucracy, regulations and corruption: Yet
another handicap that India suffers from is
bureaucracy, red tapism and corruption. It takes
months to obtain licenses, approvals and permits.
As per the doing business report, it takes 67 days
for a company to obtain electricity connection, 16
days to obtain clearances and export goods from
India, 182 days for dealing with construction
permits and 1420 days for enforcing contracts. It
takes 4 to 8 weeks for a new company to get itself
registered in India as compared to few days in most
developed and developing markets.
Many a times, the FDI approvals are kept pending for
months that prompts the investor to drop out. With respect to FDI
policies, even though several liberalization measures have been
undertaken by the government but FDI regulations continue to
remain restrictive as compared to many other nations. India has
been selective in opening sectors for FDI and FDI in India is
subject to sectoral caps ranging from 20 to 100%. The FDI
Regulatory Restrictiveness Index 2013, prepared and published
by OECD has ranked India 6th (indicate restrictive FDI policies)
out of 58 countries. Again, corruption in India is rampant where;
licenses, clearances, and contracts are given not on merit basis
but based on bribes. Uncertain government policies and frequent
changes in them, inefficient administrative, overlapping
jurisdictions, excessive governance increases the transaction
costs for companies making India a less preferred destination.
 4.1. There are two types of implications i.e. positive
and negative as per following:
 Positive Implications:
a) FDI provides capital which is usually missing in the
target country-Long term capital is suitable for
economic development.
b) Foreign investors are able to finance their investments
projects better and often cheaper.
c) Foreign corporations create new workplaces.
d) FDI bring new technologies that are usually not
available in the target country-There is empirical
evidence that there are spill-over effects as the new
technologies usually spread beyond the foreign
corporations.
e) Foreign corporations provide better access to foreign
markets-Ex. Foreign corporations can provide useful
contacts even for their domestic subcontractors.
f) Foreign corporations bring new know-how and
managerial skills into the target country- Again, there is
a spill-over effect – as people leave the corporations
they leave with the knowledge and know-how they
accumulated.
g) Foreign corporations can help to change the economic
structure of the target country- With a good economic
strategy governments can attract companies from
promising and innovative sectors.
h) “Crowding in” effect-The foreign corporations often
bring additional investors into the target country (ex.
their usual subcontractors).
i) Foreign corporations improve the business environment
of the target country-Ethical business or rules of
conduct.
j) Foreign corporations bring new “clean” technologies
that help to improve the environmental conditions.
k) Foreign corporations usually help increase the level of
wages in the target economy.
l) Foreign corporations usually have a positive effect on
the trade balance.
 Negative Implications:
a) Foreign corporations may buy a local company
in order to shut it down (and gain monopoly
for example).
b) “Crowding out” effect- We can see this effect
if the foreign corporations target the domestic
market and domestic corporations are not able
to compete with these corporations.
c) Foreign corporations may cut working
positions (privatization deals or M&A
transactions).
d) Foreign corporations have a tendency to use
their usual suppliers which can lead to
increased imports (no problem if the
production is export driven).
e) Repatriation of the profits can be stressful on
the balance of payments.
f) The high growth of wages in foreign
corporations can influence a similar growth in
the domestic corporations which are not able to
cover this growth with the growth of
productivity- The result is the decreasing
competitiveness of domestic companies.
g) Missing tax revenues- If the foreign
corporations receive tax holidays or similar
provisions.
h) The emergence of a dual economy- The
economy will contain a developed foreign
sector and an underdeveloped domestic sector.
i) Possible environmental damage.
j) “Incentive tourism”.
 SUGGESTIONS FOR INCREASED FLOW OF FDI
INTO THE COUNTRY:-
1) Flexible labour laws needed:
China gets maximum FDI in the manufacturing sector,
which has helped the country become the manufacturing hub of
the world. In India the manufacturing sector can grow if
infrastructure facilities are improved and labour reforms take
place. The country should take initiatives to adopt more flexible
labour laws.
2) Re look at sectoral caps:
Though the Government has hiked the sectoral cap for FDI
over the years, it is time to revisit issues pertaining to limits in
such sectors as coal mining, insurance, real estate, and retail
trade, apart from the small-scale sector. Government should
allow more investment into the country under automatic route.
International Journal of Scientific and Research Publications, Volume 5, Issue 10, October 2015 29
ISSN 2250-3153
www.ijsrp.org
Reforms like bringing more sectors under the automatic route,
increasing the FDI cap and simplifying the procedural delays has
to be initiated. There is need to improve SEZs in terms of their
size, road and port connectivity, assured power supply and
decentralized decision-making.
3) Geographical disparities of fdi should be removed:
The issues of geographical disparities of FDI in India need to
address on priority. Many states are making serious efforts to
simplify regulations for setting up and operating the industrial
units. However, efforts by many state governments are still not
encouraging. Even the state like West Bengal which was once
called Manchester of India attracts only 1% of FDI inflow in the
country. West Bengal, Bihar, Jharkhand, Chhattisgarh are
endowed with rich minerals but due to lack of proper initiatives
by governments of these states, they fail to attract FDI.
4) Promote Greenfield projects:
India’s volume of FDI has increased largely due to Merger
and Acquisitions (M&As) rather than large Greenfields projects.
M&A’s not necessarily imply infusion of new capital into a
country if it is through reinvested earnings and intra company
loans. Business friendly environment must be created on priority
to attract large Greenfields projects. Regulations should be
simplified so that realization ratio is improved (Percentage of
FDI approvals to actual flows). To maximize the benefits of FDI
persistently, India should also focus on developing human capital
and technology.
5) Develop debt market:
India has a well developed equity market but does not have a
well developed debt market. Steps should be taken to improve
the depth and liquidity of debt market as many companies may
prefer leveraged investment rather than investing their own cash.
Therefore it is said that countries with well-developed financial
markets tend to benefits significantly from FDI inflows.
6) Education sector should be opened to FDI:
India has a huge pool of working population. However, due
to poor quality primary education and higher education, there is
still an acute shortage of talent. FDI in Education Sector is lesser
than one percent.
By giving the status of primary and higher education in the
country, FDI in this sector must be encouraged. However,
appropriate measure must be taken to ensure quality education.
The issues of commercialization of education, regional gap and
structural gap have to be addressed on priority.
7) Strengthen research and development in the
country:
India should consciously work towards attracting greater
FDI into R&D as a means of strengthening the country’s
technological prowess and competitiveness.
 FINDINGS:
1) FDI is an important stimulus for the economic growth
of India.
2) Service sector is first and banking and insurance sector
is second segment of which pick the growth in second
decade of reforms.
3) FDI create high perks jobs for skilled employee in
Indian service sector.
4) Mauritius and Singapore is the 2 top countries which
has maximum FDI in India.
5) FDI plays an important role in the development of
infrastructure because many countries invest in the
infrastructure sector and service and banking finance
sectors.
6) Atomic Energy and Railway Transport are some
important and life line of any country. Therefore India
also restricted FDI in this sector.
7) After above analysis, we can say that FDI has good
future growth in Retailing and Real estate sector in
India.
A. India is attracting foreign investment at a good rapid
rate of growth. The growth rate of FDI over last year
was found to be 40 %. The main reason for this
substantial growth in FDI was opening up of Indian
economy to foreign investment, relaxation of norms for
foreign investments and enhancing sector wise limit.
B. In region wise analysis, Mumbai was on the top with
29% to total FDI of India. The reason behind this was
the availability of service sector, infrastructure and
construction development. Six regions offices which are
at the top contribute 71% to the total FDI while rest of
the regions add 29% to total FDI.
C. As per the data, the sectors that attracted higher inflows
were Services (17%), Construction activities (9%),
Telecommunications (7%) and Computer Software and
Hardware (7%).
D. A country wise FDI inflows show that Mauritius is the
country that has invested highly in India followed by
Singapore, UK, Japan Netherland and USA and so on.
Nine countries contribute 83% to cumulative FDI in
India while remaining contributes only 17%.
E. FDI plays an important role in the development of
infrastructure because many countries invest in the
infrastructure sector and banking finance sector.
VII. CONCLUSION
FDI in India has a significant role in the economic growth
and development of India. FDI in India to various sectors can
attain sustained economic growth and development through
creation of jobs, expansion of existing manufacturing industries.
The inflow of FDI in service sectors and construction and
development sector, from April, 2000 to June, 2015 attained
substantial sustained economic growth and development through
creation of jobs in India.
Computer, Software & Hardware and Drugs &
Pharmaceuticals sector were the other sectors to which attention
was shown by Foreign Direct Investors (FDI). The other sectors
in Indian economy the Foreign Direct Investors interest was, in
fact has been quite poor.
International Journal of Scientific and Research Publications, Volume 5, Issue 10, October 2015 30
ISSN 2250-3153
www.ijsrp.org
FDI has helped to raise the output, productivity and
employment in some sectors especially in service sector. Indian
service sector is generating the proper employment options for
skilled worker with high perks. On the other side banking and
insurance sector help in providing the strength to the Indian
economic condition and develop the foreign exchange system in
country.
So, we can conclude that FDI is always helps to create
employment in the country and also support the small scale
industries also and helps country to put an impression on the
world wide level through liberalization and globalization.
REFERENCES
[1] Aggrawal, S., Singla, A., Aggrawal, R. (2012). Foreign direct investment in
India. International Journal of Computational Engineering & Management,
15 (5), 93-105.
[2] Azhar, S., Marimuthu, K.N. (2012). An overview of foreign direct
Investment in India. International Journal of Multidisciplinary Management
studies, 2 (1), 202-214.
[3] Department of Industrial Policy and Promotion, (April 2000 to June 2015)
Annual Report.
[4] Devajit, M. (2012). Impact of foreign direct investment on Indian economy.
Research Journal of management Sciences, 1(2), 29-31.
[5] Kumar, P. (2011). FDI in India and its impact- “A critical evaluation”.
VRSD International Journal of Business & Management Research, 1(3),
185-196.
[6] Manual on Foreign Direct Investment in India by Secretariat for Industrial
Assistance (SIA) DIPP.
[7] Mahajan, D. (2008). FDI in India not as per her potential. The Economic
Challenger, 41 (11), 59-63.
[8] Press notes of Department of Industrial Policy and Promotion (DIPP)
(2010-15).
[9] Ramachandran, A., Kavitha, N., Veni, N.K. (2008). Foreign direct
investment and the economic scenario. The Economic Challenger, 39 (10),
43-49.
[10] Reserve Bank of India (2015), Monthly Bulletin, July.
[11] Sahni, P. (2012). Trends and determinants of foreign direct investment in
India: An empirical investigation. International Journal of Marketing and
Technology, 2 (8), 144-161.
[12] UNCTAD (2015), World Investment Report.
AUTHORS
First Author - Abhishek Vijaykumar Vyas, B.Com, M.B.A
(International Business), Sinhgad Institute of Technology and
Science (SITS), Pune, vyasabhishekla@gmail.com

More Related Content

What's hot

Foreign direct investments
Foreign direct investmentsForeign direct investments
Foreign direct investments
Ahana Mohan
 
role of FDI in economy
role of FDI in economyrole of FDI in economy
role of FDI in economy
Parth Raj
 
Role and-impact-of-fiis-on-indian-capital-market
Role and-impact-of-fiis-on-indian-capital-marketRole and-impact-of-fiis-on-indian-capital-market
Role and-impact-of-fiis-on-indian-capital-market
freny m
 
Foreign Direct Investment
Foreign Direct InvestmentForeign Direct Investment
Foreign Direct Investment
Shahzad Khan
 

What's hot (20)

Foreign direct investment(fdi)
Foreign direct investment(fdi)Foreign direct investment(fdi)
Foreign direct investment(fdi)
 
foreign direct investment (FDI) INDIA
foreign direct investment (FDI) INDIAforeign direct investment (FDI) INDIA
foreign direct investment (FDI) INDIA
 
FDI & Economic Growth
FDI & Economic GrowthFDI & Economic Growth
FDI & Economic Growth
 
Fdi ppt
Fdi pptFdi ppt
Fdi ppt
 
Foreign direct investment in India
Foreign direct investment in IndiaForeign direct investment in India
Foreign direct investment in India
 
Foreign direct investments
Foreign direct investmentsForeign direct investments
Foreign direct investments
 
Foreign Direct Investment
Foreign Direct InvestmentForeign Direct Investment
Foreign Direct Investment
 
Role of FDI in India
Role of FDI in India Role of FDI in India
Role of FDI in India
 
role of FDI in economy
role of FDI in economyrole of FDI in economy
role of FDI in economy
 
F.d.i. in India
F.d.i. in IndiaF.d.i. in India
F.d.i. in India
 
Foreign Direct Investment in India
Foreign Direct Investment in India Foreign Direct Investment in India
Foreign Direct Investment in India
 
Role and-impact-of-fiis-on-indian-capital-market
Role and-impact-of-fiis-on-indian-capital-marketRole and-impact-of-fiis-on-indian-capital-market
Role and-impact-of-fiis-on-indian-capital-market
 
Make in india (1)
Make in india (1)Make in india (1)
Make in india (1)
 
Foreign Direct Investment In India
Foreign Direct Investment In IndiaForeign Direct Investment In India
Foreign Direct Investment In India
 
Trend Analysis Of FII and Impact on SENSEX -2015 (Yearly Analysis)
Trend Analysis Of FII and Impact on SENSEX -2015 (Yearly Analysis) Trend Analysis Of FII and Impact on SENSEX -2015 (Yearly Analysis)
Trend Analysis Of FII and Impact on SENSEX -2015 (Yearly Analysis)
 
Make in india
Make in indiaMake in india
Make in india
 
Fdi in india
Fdi in indiaFdi in india
Fdi in india
 
Factors of foreign direct investment
Factors of foreign direct investmentFactors of foreign direct investment
Factors of foreign direct investment
 
Foreign Direct Investment
Foreign Direct InvestmentForeign Direct Investment
Foreign Direct Investment
 
Foreign capital inflow in india- analysis , impact , measure , wayforward
Foreign capital inflow in india- analysis , impact , measure , wayforwardForeign capital inflow in india- analysis , impact , measure , wayforward
Foreign capital inflow in india- analysis , impact , measure , wayforward
 

Viewers also liked (6)

Jeeni
JeeniJeeni
Jeeni
 
A comprative study on return of mutual fund and insurance ulips in indian con...
A comprative study on return of mutual fund and insurance ulips in indian con...A comprative study on return of mutual fund and insurance ulips in indian con...
A comprative study on return of mutual fund and insurance ulips in indian con...
 
Impact of FDI on Indian Life Insurance Sector
Impact of FDI on Indian Life Insurance SectorImpact of FDI on Indian Life Insurance Sector
Impact of FDI on Indian Life Insurance Sector
 
Impact of FDI on Indian Economy
Impact of FDI on Indian EconomyImpact of FDI on Indian Economy
Impact of FDI on Indian Economy
 
Foreign Direct Investment and Indian Economy ppt
Foreign Direct Investment and Indian Economy pptForeign Direct Investment and Indian Economy ppt
Foreign Direct Investment and Indian Economy ppt
 
Foreign Direct Investment in India (FDI)
Foreign Direct Investment in India (FDI)Foreign Direct Investment in India (FDI)
Foreign Direct Investment in India (FDI)
 

Similar to An analytical study of fdi in india (2000 2015)

India FDI-Current Status, Issues and Policy Recommendations
India FDI-Current Status, Issues and Policy RecommendationsIndia FDI-Current Status, Issues and Policy Recommendations
India FDI-Current Status, Issues and Policy Recommendations
Ankur Pandey
 
Foreign Direct Investment in Retail: Myths and Realities
Foreign Direct Investment in Retail: Myths and RealitiesForeign Direct Investment in Retail: Myths and Realities
Foreign Direct Investment in Retail: Myths and Realities
Anurag Anand
 
Fdiinindiaananalysisontheimpactoffdiinindiasretailsector 111031075256-phpapp0...
Fdiinindiaananalysisontheimpactoffdiinindiasretailsector 111031075256-phpapp0...Fdiinindiaananalysisontheimpactoffdiinindiasretailsector 111031075256-phpapp0...
Fdiinindiaananalysisontheimpactoffdiinindiasretailsector 111031075256-phpapp0...
Saurabh Bhende
 
Fdi in india:An analysis on the impact of fdi in india’s retail sector
Fdi in india:An analysis on the impact of fdi in india’s retail sectorFdi in india:An analysis on the impact of fdi in india’s retail sector
Fdi in india:An analysis on the impact of fdi in india’s retail sector
Subhajit Ray
 

Similar to An analytical study of fdi in india (2000 2015) (20)

Foreign Direct Investment (Influx) from different nations and its impact on E...
Foreign Direct Investment (Influx) from different nations and its impact on E...Foreign Direct Investment (Influx) from different nations and its impact on E...
Foreign Direct Investment (Influx) from different nations and its impact on E...
 
India FDI-Current Status, Issues and Policy Recommendations
India FDI-Current Status, Issues and Policy RecommendationsIndia FDI-Current Status, Issues and Policy Recommendations
India FDI-Current Status, Issues and Policy Recommendations
 
Fdi roles
Fdi rolesFdi roles
Fdi roles
 
Fdiroles 121001063257-phpapp01 (1)
Fdiroles 121001063257-phpapp01 (1)Fdiroles 121001063257-phpapp01 (1)
Fdiroles 121001063257-phpapp01 (1)
 
Impact of flow of fdi on indian capital market
Impact of flow of fdi on indian capital marketImpact of flow of fdi on indian capital market
Impact of flow of fdi on indian capital market
 
A study and analysis of fdi in india angel broking
A study and analysis of fdi in india angel broking A study and analysis of fdi in india angel broking
A study and analysis of fdi in india angel broking
 
A study of fdi in india
A study of fdi in indiaA study of fdi in india
A study of fdi in india
 
Growth and Development of FDI on Indian Economy
Growth and Development of FDI on Indian EconomyGrowth and Development of FDI on Indian Economy
Growth and Development of FDI on Indian Economy
 
Foreign Direct Investment in Retail: Myths and Realities
Foreign Direct Investment in Retail: Myths and RealitiesForeign Direct Investment in Retail: Myths and Realities
Foreign Direct Investment in Retail: Myths and Realities
 
10120140502003
1012014050200310120140502003
10120140502003
 
Final 1
Final 1Final 1
Final 1
 
FDI FINAL 2
FDI FINAL 2FDI FINAL 2
FDI FINAL 2
 
International Journal of Sciences: Basic and Applied Research (IJSBAR)
International Journal of Sciences: Basic and Applied Research (IJSBAR)International Journal of Sciences: Basic and Applied Research (IJSBAR)
International Journal of Sciences: Basic and Applied Research (IJSBAR)
 
Fdiinindiaananalysisontheimpactoffdiinindiasretailsector 111031075256-phpapp0...
Fdiinindiaananalysisontheimpactoffdiinindiasretailsector 111031075256-phpapp0...Fdiinindiaananalysisontheimpactoffdiinindiasretailsector 111031075256-phpapp0...
Fdiinindiaananalysisontheimpactoffdiinindiasretailsector 111031075256-phpapp0...
 
Fdi in india:An analysis on the impact of fdi in india’s retail sector
Fdi in india:An analysis on the impact of fdi in india’s retail sectorFdi in india:An analysis on the impact of fdi in india’s retail sector
Fdi in india:An analysis on the impact of fdi in india’s retail sector
 
FDI role and performance of economy by Aakash Tiwari
FDI role and performance of economy by Aakash TiwariFDI role and performance of economy by Aakash Tiwari
FDI role and performance of economy by Aakash Tiwari
 
FDI in retail sector in india
FDI in retail sector in india FDI in retail sector in india
FDI in retail sector in india
 
FDI
FDIFDI
FDI
 
A Study Of FDI In India
A Study Of FDI In IndiaA Study Of FDI In India
A Study Of FDI In India
 
Fdi india issues
Fdi india  issuesFdi india  issues
Fdi india issues
 

Recently uploaded

Call Girls Banaswadi Just Call 👗 7737669865 👗 Top Class Call Girl Service Ban...
Call Girls Banaswadi Just Call 👗 7737669865 👗 Top Class Call Girl Service Ban...Call Girls Banaswadi Just Call 👗 7737669865 👗 Top Class Call Girl Service Ban...
Call Girls Banaswadi Just Call 👗 7737669865 👗 Top Class Call Girl Service Ban...
amitlee9823
 
VIP Call Girl in Mumbai Central 💧 9920725232 ( Call Me ) Get A New Crush Ever...
VIP Call Girl in Mumbai Central 💧 9920725232 ( Call Me ) Get A New Crush Ever...VIP Call Girl in Mumbai Central 💧 9920725232 ( Call Me ) Get A New Crush Ever...
VIP Call Girl in Mumbai Central 💧 9920725232 ( Call Me ) Get A New Crush Ever...
dipikadinghjn ( Why You Choose Us? ) Escorts
 
VIP Call Girl Service Andheri West ⚡ 9920725232 What It Takes To Be The Best ...
VIP Call Girl Service Andheri West ⚡ 9920725232 What It Takes To Be The Best ...VIP Call Girl Service Andheri West ⚡ 9920725232 What It Takes To Be The Best ...
VIP Call Girl Service Andheri West ⚡ 9920725232 What It Takes To Be The Best ...
dipikadinghjn ( Why You Choose Us? ) Escorts
 
From Luxury Escort Service Kamathipura : 9352852248 Make on-demand Arrangemen...
From Luxury Escort Service Kamathipura : 9352852248 Make on-demand Arrangemen...From Luxury Escort Service Kamathipura : 9352852248 Make on-demand Arrangemen...
From Luxury Escort Service Kamathipura : 9352852248 Make on-demand Arrangemen...
From Luxury Escort : 9352852248 Make on-demand Arrangements Near yOU
 
VIP Independent Call Girls in Mumbai 🌹 9920725232 ( Call Me ) Mumbai Escorts ...
VIP Independent Call Girls in Mumbai 🌹 9920725232 ( Call Me ) Mumbai Escorts ...VIP Independent Call Girls in Mumbai 🌹 9920725232 ( Call Me ) Mumbai Escorts ...
VIP Independent Call Girls in Mumbai 🌹 9920725232 ( Call Me ) Mumbai Escorts ...
dipikadinghjn ( Why You Choose Us? ) Escorts
 
VIP Independent Call Girls in Taloja 🌹 9920725232 ( Call Me ) Mumbai Escorts ...
VIP Independent Call Girls in Taloja 🌹 9920725232 ( Call Me ) Mumbai Escorts ...VIP Independent Call Girls in Taloja 🌹 9920725232 ( Call Me ) Mumbai Escorts ...
VIP Independent Call Girls in Taloja 🌹 9920725232 ( Call Me ) Mumbai Escorts ...
dipikadinghjn ( Why You Choose Us? ) Escorts
 

Recently uploaded (20)

Call Girls Koregaon Park Call Me 7737669865 Budget Friendly No Advance Booking
Call Girls Koregaon Park Call Me 7737669865 Budget Friendly No Advance BookingCall Girls Koregaon Park Call Me 7737669865 Budget Friendly No Advance Booking
Call Girls Koregaon Park Call Me 7737669865 Budget Friendly No Advance Booking
 
Call Girls in New Friends Colony Delhi 💯 Call Us 🔝9205541914 🔝( Delhi) Escort...
Call Girls in New Friends Colony Delhi 💯 Call Us 🔝9205541914 🔝( Delhi) Escort...Call Girls in New Friends Colony Delhi 💯 Call Us 🔝9205541914 🔝( Delhi) Escort...
Call Girls in New Friends Colony Delhi 💯 Call Us 🔝9205541914 🔝( Delhi) Escort...
 
Call Girls Service Pune ₹7.5k Pick Up & Drop With Cash Payment 9352852248 Cal...
Call Girls Service Pune ₹7.5k Pick Up & Drop With Cash Payment 9352852248 Cal...Call Girls Service Pune ₹7.5k Pick Up & Drop With Cash Payment 9352852248 Cal...
Call Girls Service Pune ₹7.5k Pick Up & Drop With Cash Payment 9352852248 Cal...
 
Solution Manual for Financial Accounting, 11th Edition by Robert Libby, Patri...
Solution Manual for Financial Accounting, 11th Edition by Robert Libby, Patri...Solution Manual for Financial Accounting, 11th Edition by Robert Libby, Patri...
Solution Manual for Financial Accounting, 11th Edition by Robert Libby, Patri...
 
Stock Market Brief Deck (Under Pressure).pdf
Stock Market Brief Deck (Under Pressure).pdfStock Market Brief Deck (Under Pressure).pdf
Stock Market Brief Deck (Under Pressure).pdf
 
Top Rated Pune Call Girls Aundh ⟟ 6297143586 ⟟ Call Me For Genuine Sex Servi...
Top Rated  Pune Call Girls Aundh ⟟ 6297143586 ⟟ Call Me For Genuine Sex Servi...Top Rated  Pune Call Girls Aundh ⟟ 6297143586 ⟟ Call Me For Genuine Sex Servi...
Top Rated Pune Call Girls Aundh ⟟ 6297143586 ⟟ Call Me For Genuine Sex Servi...
 
TEST BANK For Corporate Finance, 13th Edition By Stephen Ross, Randolph Weste...
TEST BANK For Corporate Finance, 13th Edition By Stephen Ross, Randolph Weste...TEST BANK For Corporate Finance, 13th Edition By Stephen Ross, Randolph Weste...
TEST BANK For Corporate Finance, 13th Edition By Stephen Ross, Randolph Weste...
 
Top Rated Pune Call Girls Viman Nagar ⟟ 6297143586 ⟟ Call Me For Genuine Sex...
Top Rated  Pune Call Girls Viman Nagar ⟟ 6297143586 ⟟ Call Me For Genuine Sex...Top Rated  Pune Call Girls Viman Nagar ⟟ 6297143586 ⟟ Call Me For Genuine Sex...
Top Rated Pune Call Girls Viman Nagar ⟟ 6297143586 ⟟ Call Me For Genuine Sex...
 
Booking open Available Pune Call Girls Talegaon Dabhade 6297143586 Call Hot ...
Booking open Available Pune Call Girls Talegaon Dabhade  6297143586 Call Hot ...Booking open Available Pune Call Girls Talegaon Dabhade  6297143586 Call Hot ...
Booking open Available Pune Call Girls Talegaon Dabhade 6297143586 Call Hot ...
 
Booking open Available Pune Call Girls Wadgaon Sheri 6297143586 Call Hot Ind...
Booking open Available Pune Call Girls Wadgaon Sheri  6297143586 Call Hot Ind...Booking open Available Pune Call Girls Wadgaon Sheri  6297143586 Call Hot Ind...
Booking open Available Pune Call Girls Wadgaon Sheri 6297143586 Call Hot Ind...
 
Webinar on E-Invoicing for Fintech Belgium
Webinar on E-Invoicing for Fintech BelgiumWebinar on E-Invoicing for Fintech Belgium
Webinar on E-Invoicing for Fintech Belgium
 
Call Girls Banaswadi Just Call 👗 7737669865 👗 Top Class Call Girl Service Ban...
Call Girls Banaswadi Just Call 👗 7737669865 👗 Top Class Call Girl Service Ban...Call Girls Banaswadi Just Call 👗 7737669865 👗 Top Class Call Girl Service Ban...
Call Girls Banaswadi Just Call 👗 7737669865 👗 Top Class Call Girl Service Ban...
 
Business Principles, Tools, and Techniques in Participating in Various Types...
Business Principles, Tools, and Techniques  in Participating in Various Types...Business Principles, Tools, and Techniques  in Participating in Various Types...
Business Principles, Tools, and Techniques in Participating in Various Types...
 
Kharghar Blowjob Housewife Call Girls NUmber-9833754194-CBD Belapur Internati...
Kharghar Blowjob Housewife Call Girls NUmber-9833754194-CBD Belapur Internati...Kharghar Blowjob Housewife Call Girls NUmber-9833754194-CBD Belapur Internati...
Kharghar Blowjob Housewife Call Girls NUmber-9833754194-CBD Belapur Internati...
 
(Vedika) Low Rate Call Girls in Pune Call Now 8250077686 Pune Escorts 24x7
(Vedika) Low Rate Call Girls in Pune Call Now 8250077686 Pune Escorts 24x7(Vedika) Low Rate Call Girls in Pune Call Now 8250077686 Pune Escorts 24x7
(Vedika) Low Rate Call Girls in Pune Call Now 8250077686 Pune Escorts 24x7
 
VIP Call Girl in Mumbai Central 💧 9920725232 ( Call Me ) Get A New Crush Ever...
VIP Call Girl in Mumbai Central 💧 9920725232 ( Call Me ) Get A New Crush Ever...VIP Call Girl in Mumbai Central 💧 9920725232 ( Call Me ) Get A New Crush Ever...
VIP Call Girl in Mumbai Central 💧 9920725232 ( Call Me ) Get A New Crush Ever...
 
VIP Call Girl Service Andheri West ⚡ 9920725232 What It Takes To Be The Best ...
VIP Call Girl Service Andheri West ⚡ 9920725232 What It Takes To Be The Best ...VIP Call Girl Service Andheri West ⚡ 9920725232 What It Takes To Be The Best ...
VIP Call Girl Service Andheri West ⚡ 9920725232 What It Takes To Be The Best ...
 
From Luxury Escort Service Kamathipura : 9352852248 Make on-demand Arrangemen...
From Luxury Escort Service Kamathipura : 9352852248 Make on-demand Arrangemen...From Luxury Escort Service Kamathipura : 9352852248 Make on-demand Arrangemen...
From Luxury Escort Service Kamathipura : 9352852248 Make on-demand Arrangemen...
 
VIP Independent Call Girls in Mumbai 🌹 9920725232 ( Call Me ) Mumbai Escorts ...
VIP Independent Call Girls in Mumbai 🌹 9920725232 ( Call Me ) Mumbai Escorts ...VIP Independent Call Girls in Mumbai 🌹 9920725232 ( Call Me ) Mumbai Escorts ...
VIP Independent Call Girls in Mumbai 🌹 9920725232 ( Call Me ) Mumbai Escorts ...
 
VIP Independent Call Girls in Taloja 🌹 9920725232 ( Call Me ) Mumbai Escorts ...
VIP Independent Call Girls in Taloja 🌹 9920725232 ( Call Me ) Mumbai Escorts ...VIP Independent Call Girls in Taloja 🌹 9920725232 ( Call Me ) Mumbai Escorts ...
VIP Independent Call Girls in Taloja 🌹 9920725232 ( Call Me ) Mumbai Escorts ...
 

An analytical study of fdi in india (2000 2015)

  • 1. International Journal of Scientific and Research Publications, Volume 5, Issue 10, October 2015 1 ISSN 2250-3153 www.ijsrp.org An Analytical Study of FDI in India (2000-2015) Abhishek Vijaykumar Vyas MBA – International Business, Sinhgad Institute of Technology and Science (SITS), Pune, Maharashtra, India Abstract- Foreign Direct investment plays a very important role in the development of the nation. Sometimes domestically available capital is inadequate for the purpose of overall development of the country. Foreign capital is seen as a way of filling in gaps between domestic savings and investment. India can attract much larger foreign investments than it has done in the past. The present study has focused on the trends of FDI Flow in India during 2000-01 to 2014-15 (up to June, 2015). The study also highlights country wise approvals of FDI inflows to India and the FDI inflows in different sector for the period April 2000 to June 2015. The study based on Secondary data which have been collected through reports of the Ministry of Commerce and Industry, Department of Industrial Promotion and Policy, Government of India, Reserve Bank of India, and World Investment Report. The study concludes that Mauritius emerged as the most dominant source of FDI contributing. It is because the India has Double Taxation Avoidance Agreement (DTAA) with Mauritius and most of the foreign countries like to invest in service sector. Index Terms- foreign direct investment; economic growth, FDI 2000 to 2015. I. INTRODUCTION oreign Direct Investment (FDI) is a type of investment in to an enterprises in a country by another enterprises located in another country by buying a company in the target country or by expanding operations of an existing business in that country. In the era of globalization FDI takes vital part in the development of both developing and developed countries. FDI has been associated with improved economic growth and development in the host countries which has led to the emergence of global competition to attract FDI. FDI offers number of benefits like overture of new technology, innovative products, and extension of new markets, opportunities of employment and introduction of new skills etc., which reflect in the growth of income of any nation. Foreign direct investment is one of the measures of growing economic globalization. Investment has always been an issue for the developing economies such as India. The world has been globalizing and all the countries are liberalizing their policies for welcoming investment from countries which are abundant in capital resources. The countries which are developed are focusing on new markets where there is availability of abundant labors, scope for products, and high profits are achieved. Therefore Foreign Direct Investment (FDI) has become a battle ground in the emerging markets. Foreign investment plays a significant role in development of any economy as like India. Many countries provide many incentives for attracting the foreign direct investment (FDI). Need of FDI depends on saving and investment rate in any country. Foreign Direct investment acts as a bridge to fulfill the gap between investment and saving. In the process of economic development foreign capital helps to cover the domestic saving constraint and provide access to the superior technology that promote efficiency and productivity of the existing production capacity and generate new production opportunity. India’s recorded GDP growth throughout the last decade has lifted millions out of poverty & made the country a favoured destination for foreign direct investment. A recent UNCTAD survey projected India as the second most important FDI destination after China for transnational corporations during 2010-2015. Services, telecommunication, construction activities, computer software & hardware and automobile are major sectors which attracted higher inflows of FDI in India. Countries like Mauritius, Singapore, US & UK were among the leading sources of FDI in India. FDI inflow routes: An Indian company may receive Foreign Direct Investment under the two routes as given under: 1. Automatic Route: FDI in sectors /activities to the extent permitted under the automatic route does not require any prior approval either of the Government or the Reserve Bank of India. 2. Government Route: FDI in activities not covered under the automatic route requires prior approval of the Government which are considered by the Foreign Investment Promotion Board (FIPB), Department of Economic Affairs, and Ministry of Finance. FDI is not permitted in the following industrial sectors:  Arms and ammunition.  Atomic Energy,  Railway Transport.  Coal and lignite.  Mining of iron, manganese, chrome, gypsum, sulphur, gold, diamonds, copper, zinc.  Lottery Business  Gambling and Betting  Business of Chit Fund  Agricultural (excluding Floriculture, Horticulture, Development of seeds, Animal Husbandry, Pisciculture and cultivation of vegetables, mushrooms, etc. under controlled conditions and services related to agro and F
  • 2. International Journal of Scientific and Research Publications, Volume 5, Issue 10, October 2015 2 ISSN 2250-3153 www.ijsrp.org allied sectors) and Plantations activities (other than Tea Plantations) .  Housing and Real Estate business.  Trading in Transferable Development Rights (TDRs).  Manufacture of cigars, cheroots, cigarillos and cigarettes, of tobacco or of tobacco substitutes.  II. REVIEW OF LITERATURE Singh Kr. Arun and Agarwal P.K., (2012) “Foreign direct investment: The big bang in Indian retail”. In this article they have studied the relation of foreign investment and Indian retail business. The study is based on different literatures, case studies and analysis of organised retail market. The author discusses the policy development for FDI in the two retail categories: single brand and multi brand. The author concludes that FDI in multi brand retail should be considered, better technology and employment. The paper also concludes that openness of FDI in India would help India to integrate into worldwide market. Dr. Mamata Jain and Mrs. Meenal Lodhana Sukhlecha, (2012), “FDI in multi brand retail: Is it the need of the hour?” The paper studies the need of the retail community to invite FDI in retailing. The study is under taken through analysis of positive and negative impacts of reforms. The study shows various advantages of FDI, which suggests for foreign participation in retailing, but the author also suggests that the ceiling should not exceed 51% even for single brands to ensure check and control on business operations. Rajalakshmi K. and Ramachandran F., (2011), “Impact of FDI in India’s automobile sector with reference to passenger car segment.” The author has studied the foreign investment flows through the automobile sector with special reference to passenger cars. The research methodology used for analysis includes the use of ARIMA, coefficient, linear and compound model. The period of study is from 1991to 2011. This paper is an empirical study of FDI flows after post liberalisation period. The author has also examined the trend ad composition of FDI flow and the effect of FDI on economic growth. The author has also identified the problems faced by India in FDI growth of automobile sector through suggestions of policy implications. Dr. S N Babar and Dr. B V Khandare, (2012), “Structure of FDI in India during globalisation period”. The study is mainly focused on changing structure and direction of India’s FDI during globalisation period. The study is done through analysis of benefits of FDI for economic growth. The study has been done through sect oral analysis of FDI participation, as well as through study of country wise flow of foreign inflow in India till 2010. Singh (2009) stated in their study that foreign direct investment (FDI) policies play a major role in the economic growth of developing countries around the world. Attracting FDI inflows with conductive policies has therefore become a key battleground in the emerging markets. The paper highlighted the trend of FDI in India after the sector-wise economic reforms. Devajit (2012) conducted the study to find out the impact of foreign direct investments on Indian economy and concluded that Foreign Direct Investment (FDI) as a strategic component of investment is needed by India for its sustained economic growth and development through creation of jobs, expansion of existing manufacturing industries, short and long term project in the field of healthcare, education, research and development. Sharma Reetu and Khurana Nikita (2013) in their study on the sector-wise distribution of FDI inflow to know about which has concerned with the chief share, used a data from 1991-92 to 2011-2012 (post-liberalization period). This paper also discusses the various problems about the foreign direct investment and suggests the some recommendations for the same. In this study found that, Indian economy is mostly based on agriculture. So, there is a most important scope of agriculture services. Therefore, the foreign direct investment in this sector should be encouraged. III. FDI POLICY FRAMEWORK IN INDIA Policy regime is one of the key factors driving investment flows to a country. Apart from underlying overall fundamentals, ability of a nation to attract foreign investment essentially depends upon its policy regime - whether it promotes or restrains the foreign investment flows. This section undertakes a review of India’s FDI policy framework. There has been a sea change in India’s approach to foreign investment from the early 1990s when it began structural economic reforms about almost all the sectors of the economy. a) Pre-Liberalisation Period: Historically, India had followed an extremely careful and selective approach while formulating FDI policy in view of the governance of „import-substitution strategy‟ of industrialisation. The regulatory framework was consolidated through the enactment of Foreign Exchange Regulation Act (FERA), 1973 wherein foreign equity holding in a joint venture was allowed only up to 40 per cent. Subsequently, various exemptions were extended to foreign companies engaged in export oriented businesses and high technology and high priority areas including allowing equity holdings of over 40 per cent. Moreover, drawing from successes of other country experiences in Asia, Government not only established special economic zones (SEZs) but also designed liberal policy and provided incentives for promoting FDI in these zones with a view to promote exports. The announcements of Industrial Policy (1980 and 1982) and Technology Policy (1983) provided for a liberal attitude towards foreign investments in terms of changes in policy directions. The policy was characterised by de-licensing of some of the industrial rules and promotion of Indian manufacturing exports as well as emphasising on modernisation of industries through liberalised imports of capital goods and technology. This was supported by trade liberalisation measures in the form of tariff reduction and shifting of large number of items from import licensing to Open General Licensing (OGL). b) Post-Liberalisation Period: A major shift occurred when India embarked upon economic liberalisation and reforms program in 1991 aiming to raise its growth potential and integrating with the world economy. Industrial policy reforms slowly but surely removed restrictions on investment projects and business expansion on the one hand and allowed increased access to foreign technology and funding on the other. A series of measures that were directed towards liberalizing foreign investment included:
  • 3. International Journal of Scientific and Research Publications, Volume 5, Issue 10, October 2015 3 ISSN 2250-3153 www.ijsrp.org 1) Introduction of dual route of approval of FDI–RBI‟s automatic route and Government’s approval (SIA/FIPB) route. 2) Automatic permission for technology agreements in high priority industries and removal of restriction of FDI in low technology areas as well as liberalisation of technology imports. 3) Permission to Non-resident Indians (NRIs) and Overseas Corporate Bodies (OCBs) to invest up to 100 per cent in high priorities sectors. 4) Hike in the foreign equity participation limits to 51 per cent for existing companies and liberalisation of the use of foreign “brands name”. 5) Signing the Convention of Multilateral Investment Guarantee Agency (MIGA) for protection of foreign Investments. These efforts were boosted by the enactment of Foreign Exchange Management Act (FEMA), 1999 [that replaced the Foreign Exchange Regulation Act (FERA), 1973] which was less stringent. In 1997, Indian Government allowed 100% FDI in cash and carry wholesale and FDI in single brand retailing was allowed 51% in June, 2006. After a long debate, further amendment was made in December, 2012 which led FDI to 100% in single brand retailing and 51% in multiple brand retailing. IV. OBJECTIVES AND METHODOLOGY A. Research Objectives :  To discuss the FDI policy framework in India.  To identify the various determinants of FDI.  To understand the need for FDI in India.  To Study the trends of FDI Flow in India during 2000- 01 to 2014-15 (up to June, 2015).  To analysis the FDI flows as to identify country wise approvals of FDI inflows to India.  To analysis sector wise inflow of FDI in India.  To identify the problems relating to low inflow of FDI and to make suitable suggestions for attracting more FDI inflow to India. B. RESEARCH METHODOLOGY :  Type of research: - Quantitative & Analytical Research.  Data: - Data of Manufacturing, Services & Construction, Real estate, mining sectors etc. from year April 2000 to June 2015 is considered for the study.  Data Collection Method: - Secondary data from different web sites & reports of RBI, CEDAR-USIBC report on FDI, reports of Asian development bank.  Sources of data collection: - The study is based on published sources of data collected from various sources. The data was extracted from the following sources:  Handbook of Statistics on the Indian economy, RBI.  Economic Survey, Government of India.  Department of Industrial Policy and Promotion (DIPP).  Secretariat of Industrial Assistance (SIA).  Central Statistical Organization (CSO). This research is a descriptive study in nature. The secondary data was collected from various journals, magazines, and websites particularly from the Department of Industrial Policy & Promotion, Ministry of Commerce and Industry, India stat etc. Simple percentages have been used to defect the growth rate of India. Graphs and tables have also been used where ever required to depict statistical data of FDI during the study period. The time period of the study has been taken from the April 2000 to June 2015. CURRENT STATUS OF FDI IN INDIA RETAIL SECTOR:- As of June 2015, the Government of India allowed FDI in single and multi brand retailing along with the following conditions:- 1) Up to 100% FDI in single brand retail trading.  By only one non-resident entity whether owner or the brand or otherwise.  30% domestic sourcing requirement eased to preferable sourcing rather than compulsory.  Further clarification on FDI companies that cannot engage in B2C e-commerce.  Products to be sold should be of a “single brand”. Product should be sold under the same brand internationally.  “Single brand” product retailing would cover only products, which are branded during manufacturing. 2) Up to 51% FDI in multi brand retail trading.  At least 100 million US$ must be invested into Indian company.  At least 50% of the total FDI is to be invested in back end infrastructure within 3 years.  At least 30% of the value of procurement of processed product shall be sourced from Indian small industry.  Fresh agriculture produce is permitted to be sold unbranded.  Indian states have been given the discretion to accept of refuse the implementation of FDI.  Retail outlets can be set up in cities having population of at least 1 million.  Application needs to be approved by two levels at Department of Industrial Policy and Promotion and Foreign Investment Promotion Board. CURRENT STATUS OF FDI IN INDIA SERVICE SECTOR:- FDI plays a major role in the dynamic growth of the service sector. The service sector in India has tremendous growth potential and as a result it attracts huge FDI.
  • 4. International Journal of Scientific and Research Publications, Volume 5, Issue 10, October 2015 4 ISSN 2250-3153 www.ijsrp.org  The Computer Software and Hardware enjoy the permission of 100% FDI under automatic route.  The limit of FDI in Telecom sector was increased from 49% to 74%. FDI up to 49% is permissible under automatic route but FDI in the licensee company/Indian promoters including their holding companies shall require approval of FIPB. PROBLEMS FOR LOW FDI FLOW TO INDIA:- India, the largest democratic country with the second largest population in the world, with rule of law and a highly educated English speaking work force, the country is considered as a safe haven for foreign investors. Yet, India seems to be suffering from a host of self-imposed restrictions and problems regarding opening its markets completely too global investors by implementing full scale economic reforms. Some of the major impediments for India’s poor performance in the area of FDI are: political instability, poor infrastructure, confusing tax and tariff policies, Draconian labour laws, well entrenched corruption and governmental regulations. 1. Lack of adequate infrastructure: It is cited as a major hurdle for FDI inflows into India. This bottleneck in the form of poor infrastructure discourages foreign investors in investing in India. India’s age old and biggest infrastructure problem is the supply of electricity. Power cuts are considered as a common problem and many industries are forced to close their business. 2. Stringent labor laws: Large firms in India are not allowed to retrench or layoff any workers, or close down the unit without the permission of the state government. These laws protect the workers and thwart legitimate attempts to restructure business. To retrench unnecessary workers, firms require approval from both employees and state governments-approval that is rarely given. Further, Trade Unions extort huge sums from companies through over-generous voluntary retirement schemes. 3. Corruption: Corruption is found in nearly every public service, from defense to distribution of subsidized food to the poor people, to the generation and transmission of electric power. The combination of legal hurdles, lack of institutional reforms, bureaucratic decision-making and the allegations of corruption at the top have turned foreign investors away from India. 4. Lack of decision making authority with the state governments: The reform process of liberalizing the economy is concentrated mainly in the Centre and the State Governments are not given much power. In most key infrastructure areas, the central government remains in control. Brazil, China, and Russia are examples where regional governments take the lead in pushing reforms and prompting further actions by the central government. 5. Limited scale of export processing zones: India’s export processing zones have lacked dynamism because of several reasons, such as their relatively limited scale; the Government’s general ambivalence about attracting FDI; the unclear and changing incentive packages attached to the zones; and the power of the central government in the regulation of the zones. India which established its first Export Processing Zone (EPZ) in 1965 has failed to develop the zones when compared to China which took initiative for establishment only in 1980. 6. High corporate tax rates: Corporate tax rates in East Asia are generally in the range of 15 to 30 percent, compared with a rate of 48 percent for foreign companies in India. High corporate tax rate is definitely a major disincentive to foreign corporate investment in India. 7. Indecisive government and political instability: There were too many anomalies on the government side during past two decades and they are still affecting the direct inflow of FDI in India such as mismanagement and oppression by the different company, which affect the image of the country and also deject the prospective investor, who is very much conscious about safety and constant return on their investment. DETERMINANTS OF FDI:- The determinant varies from one country to another due their unique characteristics and opportunities for the potential investors. In specific the determinants of FDI in India are: 1) Stable policies: India stable economic and socio policies have attracted investors across border. Investors prefer countries which stable economic policies. If the government makes changes in policies which will have effect on the business. The business requires a lot of funds to be deployed and any change in policy against the investor will have a negative effect. 2) Economic factors: Different economic factors encourage inward FDI. These include interest loans, tax breaks, grants, subsidies and the removal of restrictions and limitation. The government of India has given many tax exemption and subsidies to the foreign investors who would help in developing the economy. 3) Cheap and labour: There is abundant labour available in India in terms of skilled and unskilled human resources. Foreign investors will to take advantage of the difference in the cost of labour as we have cheap and skilled labours. Example: Foreign firms have invested in BPO’s in India which require skilled labour and we have been providing the same. 4) Basic infrastructure: India though is a developing country, it has developed special economic zone where there have focused to build required infrastructure such as roads, effective transportation and registered carrier departure worldwide, Information and communication network/technology, powers, financial institutions, and legal system and other basic amenities which are must for the success of the business. A sound legal system and modern infrastructure supporting an efficient distribution of goods and services in the host country.
  • 5. International Journal of Scientific and Research Publications, Volume 5, Issue 10, October 2015 5 ISSN 2250-3153 www.ijsrp.org 5) Unexplored markets: In India there is large scope for the investors because there is a large section of markets have not explored or unutilized. In India there is enormous potential customer market with large middle class income group who would be target group for new markets. Example: BPO was one sector where the investors had large scope exploring the markets where the service was provided with just a call, with almost customer satisfaction. 6) Availability of natural resources: As we that India has large volume of natural resources such as coal, iron ore, Natural gas etc. If natural resources are available they can be used in production process or for extraction of mines by the foreign investors. V. NEED FOR FDI IN INDIA As India is a developing country, capital has been one of the scare resources that are usually required for economic development. Capital is limited and there are many issues such as Health, poverty, employment, education, research and development, technology obsolesce, global competition. The flow of FDI in India from across the world will help in acquiring the funds at cheaper cost, better technology, employment generation, and upgraded technology transfer, scope for more trade, linkages and spillovers to domestic firms. The following arguments are advanced in favour of foreign capital. 1) Sustaining a high level of investment: As all the under-developed and the developing countries want to industrialize and develop themselves, therefore it becomes necessary to raise the level to investment substantially. Due to poverty and low GDP the saving are low. Therefore there is a need to fill the gap between income and savings through foreign direct investments. 2) Technological gap: In Indian scenario we need technical assistance from foreign source for provision if expert services, training of Indian personnel and educational, research and training institutions in the industry. It only comes through private foreign investment or foreign collaborations. 3) Exploitation of natural resources: In India we have abundant natural resources such as coal, iron and steel but to extract the resources we require foreign collaboration. 4) Understanding the initial risk: In developing countries as capital is a scare resource, the risk of investments in new ventures or projects for industrialization is high. Therefore foreign capital helps in these investments which require high risk. 5) Development of basic economic infrastructure: In the recent years foreign financial institutions and government of advanced countries have made substantial capital available to the under developed countries. FDI will help in developing the infrastructure by establishing firm’s different parts of the country. There are special economic zones which have been developed by government for improvising the industrial growth. 6) Improvement in the balance of payments position: The inflow FDI will help in improving the balance of payment. Firms which feel that the goods produced in India will have a low cost, will produce the goods and export the same to other country. This helps in increasing the exports. 7) Foreign firm’s helps in increasing the competition: Foreign firms have always come up with better technology, process, and innovations comparing with the domestic firms. They develop a completion in which the domestic firms will perform better it survive in the market. VI. DATA ANALYSIS AND INTERPRETATION Fact sheet on foreign direct investment (FDI) Table No. 1 Total FDI Inflows (From April, 2000 to June, 2015):- 1 CUMULATIVE AMOUNT OF FDI INFLOWS US$ (Equity inflows + ‘Re-invested earnings’ +‘Other capital’) - 380,215 Million 2 CUMULATIVE AMOUNT OF FDI EQUITY INFLOWS Rs. US$ (excluding, amount remitted through RBI’s NRI Schemes) 1,293,303 258,020 Crore Million
  • 6. International Journal of Scientific and Research Publications, Volume 5, Issue 10, October 2015 6 ISSN 2250-3153 www.ijsrp.org Source: FDI Statistics, Department of Industrial Policy& Promotion, Ministry of Commerce & Industry, Government of India, 2015. Table 1 shows the amount of FDI inflows from April, 2000 to June, 2015. It shows the cumulative amount of FDI Inflows both in terms of Crore and in US $ million. Point 1 shows the sum of equity inflows, reinvested earnings and other capital. Cumulative amount of inflows are 380,215 in US $ million. Other than this, cumulative FDI equity inflows which excludes amount remitted through RBI’s-NRI schemes are 1,293,303 in Crore and 258,020 in US $ million. Table No. 2 FDI Inflows during Financial Year 2015-16 (June, 2015):- 1. TOTAL FDI INFLOWS INTO INDIA US$ (Equity inflows + ‘Re-invested earnings’ + ‘Other capital’) - 2,929 (As per RBI’s Monthly bulletin dated: 10.08.2015). Million 2. FDI EQUITY INFLOWS Rs. US$ 13,115 2,054 Crore Million m Source: FDI Statistics, Department of Industrial Policy& Promotion, Ministry of Commerce & Industry, Government of India, 2015. Table 2 shows the amount of FDI inflows during the Financial Year, 2015(June). It shows the total amount of FDI Inflows both in terms of Crore and in US $ million. Point 1 shows the sum of equity inflows, reinvested earnings and other capital. Total amount of inflows are 2,929 in US $ million. Point 2 shows the FDI equity inflows amounted 13,115 in Crore and 2,054 in US $ million.
  • 7. International Journal of Scientific and Research Publications, Volume 5, Issue 10, October 2015 7 ISSN 2250-3153 www.ijsrp.org Table No. 3 FDI Equity Inflows (Month-wise) during the Financial Year 2015-16:- Financial Year 2015-16 Amount of FDI Equity inflows ( April-March ) (In Rs. Crore) (In US$ mn) 1. April, 2015 22,620 3,605 2. May, 2015 24,564 3,850 3. June, 2015 13,115 2,054 2015-16 (from April, 2015 to June, 2015) 60,299 9,508 2014-15 (from April, 2014 to June, 2014) 43,171 7,235 %age growth over last year ( + ) 40 % ( + ) 31% Source: FDI Statistics, Department of Industrial Policy& Promotion, Ministry of Commerce & Industry, Government of India, 2015. The above Table 3 shows the amount of FDI inflows during Financial Year from April, 2015 to March, 2016 (up to June, 2015). It shows the amount in Rs Crore and in US $ mn. The highest FDI inflows in the country is in the month of May 2015 i.e. 24,564 in Rs Crore and 3,850 in US $ mn. Followed by April, 2015 and June, 2015 with inflows 22,620 in Rs. Crore (3,605 in US$ mn) and 13,115 in Rs. Crore (2,045 in US$ mn) respectively. It can also be observed that there is 40% growth over last year. Table No. 4 FDI Equity Inflows (Month-wise) during the Calendar Year 2015: Calendar Year 2015 Amount of FDI Equity inflows (Jan.-Dec.) (In Rs. Crore) (In US$ mn) 1. January, 2015 27,880 4,481 2. February, 2015 20,397 3,288 3. March, 2015 13,221 2,117 4. April, 2015 22,620 3,605 5. May, 2015 24,564 3,850 6. June, 2015 13,115 2,054 Year 2015 (up to June, 2015) # 121,797 19,394 Year 2014 (up to June, 2014) # 90,876 14,975 %age growth over last year ( + ) 34 % ( + ) 30%
  • 8. International Journal of Scientific and Research Publications, Volume 5, Issue 10, October 2015 8 ISSN 2250-3153 www.ijsrp.org Source: FDI Statistics, Department of Industrial Policy& Promotion, Ministry of Commerce & Industry, Government of India, 2015. The above Table 4 shows the amount of FDI inflows during the Calendar Year January, 2015 to December, 2015(up to June, 2015). It shows the amount in Rs Crore and in US $ mn. The highest FDI inflows in the country is in the month January 2015 i.e. 27,880 in Rs Crore and 4,481 in US $ mn. Month like January 2014 have 13,589 in Rs Crore and 2,189 in US $ mn. Comparing both we can observe that there is a 34% growth in FDI inflow. Table No. 5 Share of Top Investing Countries FDI Equity Inflows (Financial Years):- Amount Rupees in Crores (US$ in millions) Ranks Country 2013-14 2014-15 2015-16 Cumulative %age to total ( April - (April – (April,15 – Inflows Inflows March) March) June, 15 ) (April ’00 - (in terms June ‘15) of US $) 1. MAURITIUS 29,360 55,172 13,236 438,892 35 % (4,859) (9,030) (2,089) (89,644) 2. SINGAPORE 35,625 41,350 23,320 190,477 14 % (5,985) (6,742) (3,673) (35,861) 3. U.K. 20,426 8,769 755 110,409 9 % (3,215) (1,447) (119) (22,329) 4. JAPAN 10,550 12,752 2,916 96,312 7 % (1,718) (2,084) (459) (18,811) 5. NETHERLANDS 13,920 20,960 4,123 81,381 6 % (2,270) (3,436) (652) (15,323) 6. U.S.A. 4,807 11,150 3,959 70,839 6 % (806) (1,824) (627) (14,378) 7. GERMANY 6,093 6,904 3,497 42,007 3 % (1,038) (1,125) (554) (8,198) 8. CYPRUS 3,401 3,634 608 39,971 3 % (557) (598) (96) (8,140) 9 FRANCE 1,842 3,881 877 23,465 2 % (305) (635) (138) (4,651) 10. SWITZERLAND 2,084 2,066 598 15,812 1 % (341) (337) (94) (3,139) TOTAL FDI INFLOWS FROM 147,518 189,107 60,298 1,293,836 -ALL COUNTRIES * (24,299) (30,931) (9,508) (258,141)
  • 9. International Journal of Scientific and Research Publications, Volume 5, Issue 10, October 2015 9 ISSN 2250-3153 www.ijsrp.org Source: FDI Statistics, Department of Industrial Policy& Promotion, Ministry of Commerce & Industry, Government of India, 2015. The above Table No.5 depicts the country having the highest FDI in India. The report shows that the MAURITIUS country has the highest foreign investor in India with 34%. After Mauritius, Singapore and U.K. invest the highest FDI in India with 14% and 9% respectively. Japan also gets 4th position with 7% FDI in India. Table No. 6 SECTORS ATTRACTING HIGHEST FDI EQUITY INFLOWS: Amount in Rs. Crores (US$ in millions) Ranks Sector 2013-14 2014-15 2015-16 Cumulative % age to total (April - (April- (April,15 – Inflows Inflows March) March) June, 15 ) (April ’00 - (In terms of June ‘15) US$) 1. SERVICES SECTOR 13,294 19,963 4,036 209,578 17 % (2,225) (3,253) (636) 43,350) 2. CONSTRUCTION DEVELOPMENT: 7,508 4,582 216 113,355 TOWNSHIPS, HOUSING, BUILT-UP (1,226) (758) (34) (24,098) 9 % INFRASTRUCTURE 3. COMPUTER SOFTWARE & 6,896 13,564 16,245 89,481 7 % HARDWARE (1,126) (2,200) (2,556) (17,575) 4. TELECOMMUNICATIONS 7,987 17,372 2,517 86,609 7 % (radio paging, cellular mobile, basic (1,307) (2,895) (395) (17,453) telephone services) 5. AUTOMOBILE INDUSTRY 9,027 15,794 6,914 70,906 5 % (1,517) (2,570) (1,094) (13,477) 6. DRUGS & PHARMACEUTICALS 7,191 9,211 1,370 66,652 5 % (1,279) (1,523) (215) (13,336) 7. CHEMICALS (OTHER THAN 4,738 4,077 1,598 50,909 4 % FERTILIZERS) (878) (669) (251) (10,588) 8. POWER 6,519 3,985 1,717 48,357 4 % (1,066) (657) (271) (9,828) 9. TRADING 8,191 16,962 5,679 49,479 4 % (1,343) (2,761) (897) (8,958) 10 METALLURGICAL INDUSTRIES 3,436 2,897 845 41,992 3 % (568) (472) (133) (8,680)
  • 10. International Journal of Scientific and Research Publications, Volume 5, Issue 10, October 2015 10 ISSN 2250-3153 www.ijsrp.org Source: FDI Statistics, Department of Industrial Policy& Promotion, Ministry of Commerce & Industry, Government of India, 2015. The above Table No.6 depicts the sector having the highest FDI equity inflow in India. The report shows that Service sector has the highest FDI Equity inflow 17%, followed by Construction development, Computer Software and Hardware, Telecommunication, Automobile Industry sector having 9%, 7%, 7%, and 5% respectively. Other sectors like Drugs and Pharmaceuticals carries 5% and Chemicals, Power, Trading Industries carries 4% FDI inflow each , whereas the least is of Metallurgical industries – 3%. Table No. 7 FINANCIAL YEAR-WISE FDI INFLOWS DATA: I. As per International Best Practices. Amount in (US$ in millions) S. Financial Year FOREIGN DIRECT INVESTMENT (FDI) Investment No. (April-March) by FII’s Equity Re- Other FDI FLOWS INTO INDIA Foreign invested capital Institutional earnings + l Investors RBI’s capital of + %age Fund Automatic unincorpora growth (net) Route/ ted bodies Total over Acquisition FDI previous Route Flows year (in US$ terms) FINANCIAL YEARS 2000-01 to 2015-16 (up to JUNE, 2015) 1. 2000-01 2,339 61 1,350 279 4,029 - 1,847 2. 2001-02 3,904 191 1,645 390 6,130 (+) 52 % 1,505 3. 2002-03 2,574 190 1,833 438 5,035 (-) 18 % 377 4. 2003-04 2,197 32 1,460 633 4,322 (-) 14 % 10,918 5. 2004-05 3,250 528 1,904 369 6,051 (+) 40 % 8,686 6. 2005-06 5,540 435 2,760 226 8,961 (+) 48 % 9,926 7. 2006-07 15,585 896 5,828 517 22,826 (+) 155 % 3,225 8. 2007-08 24,573 2,291 7,679 300 34,843 (+) 53 % 20,328 9. 2008-09 31,364 702 9,030 777 41,873 (+) 20 % (-) 15,017 10. 2009-10 25,606 1,540 8,668 1,931 37,745 (-) 10 % 29,048 11. 2010-11 (P) 21,376 874 11,939 658 34,847 (-) 08 % 29,422 12. 2011-12 (P) 34,833 1,022 8,206 2,495 46,556 (+) 34 % 16,812 13. 2012-13 (P) 21,825 1,059 9,880 1,534 34,298 (-) 26% 27,582 14 2013-14 (P) 24,299 975 8,978 1,794 36,046 ( + ) 5% 5,009 15. 2014-15 (P) 30,933 952 8,983 3,423 44,291 ( + ) 23%40,923 16. 2015-16 (P) (Apr - June 2015) 9,508 223 2,059 572 12,362 (-) 1,642 CUMULATIVE TOTAL 259,706 11,971 92,202 16,336 380,215 - 188,949(from April, 2000 to June, 2015)
  • 11. International Journal of Scientific and Research Publications, Volume 5, Issue 10, October 2015 11 ISSN 2250-3153 www.ijsrp.org Source: RBI’s Bulletin July, 2015 dt.10.08.2015 (Table No. 34 – FOREIGN INVESTMENT INFLOWS). Table No. 8 II. DIPP’s – Financial Year-wise FDI Equity Inflows: (As per DIPP’s FDI data base – equity capital components only): S. No. Financial Year Amount of FDI Inflows %age growth (April – March) over previous FINANCIAL YEARS 2000-01 to 2015-16 (up to June, 2015) In Rs Crores In US$ million year (in terms of US $) 1. 2000-01 10,733 2,463 - 2. 2001-02 18,654 4,065 ( + ) 65 % 3. 2002-03 12,871 2,705 ( - ) 33 % 4. 2003-04 10,064 2,188 ( - ) 19 % 5. 2004-05 14,653 3,219 ( + ) 47 % 6. 2005-06 24,584 5,540 ( + ) 72 % 7. 2006-07 56,390 12,492 (+ )125 % 8. 2007-08 98,642 24,575 ( + ) 97 % 9. 2008-09 142,829 31,396 ( + ) 28 % 10. 2009-10 123,120 25,834 ( - ) 18 % 11. 2010-11 97,320 21,383 ( - ) 17 % 12. 2011-12 165,146 35,121 (+) 64 % 13. 2012-13 121,907 22,423 (-) 36 % 14. 2013-14 147,518 24,299 (+) 8% 15. 2014-15 189,107 30,931 (+) 27% 16. 2015-16 (Apr - June 2015) 60,298 9,508 CUMULATIVE TOTAL (from April, 2000 to June, 2015) 1,293,836 258,142 - Source: RBI’s Bulletin July, 2015 dt.10.08.2015 (Table No. 34 – FOREIGN INVESTMENT INFLOWS). The above Table No. 8 shows the total amount of FDI inflows in India during the last 15 years i.e. 2000 to 2015. The FDI inflow from 2000-2001 i.e. 10,733 Crore Rs. in 2001-02 it was 18,654 Crore rupees. It shows the Good result in the FDI inflows in India. Little bit ups and downs in FDI inflows up to 2005-06, but after that great hike in the year 2007-08 i.e. 98,642crore rupees as compare to earlier years. In 2008-2009 there was a huge investment in FDI in 142,829 Crore Rupees and so on. But again there were some fluctuations in inflow of FDI in the years between 2010-2014,soon giving the highest figures in last 15 years 1,89,107 Crore Rupees FDI in 2014-2015 So we can say that the foreign investment have been on rise in India. Currently the inflow of FDI from April, 2015 to June, 2015 figures 60,298. Table No. 9 III. RBI’S REGIONAL OFFICES (WITH STATE COVERED) RECEIVED FDI EQUITY INFLOWS (From April, 2000 to June, 2015) Amount Rupees in Crores (US$ in millions) S. RBI’s - Regional State covered 2013-14 2014-15 2015-16 Cumulative %age to No. Office2 ( April - ( April - (April,15 Inflows total March) March) – June, 15 ) (April ’00 - Inflows June ‘15) (in terms of US$) 1 MUMBAI MAHARASHTR A, 20,595 38,933 12,538 365,560 29 DADRA & (3,420) (6,361) (1,979) (75,097)
  • 12. International Journal of Scientific and Research Publications, Volume 5, Issue 10, October 2015 12 ISSN 2250-3153 www.ijsrp.org NAGAR HAVELI, DAMAN & DIU 2 NEW DELHI DELHI, PART OF 38,190 42,252 19,892 268,915 20 UP AND (6,242) (6,875) (3,128) (52,539) HARYANA 3 CHENNAI TAMIL NADU, 12,595 23,361 5,828 94,595 7 PONDICHERR Y (2,116) (3,818) (924) (17,938) 4 BANGALORE KARNATAKA 11,422 21,255 8,447 90,569 7 (1,892) (3,444) (1,336) (17,456) 5 AHMEDABAD GUJARAT 5,282 9,416 4,732 58,529 5 (860) (1,531) (745) (11,786) 6 HYDERABAD ANDHRA 4,024 8,326 2,681 51,921 4 PRADESH (678) (1,369) (422) (10,437) 7 KOLKATA WEST BENGAL, 2,659 1,464 689 15,316 1 SIKKIM, (436) (239) (108) (3,089) ANDAMAN & NICOBAR ISLANDS 8 CHANDIGARH` CHANDIGARH,562 234 91 6,452 1 PUNJAB, (91) (39) (14) (1,345) HARYANA, HIMACHAL PRADESH 9 JAIPUR RAJASTHAN 233 3,237 109 6,904 1 (38) (541) (17) (1,281) 10. BHOPAL MADHYA 708 601 9 6,105 1 PRADESH, (119) (100) (2) (1,217) CHATTISGAR H 11 KOCHI KERALA, 411 1,418 35 6,186 1 LAKSHADWEE P (70) (230) (6) (1,216) 12 PANAJI GOA 103 211 81 3,949 0.3 (17) (35) (13) (836) 13 KANPUR UTTAR 150 679 137 2,581 0.2 PRADESH, (25) (110) (22) (504) UTTRANCHAL 14 BHUBANESHWA R ORISSA 288 56 3 1,964 0.2 (48) (9) (0.4) (398) 15 GUWAHATI ASSAM, 4 29 37 418 0.03 ARUNACHAL (0.6) (5) (6 (89) PRADESH, MANIPUR, MEGHALAYA, MIZORAM, NAGALAND, TRIPURA 16 PATNA BIHAR, 9 68 234 501 0.03 JHARKHAND (1) (11) (37) (87) 17 JAMMU JAMMU & 1 25 0.00 26 0.00
  • 13. International Journal of Scientific and Research Publications, Volume 5, Issue 10, October 2015 13 ISSN 2250-3153 www.ijsrp.org KASHMIR (0.2) (4) (0.00) (4) 18 REGION NOT INDICATED 50,283 37,544 4,754 (750) 312,814 24 (8,245) (6,211) (62,700) SUB. TOTAL 147,518 189,107 60,298 1,293,303 (24,299) (30,931) (9,508) (258,020) 19 RBI’S-NRI SCHEMES 0 0 0 533 - (from 2000 to 2002) (121) GRAND TOTAL 147,518 189,107 60,298 1,293,836 - (24,299) (30,931) (9,508)) (258,141) The above table represents region-wise FDI equity inflows from 2000-15 both in terms of ` Crore and US $ million. Table shows that Mumbai has registered largest FDI inflow (365,560 Crore) amounting to 29% of total inflow received in last 15 years. New Delhi is the second preferred region for FDI inflow (268,915 Crore) with 20% of total inflows received in last 15 years. This is due to good quality infrastructure and better quality of life provided in these cities. Other regions like Bangalore (90,569 Crore), Chennai (94,595 Crore), Ahmedabad (58,529 Crore), Hyderabad (51,921 Crore) have also recorded FDI with 7%, 7%, 5% and 4% of total FDI in the country respectively. Bangalore is the primary destination for property investment and the city has riding high on the Information Technology (IT). Other regions like Kolkata (15,316 Crore), Chandigarh (6,452 Crore), Jaipur (6,904 Crore) and Bhopal (6,105 Crore) have been able to attract very less FDI because they lack in infrastructure and information technology (IT) developments. Sectors like service, construction developments, telecommunications and computer software & hardware have been registering highest FDI inflows in India. Therefore, Mumbai, New Delhi, Bangalore and Chennai are the favourite destinations for FDI in India. Table No. 10 Statement on Country-wise FDI Equity Inflows From April 2000 to June 2015 Sr.No Name of the Country Amount of Foreign Direct Investment Inflows %age with Inflows (In Rs Crore) (In US$ million) 1. Mauritius 438,892.83 89,644.04 34.74 2. Singapore 190,477.19 35,860.84 13.90 3. United Kingdom 110,409.19 22,329.12 8.65 4. Japan 96,312.05 18,811.08 7.29 5. Netherlands 81,381.00 15,323.43 5.94 6. U.S.A 70,838.85 14,377.97 5.57 7. Germany 42,006.79 8,197.45 3.18 8. Cyprus 39,971.34 8,139.55 3.15 9. France 23,464.77 4,651.30 1.80 10. Switzerland 15,812.31 3,138.47 1.22 11. UAE 15,633.58 3,125.58 1.21 12. Spain 10,938.49 2,115.93 0.82 13. Italy 8,207.00 1,651.98 0.64
  • 14. International Journal of Scientific and Research Publications, Volume 5, Issue 10, October 2015 14 ISSN 2250-3153 www.ijsrp.org 14. South Korea 8,097.50 1,602.61 0.62 15. Hong Kong 7,970.71 1,557.56 0.60 16. Luxembourg 7,345.75 1,306.38 0.51 17. Cayman Islands 5,861.47 1,214.92 0.47 18. China 6,941.05 1,160.64 0.45 19. Sweden 5,342.40 1,103.84 0.43 20. Russia 5,874.87 1,070.57 0.41 21. British Virginia 3,993.91 858.89 0.33 22. Belgium 4,255.84 814.58 0.32 23. Malaysia 3,894.87 744.14 0.29 24. Australia 3,463.02 695.21 0.27 25. Indonesia 2,902.07 623.09 0.24 26. Poland 3,300.58 619.56 0.24 27. Canada 2,776.75 559.60 0.22 28. The Bermudas 2,252.20 502.07 0.19 29. Denmark 2,085.54 417.37 0.16 30. Oman 1,797.55 380.15 0.15 31. Finland 1,799.71 354.10 0.14 32. Ireland 1,759.34 332.37 0.13 33. South Africa 1,537.33 290.01 0.11 34. Austria 1,292.03 252.68 0.10 35. Thailand 1,105.29 207.27 0.08 36. Seychelles 1,107.50 183.69 0.07 37. Norway 941.15 181.16 0.07 38. Chile 710.49 150.23 0.06 39. Morocco 654.96 137.85 0.05
  • 15. International Journal of Scientific and Research Publications, Volume 5, Issue 10, October 2015 15 ISSN 2250-3153 www.ijsrp.org 40. Philippines 765.53 129.03 0.05 41. Turkey 696.10 127.70 0.05 42. British Isles 463.88 100.65 0.04 Sr.No Name of the Country Amount of Foreign Direct Investment Inflows %age with Inflows (In Rs Crore) (In US$ million) 43. Taiwan 512.88 99.78 0.04 44. Israel 445.28 87.02 0.03 45. Mexico 438.76 80.08 0.03 46. West Indies 348.17 78.28 0.03 47. Saudi Arabia 300.70 58.13 0.02 48. St. Vincent 277.61 53.44 0.02 49. New Zealand 266.11 52.01 0.02 50. Virgin Islands(US) 278.61 50.73 0.02 51. Bahrain 275.46 52.86 0.02 52. Panama 204.45 43.69 0.02 53. Bahamas 190.35 38.66 0.01 54. Sri Lanka 189.72 37.71 0.01 55. Korea(North) 188.88 37.22 0.01 56. Saint Kitts & Nevis 148.66 33.66 0.01 57. Channel Islands 173.21 31.90 0.01 58. Portugal 160.21 31.75 0.01 59. Jordan 159.58 29.30 0.01 60. Kuwait 143.68 27.96 0.01 61. Kazakhstan 134.16 26.11 0.01 62. Brazil 116.68 23.60 0.01 63. Kenya 102.52 21.75 0.01
  • 16. International Journal of Scientific and Research Publications, Volume 5, Issue 10, October 2015 16 ISSN 2250-3153 www.ijsrp.org 64. Czech Republic 99.97 21.37 0.01 65. Iceland 93.72 21.14 0.01 66. Bermuda 127.07 20.31 0.01 67. Gibraltar 85.36 19.79 0.01 68. Hungary 90.77 17.23 0.01 69. Isle of Man 82.23 15.58 0.01 70. Malta 69.10 14.65 0.01 71. Liberia 64.54 14.56 0.01 72. Nigeria 66.39 13.22 0.01 73. Scotland 73.29 12.83 0.00 74. Belarus 50.52 12.27 0.00 75. SAMOA ISLANDS 74.13 11.83 0.00 76. Argentina 46.35 10.17 0.00 77. Liechtenstein 47.69 9.49 0.00 78. Myanmar 35.75 8.96 0.00 79. Slovenia 40.58 8.49 0.00 80. Ghana 40.53 7.68 0.00 81. Romania 37.86 7.01 0.00 82. Greece 36.07 6.52 0.00 83. Maldives 26.85 5.84 0.00 84. Belize 25.68 5.61 0.00 85. Slovakia 23.89 5.42 0.00 86. Qatar 28.51 5.16 0.00 87. Rep. of Fiji Islands 22.30 5.07 0.00
  • 17. International Journal of Scientific and Research Publications, Volume 5, Issue 10, October 2015 17 ISSN 2250-3153 www.ijsrp.org 88. Uruguay 21.38 4.49 0.00 Sr.No Name of the Country Amount of Foreign Direct Investment Inflows %age with Inflows (In Rs Crore) (In US$ million) 89. Tunisia 19.84 4.31 0.00 90. Guernsey 23.84 4.30 0.00 91. Ukraine 21.80 3.81 0.00 92. Egypt 17.90 3.30 0.00 93. Colombia 14.18 2.59 0.00 94. West Africa 12.31 2.47 0.00 95. Trinidad & Tobago 12.73 2.34 0.00 96. Nepal 9.71 2.03 0.00 97. Yemen 7.74 1.87 0.00 98. Tanzania 8.35 1.74 0.00 99. Lebanon 9.70 1.67 0.00 100 Monaco 7.49 1.52 0.00 101 SAN MARINO 9.41 1.52 0.00 102 Bulgaria 8.21 1.41 0.00 103 Uganda 5.07 1.10 0.00 104 Cuba 4.73 1.04 0.00 105 Guyana 4.60 1.00 0.00 106 Vanuatu 4.41 0.94 0.00 107 Togolese Republic 4.65 0.86 0.00 108 Botswana 3.79 0.60 0.00 109 Iran 3.30 0.57 0.00 110 Estonia 2.99 0.57 0.00 111 Congo (DR) 2.41 0.54 0.00
  • 18. International Journal of Scientific and Research Publications, Volume 5, Issue 10, October 2015 18 ISSN 2250-3153 www.ijsrp.org 112 Croatia 2.29 0.52 0.00 113 Jamaica 2.70 0.50 0.00 114 TAJIKISTAN 2.87 0.46 0.00 115 Vietnam 2.33 0.43 0.00 116 Aruba 1.96 0.43 0.00 117 Anguilla 1.47 0.29 0.00 118 Lithuania 1.84 0.29 0.00 119 Yugoslavia 1.13 0.24 0.00 120 Iraq 1.02 0.22 0.00 121 Zambia 0.88 0.18 0.00 122 Peru 0.82 0.14 0.00 123 Latvia 0.52 0.10 0.00 124 Georgia 0.62 0.10 0.00 125 St. Lucia 0.61 0.10 0.00 126 SURINAME 0.54 0.09 0.00 127 Libya 0.28 0.07 0.00 128 Mongolia 0.27 0.06 0.00 129 Bangladesh 0.31 0.05 0.00 130 Sudan 0.24 0.05 0.00 131 Costa Rica 0.29 0.05 0.00 132 Afghanistan 0.12 0.03 0.00 133 Muscat 0.06 0.01 0.00 134 Venezuela 0.03 0.01 0.00
  • 19. International Journal of Scientific and Research Publications, Volume 5, Issue 10, October 2015 19 ISSN 2250-3153 www.ijsrp.org Sr.No Name of the Country Amount of Foreign Direct Investment Inflows %age with Inflows (In Rs Crore) (In US$ million) 135 Algeria 0.03 0.00 0.00 136 East Africa 0.02 0.00 0.00 137 Cameroon 0.01 0.00 0.00 138 Bolivia 0.01 0.00 0.00 139 Barbados 0.01 0.00 0.00 140 Kyrgyzstan 0.01 0.00 0.00 141 Djibouti 0.00 0.00 0.00 142 Paraguay 0.00 0.00 0.00 143 MOZAMBIQUE 0.00 0.00 0.00 144 SENEGAL 0.00 0.00 0.00 145 Ivory Coast 0.00 0.00 0.00 146 FII's 0.25 0.06 0.00 147 NRI 20,383.66 4,684.25 1.82 148 Country Details Awaited 30,875.37 6,964.32 2.70 Source: (i) RBI’s Bulletin July, 2015 dt.10.08.2015. 1,293,302.75 258,020.10 Sub Total 149 RBI’S-NRI SCHEMES (2000- 533.06 121.33 2002) Grand Total 1,293,835.81 258,141.43
  • 20. International Journal of Scientific and Research Publications, Volume 5, Issue 10, October 2015 20 ISSN 2250-3153 www.ijsrp.org Table No. 11 STATEMENT ON SECTOR-WISE FDI EQUITY INFLOWS FROM APRIL, 2000 TO JANUARY, 2015 Sr. No Sector Amount of FDI Inflows %age of Total Inflows (In Rs (In US$ Crore) millions) 1 Services Sector 201,728.28 42,101.98 17.32 2 Construction Development: Townships, Housing, Built-Up 112,916.36 24,028.19 9.88 Infrastructure And Construction-Development Projects 3 Telecommunications 83,697.07 16,994.68 6.99 4 Computer Software & Hardware 67,693.78 14,125.19 5.81 5 Drugs & Pharmaceuticals 63,629.47 12,856.02 5.29 6 Automobile Industry 60,725.08 11,857.11 4.88 7 Chemicals (Other Than Fertilizers) 48,641.77 10,229.69 4.21 8 Power 46,358.87 9,512.02 3.91 9 Metallurgical Industries 40,737.61 8,480.90 3.49 10 Hotel & Tourism 40,198.41 7,774.03 3.20 11 Trading 41,315.28 7,660.73 3.15 12 Petroleum & Natural Gas 31,650.29 6,519.53 2.68 13 Food Processing Industries 36,360.11 6,215.46 2.56 14 Miscellaneous Mechanical & Engineering Industries 20,572.50 3,948.17 1.62 15 Information & Broadcasting (Including Print Media) 19,156.59 3,890.94 1.60 16 Electrical Equipments 18,298.41 3,786.22 1.56 17 Non-Conventional Energy 18,524.21 3,521.78 1.45 18 Industrial Machinery 18,420.29 3,515.67 1.45 19 Cement And Gypsum Products 14,625.29 3,085.60 1.27 20 Construction (Infrastructure) Activities 14,807.38 2,923.64 1.20 21 Hospital & Diagnostic Centers 14,565.34 2,793.72 1.15 22 Consultancy Services 13,908.16 2,786.52 1.15
  • 21. International Journal of Scientific and Research Publications, Volume 5, Issue 10, October 2015 21 ISSN 2250-3153 www.ijsrp.org 23 Fermentation Industries 11,347.67 2,137.36 0.88 24 Agriculture Services 8,625.15 1,744.02 0.72 25 Rubber Goods 9,445.03 1,722.64 0.71 26 Mining 8,460.61 1,668.50 0.69 27 Ports 6,730.91 1,637.30 0.67 28 Textiles (Including Dyed, Printed) 7,710.42 1,555.69 0.64 29 Electronics 6,752.74 1,417.42 0.58 30 Sea Transport 6,546.83 1,368.93 0.56 31 Prime Mover (Other Than Electrical Generators) 6,299.78 1,200.92 0.49 32 Education 5,649.81 1,071.50 0.44 33 Paper And Pulp (Including Paper Products) 4,327.04 910.25 0.37 34 Medical And Surgical Appliances 4,608.04 887.09 0.36 35 Soaps, Cosmetics & Toilet Preparations 4,430.06 848.74 0.35 36 Machine Tools 3,511.68 711.51 0.29 37 Ceramics 3,321.89 699.57 0.29
  • 22. International Journal of Scientific and Research Publications, Volume 5, Issue 10, October 2015 22 ISSN 2250-3153 www.ijsrp.org Sr.No Sector Amount of FDI Inflows %age of Total Inflows (In Rs (In US$ Crore) millions) 38 Railway Related Components 3,425.97 634.20 0.26 39 Diamond, Gold Ornaments 2,904.78 569.14 0.23 40 Air Transport (Including Air Freight) 2,720.46 562.65 0.23 41 Fertilizers 2,915.62 543.14 0.22 42 Vegetable Oils And Vanaspati 2,861.12 541.65 0.22 43 Glass 2,362.19 459.16 0.19 44 Printing Of Books (Including Litho Printing Industry) 2,326.52 446.09 0.18 45 Agricultural Machinery 2,127.62 413.93 0.17 46 Commercial, Office & Household Equipments 1,516.81 309.34 0.13 47 Retail Trading (Single Brand) 1,549.92 275.38 0.11 48 Earth-Moving Machinery 1,138.86 234.81 0.10 49 Scientific Instruments 960.98 171.98 0.07 50 Leather, Leather Goods And Pickers 709.83 137.92 0.06 51 Tea And Coffee (Processing & Warehousing Coffee & Rubber) 497.78 108.41 0.04 52 Timber Products 537.09 101.93 0.04 53 Sugar 405.65 78.07 0.03 54 Dye-Stuffs 417.28 74.38 0.03 55 Photographic Raw Film And Paper 273.76 67.29 0.03 56 Industrial Instruments 310.86 67.11 0.03 57 Boilers And Steam Generating Plants 314.80 63.33 0.03 58 Glue And Gelatin 211.68 37.86 0.02 59 Coal Production 119.19 27.73 0.01 60 Mathematical, Surveying And Drawing Instruments 39.80 7.98 0.00
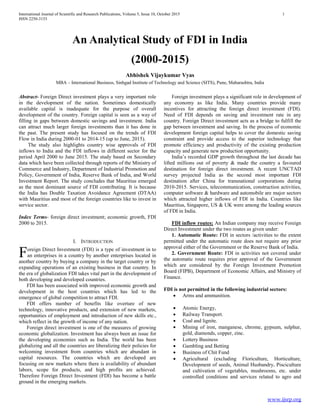
  • 23. International Journal of Scientific and Research Publications, Volume 5, Issue 10, October 2015 23 ISSN 2250-3153 www.ijsrp.org Source: (i) RBI’s Bulletin July, 2015 dt.10.08.2015.  GRAPHICAL REPRESENTATION OF THE ABOVE TABLES :- I. Graph 1(Table 5) :- The largest inflows of FDI’s over the period of April 2000 to June 2015 have been received from Mauritius, its share in these inflows have being as high as 35%. Singapore is second with a share of 14%. The other major sources of foreign direct investment are from UK, Japan, Netherlands, U.S.A., Cyprus, Germany, France, Switzerland and their respective share of inflow of FDI are 9%, 7%, 6%, 6%, 3%, 3%, 2%, and 1`% respectively. The inflows from U.S.A are routed through Mauritius due to tax advantage. The tax advantage emanates from the double tax avoidance agreement that India has with that country USA. This agreement means that any foreign investor has the option of paying tax either in India or in Mauritius. 61 Defense Industries 24.84 5.02 0.00 62 Coir 22.05 4.07 0.00 63 Miscellaneous Industries 42,392.57 8,975.05 3.69 Sub Total 1,199,386.19 243,106.84 100 64 RBI’s- NRI Schemes (2000-2002) 533.06 121.33 - Grand Total 1,199,919.25 243,228.17
  • 24. International Journal of Scientific and Research Publications, Volume 5, Issue 10, October 2015 24 ISSN 2250-3153 www.ijsrp.org The tax rates in Mauritius are amongst the lowest in the world. The other big investors included Singapore, the US, Britain and the Netherlands. While investors get higher returns on their money in India, those from Mauritius “get even higher returns on their capital as we have a double taxation avoidance treaty (DTAT) (with the island nation),” Crisil principal economist, Mr. D.K. Joshi. There have been changes in the source countries due to the change of policies in 1991. Prior to 1991, India depended on a few developed western countries for capital. These included countries like Israel, Australia, South Korea, Malaysia; Singapore etc. after the policies have been implemented countries which did not had any share in India’s FDI such as Thailand, Saudi Arabia and South Africa etc. II. Graph 2(Table 6) :-
  • 25. International Journal of Scientific and Research Publications, Volume 5, Issue 10, October 2015 25 ISSN 2250-3153 www.ijsrp.org SECTORAL COMPOSITION OF FDI:- The Sectoral composition of FDI over the period of April 2000 to June 2015, we can find that the largest recipient of such investment is service sector (Financial and non-financial services). The share of this sector in cumulative FDI flows is 27 % of the inflow total foreign direct investment. The foreign investors are interested in mainly financial services due its profit generating advantage. This sector gives scope for the foreign investor to takes back the profits to the home country. As service sector the services are consumed in the host country and there by generating outflow of funds from the host country. The second recipient is Construction Development sector which shares 14% of total FDI. Telecommunication, Computer software and hardware, Drugs and pharmaceuticals, Automobile industry, Chemical ( Other than Fertilizers),Power, Metallurgical industries, Hotel and tourism contribute 11%,11%,8%,8%,7%,6%,6%2% respectively. The keys takeaways regarding global flows are – the increase in the relative share of developing countries as both destination and sources and flow to the sector gaining over manufacturing. There are Sectoral limits or caps designed by the RBI to limit the foreign direct investments. 100% investment has been allowed to the following sectors- private sector banking, NBFC’S, petroleum, housing and Real estate, Hotel and tourism, road and highways, ports and harbors, advertising, films, mass raped transportation, power, drug and pharmaceuticals, pollutions control and management and special economic zones. Other sectors such as airports are allowed with 74% caps and telecommunication with 49% and insurance with 26%. III. Graph 3(Table 8) :- PERCENTAGE GROWTH ANALYSIS (YEAR WISE): The above graph shows the total amount of FDI inflows in India during the last 15 years i.e. 2000 to 2015. The FDI inflow from 2000-2001 i.e. 10,733crore Rs. in 2001-02 it was 18,654 Crore rupees. It shows the Good result in the FDI inflows in India. Little bit ups and downs in FDI inflows up to 2005-06, but after that great hike in the year 2007-08 i.e. 98,642crore rupees as compare to earlier years. In 2008-2009 there was a huge investment in FDI in 142,829 Crore Rupees. But then there was a downfall in Inflow of FDI in two consecutive years 2009-2010 and 2010-2011, with figures 123,120 and 97,320 respectively. We can analysis from the graph that in the year 2011-2012 the inflow of FDI was second highest of last 15 years i.e. 165,146.Year 2012-13 and 2013-14 the FDI inflow fluctuated from 121,907 to 147,618 respectively. In last Financial Year i.e. 2014-2015 the amount of FDI Inflow were 189,107 which is the highest FDI inflow in last 15 years. Recently in the month of June 2015 there was inflow of 60,298 Crore Rs. .
  • 26. International Journal of Scientific and Research Publications, Volume 5, Issue 10, October 2015 26 ISSN 2250-3153 www.ijsrp.org So we can say that the foreign investment have been fluctuating but rising as well in India. IV. Graph 4(Table 3) :- The above bar graph represents the amount of FDI inflows from April 2015 to June, 2015. It shows the amount in Crore Rs. The highest FDI inflows in the country is in the month May 2015 i.e. 24,564 in Rs Crores and 3,850 in US $ mn. Other months shows the fluctuating trend. V. Graph 5(Table 9) :- The above Figure shows the top five regions in India attracting FDI. It shows that out of 51,437 of Cumulative FDI inflow in the financial year April, 2015 to June, 2015, 43% share of the total investment is carried by Mumbai region; also it continues to attract maximum foreign investments followed by 30% - New Delhi, 10% - Chennai, 10% - Bangalore and 7% - Ahmedabad. VI. ATTRACTING LARGER FDI INFLOWS IN INDIA- PROBLEMS AND CHALLENGES Both India and China are competing to get a larger share in world trade and investment. Although China continues to be India’s major competitor, many new economies like Indonesia, Vietnam and Philippines have emerged as strong competitors. India’s main competitive advantage lies in its lower labour costs and remunerative domestic markets. But India is fast losing its competitive advantage to countries like Indonesia and Vietnam as investors are shifting FDI away from known growth engines towards these new emerging economies.
  • 27. International Journal of Scientific and Research Publications, Volume 5, Issue 10, October 2015 27 ISSN 2250-3153 www.ijsrp.org No doubt Indian government has implemented several reform measures in order to attract greater FDI but there are several studies which have highlighted India’s weak spots. One such report is “Doing Business 2014”, an annual report co-published by the World Bank and International Finance Corporation that brings out the differences in business regulations and their implementation across economies. Table: Doing Business in India Rank Ease of doing business 134 Starting a business 179 Dealing with construction permits 182 Getting electricity 111 Registering property 92 Getting credit 28 Protecting investors 34 Paying taxes 158 Trading across borders 132 Enforcing contracts 186 Resolving insolvency 121 Analysis of Inflows of Foreign Direct Investment in India: The table above indicates that India is performing well only on two indicators, namely, getting credit and protecting investors. India’s performance on three indicators, namely, starting a business, dealing with construction permits and enforcing contracts shows a dismal picture of the investment climate in India. Another report “Global Competitiveness Report” published annually by “World Economic Forum” ranks 148 economies on their competitiveness with respect to indicators like infrastructure, institutions, macro-economic stability, innovation etc. India’s overall rank for 2013-14 on the Global Competitiveness Index was 60. The most problematic factors for doing business identified in the report are inadequate supply of infrastructure, corruption, inefficient government bureaucracy, policy instability, tax regulation and restrictive labor regulations.  MAJOR IMPEDIMENTS: The major deterrents to larger flows of FDI to India are listed below: 1) Weak infrastructure: Infrastructural bottlenecks continue to be a major cause of concern in India. When it comes to competition, India doesn’t stand against other emerging markets in terms of ports, roads, skills sets, education etc. Even after six decades of planned economic development, India suffers from poor transport links, inadequate power supply, poor roads, and frequent power cuts, delays in ports, water and sewerage problems and so on. A study conducted by the Federation of Indian Chambers of Commerce and Industry in 2013, revealed that each day Indian companies are losing up to Rs. 40,000 because of power shortages; and due to power cuts, 61% companies suffer more than 10% loss in production. Warehousing and cold storage facilities are also in short supply, because of which 40% of the fruits, vegetables and other perishable products get destroyed before reaching the markets. In the World Competitiveness Index for 2013-14, India ranked 85 out of 148 countries for its infrastructure, much behind China which ranked 48. 2) Complicated tax structure: Stability and transparency in tax regime along with clarity in tax laws can have far reaching impact on investments in any country. The taxation policies in India remain inherently complex despite the fact that government has taken several steps to simplify and redesign it. In the recent years, India has witnessed several tax disputes with respect to cross border transactions involving big MNCs. According to a report in 2011-12, 30 corporations which comprise the BSE Sensex had USD 7 billion clogged in tax law suits. Again, while corporate tax rates in most of the nations are in the range of 15 to 25%, in India foreign companies are taxed at a rate of 40%. The corporate tax rate for foreign companies is 25% in China along with tax holidays for qualified tax payers. India’s indirect tax regime is also very complex, imposing several taxes such as central sales tax, VAT, service tax, central excise duty, octroi etc. and calls for a number of compliances increasing the burden on companies. Moreover, there is a lack of uniformity in the tax rates across the country increasing the complexities for tax payers. 3) Restrictive labor laws: India is known worldwide for its stringent and rigid labor laws and over- regulated labor market. Over the years, Indian government has enacted a large number of legislations to protect the interests of labor covering different aspects namely fixation and revision of wages, worker’s health and safety, mode of payment of wages, payment of compensation in the event of industrial accident, provision of social security such as provident fund, gratuity, insurance and so on. Indian economy has turned highly inflexible due to these laws. These laws contain strict rules regarding overtime and imposes financial obligation on the employer upon worker retrenchment. Laws such as taking prior permission from the government before firing any worker in an organization employing more than 100 workers continues to haunt corporations. On several occasions OECD and World Bank studies have highlighted the need to bring reforms in Indian labor laws.
  • 28. International Journal of Scientific and Research Publications, Volume 5, Issue 10, October 2015 28 ISSN 2250-3153 www.ijsrp.org 4) Bureaucracy, regulations and corruption: Yet another handicap that India suffers from is bureaucracy, red tapism and corruption. It takes months to obtain licenses, approvals and permits. As per the doing business report, it takes 67 days for a company to obtain electricity connection, 16 days to obtain clearances and export goods from India, 182 days for dealing with construction permits and 1420 days for enforcing contracts. It takes 4 to 8 weeks for a new company to get itself registered in India as compared to few days in most developed and developing markets. Many a times, the FDI approvals are kept pending for months that prompts the investor to drop out. With respect to FDI policies, even though several liberalization measures have been undertaken by the government but FDI regulations continue to remain restrictive as compared to many other nations. India has been selective in opening sectors for FDI and FDI in India is subject to sectoral caps ranging from 20 to 100%. The FDI Regulatory Restrictiveness Index 2013, prepared and published by OECD has ranked India 6th (indicate restrictive FDI policies) out of 58 countries. Again, corruption in India is rampant where; licenses, clearances, and contracts are given not on merit basis but based on bribes. Uncertain government policies and frequent changes in them, inefficient administrative, overlapping jurisdictions, excessive governance increases the transaction costs for companies making India a less preferred destination.  4.1. There are two types of implications i.e. positive and negative as per following:  Positive Implications: a) FDI provides capital which is usually missing in the target country-Long term capital is suitable for economic development. b) Foreign investors are able to finance their investments projects better and often cheaper. c) Foreign corporations create new workplaces. d) FDI bring new technologies that are usually not available in the target country-There is empirical evidence that there are spill-over effects as the new technologies usually spread beyond the foreign corporations. e) Foreign corporations provide better access to foreign markets-Ex. Foreign corporations can provide useful contacts even for their domestic subcontractors. f) Foreign corporations bring new know-how and managerial skills into the target country- Again, there is a spill-over effect – as people leave the corporations they leave with the knowledge and know-how they accumulated. g) Foreign corporations can help to change the economic structure of the target country- With a good economic strategy governments can attract companies from promising and innovative sectors. h) “Crowding in” effect-The foreign corporations often bring additional investors into the target country (ex. their usual subcontractors). i) Foreign corporations improve the business environment of the target country-Ethical business or rules of conduct. j) Foreign corporations bring new “clean” technologies that help to improve the environmental conditions. k) Foreign corporations usually help increase the level of wages in the target economy. l) Foreign corporations usually have a positive effect on the trade balance.  Negative Implications: a) Foreign corporations may buy a local company in order to shut it down (and gain monopoly for example). b) “Crowding out” effect- We can see this effect if the foreign corporations target the domestic market and domestic corporations are not able to compete with these corporations. c) Foreign corporations may cut working positions (privatization deals or M&A transactions). d) Foreign corporations have a tendency to use their usual suppliers which can lead to increased imports (no problem if the production is export driven). e) Repatriation of the profits can be stressful on the balance of payments. f) The high growth of wages in foreign corporations can influence a similar growth in the domestic corporations which are not able to cover this growth with the growth of productivity- The result is the decreasing competitiveness of domestic companies. g) Missing tax revenues- If the foreign corporations receive tax holidays or similar provisions. h) The emergence of a dual economy- The economy will contain a developed foreign sector and an underdeveloped domestic sector. i) Possible environmental damage. j) “Incentive tourism”.  SUGGESTIONS FOR INCREASED FLOW OF FDI INTO THE COUNTRY:- 1) Flexible labour laws needed: China gets maximum FDI in the manufacturing sector, which has helped the country become the manufacturing hub of the world. In India the manufacturing sector can grow if infrastructure facilities are improved and labour reforms take place. The country should take initiatives to adopt more flexible labour laws. 2) Re look at sectoral caps: Though the Government has hiked the sectoral cap for FDI over the years, it is time to revisit issues pertaining to limits in such sectors as coal mining, insurance, real estate, and retail trade, apart from the small-scale sector. Government should allow more investment into the country under automatic route.
  • 29. International Journal of Scientific and Research Publications, Volume 5, Issue 10, October 2015 29 ISSN 2250-3153 www.ijsrp.org Reforms like bringing more sectors under the automatic route, increasing the FDI cap and simplifying the procedural delays has to be initiated. There is need to improve SEZs in terms of their size, road and port connectivity, assured power supply and decentralized decision-making. 3) Geographical disparities of fdi should be removed: The issues of geographical disparities of FDI in India need to address on priority. Many states are making serious efforts to simplify regulations for setting up and operating the industrial units. However, efforts by many state governments are still not encouraging. Even the state like West Bengal which was once called Manchester of India attracts only 1% of FDI inflow in the country. West Bengal, Bihar, Jharkhand, Chhattisgarh are endowed with rich minerals but due to lack of proper initiatives by governments of these states, they fail to attract FDI. 4) Promote Greenfield projects: India’s volume of FDI has increased largely due to Merger and Acquisitions (M&As) rather than large Greenfields projects. M&A’s not necessarily imply infusion of new capital into a country if it is through reinvested earnings and intra company loans. Business friendly environment must be created on priority to attract large Greenfields projects. Regulations should be simplified so that realization ratio is improved (Percentage of FDI approvals to actual flows). To maximize the benefits of FDI persistently, India should also focus on developing human capital and technology. 5) Develop debt market: India has a well developed equity market but does not have a well developed debt market. Steps should be taken to improve the depth and liquidity of debt market as many companies may prefer leveraged investment rather than investing their own cash. Therefore it is said that countries with well-developed financial markets tend to benefits significantly from FDI inflows. 6) Education sector should be opened to FDI: India has a huge pool of working population. However, due to poor quality primary education and higher education, there is still an acute shortage of talent. FDI in Education Sector is lesser than one percent. By giving the status of primary and higher education in the country, FDI in this sector must be encouraged. However, appropriate measure must be taken to ensure quality education. The issues of commercialization of education, regional gap and structural gap have to be addressed on priority. 7) Strengthen research and development in the country: India should consciously work towards attracting greater FDI into R&D as a means of strengthening the country’s technological prowess and competitiveness.  FINDINGS: 1) FDI is an important stimulus for the economic growth of India. 2) Service sector is first and banking and insurance sector is second segment of which pick the growth in second decade of reforms. 3) FDI create high perks jobs for skilled employee in Indian service sector. 4) Mauritius and Singapore is the 2 top countries which has maximum FDI in India. 5) FDI plays an important role in the development of infrastructure because many countries invest in the infrastructure sector and service and banking finance sectors. 6) Atomic Energy and Railway Transport are some important and life line of any country. Therefore India also restricted FDI in this sector. 7) After above analysis, we can say that FDI has good future growth in Retailing and Real estate sector in India. A. India is attracting foreign investment at a good rapid rate of growth. The growth rate of FDI over last year was found to be 40 %. The main reason for this substantial growth in FDI was opening up of Indian economy to foreign investment, relaxation of norms for foreign investments and enhancing sector wise limit. B. In region wise analysis, Mumbai was on the top with 29% to total FDI of India. The reason behind this was the availability of service sector, infrastructure and construction development. Six regions offices which are at the top contribute 71% to the total FDI while rest of the regions add 29% to total FDI. C. As per the data, the sectors that attracted higher inflows were Services (17%), Construction activities (9%), Telecommunications (7%) and Computer Software and Hardware (7%). D. A country wise FDI inflows show that Mauritius is the country that has invested highly in India followed by Singapore, UK, Japan Netherland and USA and so on. Nine countries contribute 83% to cumulative FDI in India while remaining contributes only 17%. E. FDI plays an important role in the development of infrastructure because many countries invest in the infrastructure sector and banking finance sector. VII. CONCLUSION FDI in India has a significant role in the economic growth and development of India. FDI in India to various sectors can attain sustained economic growth and development through creation of jobs, expansion of existing manufacturing industries. The inflow of FDI in service sectors and construction and development sector, from April, 2000 to June, 2015 attained substantial sustained economic growth and development through creation of jobs in India. Computer, Software & Hardware and Drugs & Pharmaceuticals sector were the other sectors to which attention was shown by Foreign Direct Investors (FDI). The other sectors in Indian economy the Foreign Direct Investors interest was, in fact has been quite poor.
  • 30. International Journal of Scientific and Research Publications, Volume 5, Issue 10, October 2015 30 ISSN 2250-3153 www.ijsrp.org FDI has helped to raise the output, productivity and employment in some sectors especially in service sector. Indian service sector is generating the proper employment options for skilled worker with high perks. On the other side banking and insurance sector help in providing the strength to the Indian economic condition and develop the foreign exchange system in country. So, we can conclude that FDI is always helps to create employment in the country and also support the small scale industries also and helps country to put an impression on the world wide level through liberalization and globalization. REFERENCES [1] Aggrawal, S., Singla, A., Aggrawal, R. (2012). Foreign direct investment in India. International Journal of Computational Engineering & Management, 15 (5), 93-105. [2] Azhar, S., Marimuthu, K.N. (2012). An overview of foreign direct Investment in India. International Journal of Multidisciplinary Management studies, 2 (1), 202-214. [3] Department of Industrial Policy and Promotion, (April 2000 to June 2015) Annual Report. [4] Devajit, M. (2012). Impact of foreign direct investment on Indian economy. Research Journal of management Sciences, 1(2), 29-31. [5] Kumar, P. (2011). FDI in India and its impact- “A critical evaluation”. VRSD International Journal of Business & Management Research, 1(3), 185-196. [6] Manual on Foreign Direct Investment in India by Secretariat for Industrial Assistance (SIA) DIPP. [7] Mahajan, D. (2008). FDI in India not as per her potential. The Economic Challenger, 41 (11), 59-63. [8] Press notes of Department of Industrial Policy and Promotion (DIPP) (2010-15). [9] Ramachandran, A., Kavitha, N., Veni, N.K. (2008). Foreign direct investment and the economic scenario. The Economic Challenger, 39 (10), 43-49. [10] Reserve Bank of India (2015), Monthly Bulletin, July. [11] Sahni, P. (2012). Trends and determinants of foreign direct investment in India: An empirical investigation. International Journal of Marketing and Technology, 2 (8), 144-161. [12] UNCTAD (2015), World Investment Report. AUTHORS First Author - Abhishek Vijaykumar Vyas, B.Com, M.B.A (International Business), Sinhgad Institute of Technology and Science (SITS), Pune, vyasabhishekla@gmail.com