
Recommended
Recommended
More Related Content
Similar to Presentation of Academic Writting .pdf
Similar to Presentation of Academic Writting .pdf (20)
More from AbdulmuqtadetrAhmadi
More from AbdulmuqtadetrAhmadi (6)
Recently uploaded
Recently uploaded (20)
Presentation of Academic Writting .pdf
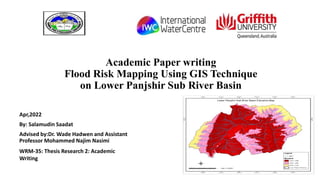
- 1. Academic Paper writing Flood Risk Mapping Using GIS Technique on Lower Panjshir Sub River Basin Apr,2022 By: Salamudin Saadat Advised by:Dr. Wade Hadwen and Assistant Professor Mohammed Najim Nasimi WRM-35: Thesis Research 2: Academic Writing
- 2. Overview • Abstract • Introduction • study Area • Objectives • Research Questions • Methods • Results • Conclusion • Recommendation • Reference
- 3. Abstract • Floods the most common natural hazard in the world, Heavy floods in Afghanistan have shown an increasing trend in recent years especially in Lower Panjshir sub river basin. • understand the flood behavior is by generating the flood extent or flood risk map. cause serious loss in terms of lives, buildings, and infrastructures, Flood risk occurrence is a combination of natural and anthropogenic factors, to find flood risk areas used GIS techniques to evaluate and map flood risk in the study area. Objective and Aim: • The main aim of this paper is to identify, and map areas of flood risk in the Lower Panjshir sub river basin, Results: This work is based on the integration of multi-criteria data including slope, rainfall, road, population density, land use, elevation within the ArcGIS interface. The resulting GIS flood risk map shows the areas under high flood risk of the study area. 1- High Risk Area = 11484.09 ha. 2- Medium Risk Area = 37339 ha 3- low Risk area = 31589 = ha • Conclusion: The Geographic information system (GIS) method used as a multi-criteria analysis allowed the integration of several elements under two criteria, hazards and vulnerability, • Keywords: Flood risk, vulnerability, Multicriteria analysis, Geographic information system (GIS), Lower Panjshir sub river basin.
- 4. Introduction Floods the most common natural hazard in the world, Heavy floods in Afghanistan have shown an increasing trend in recent years especially in Lower Panjshir sub river basin. However, human activities in many circumstances change flood behavior. Activities in the flood plain and catchment such as land clearing for urbanization or agriculture, construction of infrastructures such as highways and roads and bridges in the flood plain may increase the magnitude of flood which increases the damage to the properties and life. The main objective of this Study to find the Flood Risk Area and analysis the flood Consequences and disseminate the result with Relevant Agancies for flood mitigation and preventions.
- 5. Study Area Lower Panjshir Sub river basin has surrounded Kapisa ,some part of parwan and kabul provinces . There is two major river called panjshir and ghurband, Many areas had been flooded within the Lower Panjshir sub river basin in recent times, lower Panjshir sub river basin area the most vulnerable area in due the seasonal flood and flash flood was chosen because of the major flooding that happened in August 2020 that had a devastating effect on the study area. Figure (1) : Show the area of study
- 6. Research Question 1. How we can find the vulnerable and Flood Risk Areas? 2. What factors contribute to floods?
- 7. Problems Flooding one of the most common disaster phenomena is causing considerable personal injury and property damage. 1. Seasonal Flood due the melting Snow and Glacier in the (Lower panjshir basin) 2. Flash Flood due the high Rainfall Figure (2) : Show the damage of the flood in the Lower Panjshir Sub Basin in Aug,2020
- 8. Figure (3) : Show the damage of the flood in the Lower Panjshir Sub Basin in Aug,2020
- 9. Data collection Figure (4): Show the data collection
- 10. Figure (5): Show the methodology flow chart of the flood risk map Methodology
- 11. Results The Lower Panjshir Sub River Basin is a proximate lowland area most of the water is flowing to that area and during the rainy season, floods are destroyed the river bank. Unplanned part of cities inadequate infrastructure . This work is based on the integration of multi-criteria data including slope, rainfall, road, population density, land use, elevation within the ArcGIS interface. The resulting GIS flood risk map shows the areas under high flood risk of the study area. Thus, this resultant map can serve as a guideline to decision-makers for potential anticipatory measures, better land-use planning, and flood risk management under climate change.
- 12. Continue… The flood risk map shows that the Panjshir sub river basin forms an integral part of the high-risk zone in natural disasters. According to the Result indicated in the panjshir Sub River Basin are: 1- High Risk Area = 11484.09 ha. 2- Medium Risk Area = 37339 ha 3- low Risk area = 31589 = ha 4- 50 Village under high Risk 5. 20 Km Road is in the High risk .
- 13. Figure (6): Show result via google earth in Lower Panjshir sub river basin
- 14. Discussion • The flood risk mapping based on GIS and multi-criteria analysis is a valuable tool for estimating areas prone to flood risk. • through the use of hydrological and hydraulic models). Consequently, this simplified but reliable methodology can help reduce resource requirements for fairly accurate flood risk assessments. • Some of the advantages of this approach are its flexibility, ease of handling, and low cost, • aim is the research to obtain large-scale flood risk maps, or when the policymakers require a rapid flood risk assessment. • The use of GIS as the weighting criterion method presents several advantages as well, such as emphasizing the structure of the preferences of the decision-makers among a number of criteria. • GIS is power full tool that can identifying the flood risk area . • GIS is a strong tool and Technique that identifies the flood-prone Area
- 15. Conclusion • Flooding can happen almost anywhere. It is therefore important to use a mix of mitigation and insurance coverage to protect yourself from flood risk that has become more extreme with climate change. Often properties are affected by several kinds of extreme weather throughout the year; learn to protect your home from other types of extreme climate risk. • The flood risk mapping based on GIS analysis is a valuable tool for estimating prone areas to flood risk and helps water resource planners and decision-makers to focus on specific areas in order to perform a further detailed assessment of flood risk. • The Geographic information system (GIS) method used as a multi-criteria analysis allowed the integration of several elements under two criteria, hazards and vulnerability, for flood risk assessment and mapping. • In final, the flood risk maps generated in this paper can be very helpful for the Lower Panjshir sub river basin to implement required mitigation measures for insurance purposes, disaster response, and land management.
- 16. Infrastructure, including dams, levees, bridges and culverts Maintenance of existing infrastructure Individual flood proofing measures Improved traffic access Floodwalls Dams and check dams Diversion channels Dry Dams Ecosystem management Erosion control Land use planning controls Catchment flood modelling Early warning systems Develop a household emergency plan Access to information and warnings Understanding and people awareness Risk mapping Emergency plans Improved flood forecasting Relocation Soft Engineering Creating forestation in the upper catchments Recommendations According to the analysis and flood hazard mapping above, I recommended the below issue’s in this sub river basin.
- 17. Reference • Surface Water Resources Department of National Water Affairs Regulation Authority (NWARA). • Adjei-Darko, P. (2017). Remote Sensing and Geographic Information Systems for Flood Risk Mapping and Near Real-time Flooding Extent Assessment in the Greater Accra Metropolitan Area. March, 1-74. http://www.diva- portal.org/smash/record.jsf?pid=diva2%3A1087549&dswid=-4610 • Amaliyyah, R. (2021). No 主観的健康感を中心とした在宅高齢者における 健康関連指標に関する共分散構造分析Title. February, 6. • Dash, P., & Sar, J. (2020). Identification and validation of potential flood hazard area using GIS-based multi-criteria analysis and satellite data-derived water index. Journal of Flood Risk Management, 13(3), 1-14. https://doi.org/10.1111/jfr3.12620 • Date, A. F. G., Kalantary, A., Management, D., Host, Y., Society, N., Red, A., Society, C., Societies, N., Management, D., Disaster, P., Committees, M., Afghan, T., Crescent, R., Federation, I., Cross, R., Societies, R. C., Emergency, D., Fund, R., City, P., & Village, M. (2020). Information bulletin Afghanistan : Flash Floods The situation Red Cross and Red Crescent action. August. • Gift, G. A., A, E. U. D. O., Ogba, C., & Baywood, C. N. (f.a.). Geospatial Analysis of River Inundation and Flood Risk Levels in Ajeokuta Using Remote Sensing and GIS Geospatial Analysis of River Inundation and Flood Risk Levels in Ajeokuta Using Remote Sensing and GIS ( 10419 ) Gift Ahuchaogu Ginikanwa , Udo Emmanuel. May 2020, 10-14. • Gigović, L., Pamučar, D., Bajić, Z., & Drobnjak, S. (2017). Application of GIS-interval rough AHP methodology for flood hazard mapping in Urban areas. Water (Switzerland), 9(6), 1-26. https://doi.org/10.3390/w9060360 • Ouma, Y. O., & Tateishi, R. (2014). Urban flood vulnerability and risk mapping using integrated multi-parametric AHP and GIS: Methodological overview and case study assessment. Water (Switzerland), 6(6), 1515-1545. https://doi.org/10.3390/w6061515 • Rahmati, O., Zeinivand, H., & Besharat, M. (2015). Flood hazard zoning in Yasooj region , Iran , using GIS and multi-criteria decision analysis. May, 37-41. https://doi.org/10.1080/19475705.2015.1045043
- 18. Thank you for your attention Any questions or comments?