Low impact development_coupled_with_floodplain_mitigation
•
1 like•511 views

Low Impact Development Coupled with Flood Mitigation

Recommended
Recommended
More Related Content
What's hot
What's hot (20)
Similar to Low impact development_coupled_with_floodplain_mitigation
Similar to Low impact development_coupled_with_floodplain_mitigation (20)
More from Florida Public Works Expo - 2016 - Tampa, Florida
More from Florida Public Works Expo - 2016 - Tampa, Florida (20)
Recently uploaded
Recently uploaded (20)
Low impact development_coupled_with_floodplain_mitigation
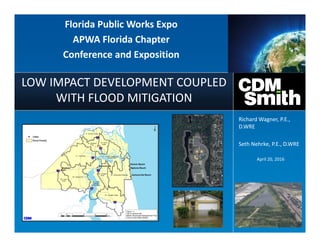
- 1. LOW IMPACT DEVELOPMENT COUPLED WITH FLOOD MITIGATION April 20, 2016 Richard Wagner, P.E., D.WRE Seth Nehrke, P.E., D.WRE Florida Public Works Expo APWA Florida Chapter Conference and Exposition
- 2. Agenda • Low Impact Development Overview • City of Jacksonville LID Manual • Project Examples • Next Steps Raised Inlets
- 3. Low Impact Development / Green infrastructure – "LID is an approach to land development (or re-development) that works with nature to manage stormwater as close to its source as possible. LID employs principles such as preserving and recreating natural landscape features, minimizing effective imperviousness to create functional and appealing site drainage that treat stormwater as a resource rather than a waste product. There are many practices that have been used to adhere to these principles such as bioretention facilities, rain gardens, vegetated rooftops, rain barrels, and permeable pavements. By implementing LID principles and practices, water can be managed in a way that reduces the impact of built areas and promotes the natural movement of water within an ecosystem or watershed."
- 4. Low Impact Development / Green infrastructure • Design Features that: – Increase system storage – Reduce runoff rates – Reduce runoff volumes – Increase nutrient removal • All of which increase retention and ultimately infiltration • Bottom Line, Healthier Environment = Healthier River
- 5. 5 • Minimize clearing (especially along site perimeters) and Less Turf • Stream buffers = 100-yr floodplain (structures out of 100-yr footprint) • Maintain 100-Year floodplain storage – No net loss in concert with floodway protection • Promote infiltration where possible (Water Your Plants) – 0.25 to 0.5 inches in landscape areas/swales, rain gardens, cisterns Green, Low Impact Development Components
- 6. Examples of Low Impact Development (LID) Considerations in Jacksonville • Master Stormwater Management Plan (MSMP) 1992 – Floodplain and floodway protection – Volume-time detention – Stormwater project components • City of Jacksonville LID Manual • Kennedy Community Center • Wurn and Fletcher Morgan Parks study • Valens Drive study
- 7. City of Jacksonville LID Manual Focuses on Right-of-Way LID Applications • Conveyance and landscape swales • Bioretention • Pervious pavement
- 8. Benefits of LID Practices • Water quality – Pollutant loads are reduced in proportion to runoff volume reduction – Reduced size requirement for ponds with LID in tributary area – Improved water quality and lower temperature discharges • Water quantity – Increased groundwater infiltration, recharge, and baseflow – May result in reduced pipe sizes and storage volume requirement for pond with LID in tributary area – Reduced discharge volumes – Reductions in potable water supply use by landscape irrigation
- 9. Evaluation of Runoff Control Practices • Goal: reasonable water budget and seasonal water table representation • Long-term H&H and water quality simulations using SWMM5 – Pre-development (runoff, groundwater) for undeveloped (pervious) land – Post-development: impervious land (e.g., roadway, parking lot) routed to LID feature – Determine average annual % runoff capture
- 10. SWMM5 – Undeveloped Area • Long-term simulations using SWMM5 – Surface runoff hydrologic parameters based on MSMP modeling – Added groundwater parameter values for calculation of baseflow – Target: Rainfall converted to roughly 30% streamflow, 70% ET
- 11. SWMM5 – Undeveloped Area: Simulated Seasonal Water Table 10.4 10.6 10.8 11.0 11.2 11.4 11.6 11.8 12.0 12.2 12.4 MonthlyAverage WaterTableElevation(ft)
- 12. SWMM5 – Developed Area • Long-term simulation with impervious area runoff routed to LID feature – Various ratios of impervious tributary area to LID surface area – Typical design characteristics for LID feature (e.g., bioretention ponding depth and planting media depth) • Goal: determine runoff capture efficiency based on LID storage/treatment volume
- 13. SWMM5 – Model Shows Higher Local Water Table After Development with LID 10.0 10.5 11.0 11.5 12.0 12.5 13.0 13.5 MonthlyAverageWaterTableElevation(ft) Post with LID Pre
- 14. Results Based on Storage Volume and Depth to Seasonal High Water Table 20 30 40 50 60 70 80 90 100 0.25 0.5 0.75 1 1.25 1.5 1.75 2 2.25 2.5 2.75 3 3.25 3.5 3.75 4 4.25 Long-TermPercentRunoffCapture Storage over Effective Impervious Area (inches) 24-inch 18-inch 12-inch BMPTRAINS NDCIA CN = 98 Depth to Seasonal High Water Table:
- 15. • Minimize clearing • Minimize directly connected impervious area (DCIA) and send flow to pervious and landscape areas – Courtyard driveways – Center-crowned driveways – Rooftops and roof gutters – Pervious Pavement • Sheet flow spreaders from paved areas • Cisterns, swales, and ponds for runoff harvesting Potential Site Level LID Components
- 16. 16 LID Examples - Landscape Designs Minimize Clearing With Shrub Berms and Buffers – Minimizing DCIA
- 17. 17 Rear and Side Lot Swales
- 18. 18 Courtyard Driveways Provide a Source of Water for Landscape
- 19. 19 Rear Yard Buffers Provide Stream Protection, Storage, Wildlife Habitat, and Privacy
- 20. Other Potential LID Practices • Reduced roadway widths • Filter strips • Curb extensions • Landscaping planter boxes Graphics?
- 21. Example Studies in Jacksonville • Wurn and Fletcher Morgan Parks – Opportunity for stormwater irrigation from existing ponds – In tributary area to impaired waters (Pottsburg Creek, Lower St. Johns River) • Valens Drive – Known area of nuisance flooding – In tributary area to impaired waters (Pottsburg Creek, Lower St. Johns River) • Evaluation Aspects – Benefits (e.g., increased infiltration and recharge, volume and load reduction, peak stages reduced, potable water use reduction) – Costs
- 22. Recreational LID Demonstration Projects Fletcher Morgan Park Wurn Park
- 23. LID Retrofit Opportunities: Public Facilities Fletcher Morgan Recreational LID Horizontal Irrigation Well
- 24. LID Retrofit Opportunities: Public Facilities Wurn Park Recreational LID Irrigation Supplement Permeable Pavement
- 25. Stormwater Irrigation Evaluation • Define irrigation and tributary areas • Determine irrigation demand • Quantify savings
- 26. Stormwater Irrigation Evaluation Define Irrigation & Tributary Areas Analyze Supply and Demand 20% 38%
- 27. Stormwater Irrigation ROI Item Units Unit Cost Quantity Total Cost Captial Costs 1. Horizontal Well 1a. Mobilization and Site Prep. (5% of construction cost, 1b - 4) EA 4,347$ 2 8,693$ 1b. Dewatering EA 9,000$ 2 18,000$ 1c. Excavation CY 7$ 1,040 7,280$ 1d. 6" Perforated PVC Pipe LF 10$ 300 3,000$ 1e. Gravel TN 80$ 80 6,400$ 1f. Geotextile SY 3$ 272 816$ 1f. Sod SY 4$ 800 3,200$ 2. Pond Reshaping 1 CY 7$ 3,748 26,236$ 3. Covered Pump Station EA 8,000$ 2 16,000$ 4. Irrigation Automated Control System EA 3,000$ 2 6,000$ Subtotal 1 - Capital Costs 95,625$ Contingency (30%) 28,688$ Subtotal 2 - (Capital Costs + 30% Contingency) 124,313$ Feasibility Study 9,630$ Data Development 29,394$ Design and Permitting 64,504$ Construction Services 10,699$ Subtotal 3 - Development Cost (Subtotal 2 + Design Services) 238,540$ Annual Operations & Maintenance Cost 5. Horizontal Well LS 1,500$ 2 3,000$ 6. Pump Station LS 2,500$ 2 5,000$ Annual Potable Water Savings 7. Annual Water Savings (deducted) 2 kgal (4.33)$ 1,936 (8,385)$ Annual Water Qualilty Value Savings 8. Annual Total Nitrogen Worth (deducted) 3 MT (1,000,000)$ 0.026 (26,000)$ Subtotal 4 - Total Annual Savings (5, 6, 7 & 8 in 2013 dollars) (26,385)$ 9.0 1. Assume 4 feet of excavation required for each pond (i.e., wet excavation). 2. JEA rates are $3.86/kgal for commercial irrigation + $0.37/kgal environmental fee = $4.33/kgal; quantity based on weekly irrigation schedules provided by COJ Parks and Recreation Department for an assumed 5 month irrigation season, and calculated irrigation demand met though harvesting of 35% for Fletcher Park and 57% for Wurn Park. 3. Based on conceptual worth of total nitrogen (TN) for water quality trading planning ($1M/metric ton TN) Design Services Years to Recover Investment (subtotal 3 / subtotal 4, in 2013 dollars) 9 years
- 28. Recreational LID Demonstration Projects Valens Drive LID
- 29. Project Area Project Topography
- 30. LID Retrofit Opportunities: Flood Control
- 31. Valens Drive LID Layout
- 33. House Side Street Side Types of LID Features – Infiltration Planter: Plan View
- 34. House Side Street Side Types of LID Features – Infiltration Planter
- 35. Types of LID Features – Infiltration Planter
- 36. LID Infiltration Planter Types • Sand Cordgrass
- 37. Types of LID Features – Street Trees Black Tupelo (Black Gum) 30 gallon or larger
- 38. LID Street Tree Types – Black Gum Tupelo • Medium Tree • Vibrant Colors • 25’-35’ Mature Spread
- 39. Educational Components Stormwater BMP educational signage installed throughout the park
- 40. Educational Components (cont.) Baffle box with viewing cover allows visitors to see the mechanics behind an otherwise invisible technology
- 41. Educational Components (cont.) • Host field trips and events • NPDES MS4 permit education credits Pervious Concrete Flexi-Pave®
- 42. City of Jacksonville – Valens LID Next Steps • Complete Construction • Move forward with implementation of a water quality monitoring plan • Perform annual O&M • Expand the LID coverage
- 43. Special Thanks to Bill Joyce, P.E., John Pappas, P.E., Dave Hahn, P.E., Tom Fallin, P.E., Councilman Wilson’s office, Jones Edmunds & Associates Bill Joyce, P.E., John Pappas, P.E., Dave Hahn, P.E., Tom Fallin, P.E., Councilman Wilson’s office, Jones Edmunds & Associates
- 44. LOW IMPACT DEVELOPMENT COUPLED WITH FLOOD MITIGATION April 20, 2016 Richard Wagner, P.E., D.WRE Seth Nehrke, P.E., D.WRE Florida Public Works Expo APWA Florida Chapter Conference and Exposition