Two speed market continues for bc home sales bcrea
•
0 likes•280 views

A press release from the British Columbia Real Estate Asscocation shows surging demand in Metro Vancouver and more moderate demand in the rest of BC.

Recommended
Recommended
More Related Content
What's hot
What's hot (14)
Viewers also liked
Viewers also liked (20)
Similar to Two speed market continues for bc home sales bcrea
Similar to Two speed market continues for bc home sales bcrea (20)
More from Matt Collinge
More from Matt Collinge (19)
Recently uploaded
Recently uploaded (20)
Two speed market continues for bc home sales bcrea
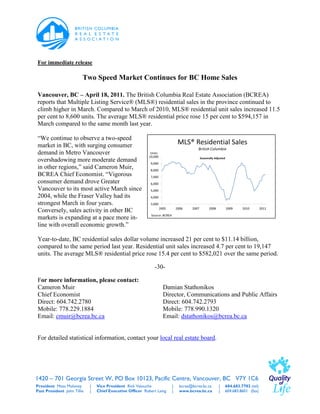
- 1. For immediate release Two Speed Market Continues for BC Home Sales Vancouver, BC – April 18, 2011. The British Columbia Real Estate Association (BCREA) reports that Multiple Listing Service® (MLS®) residential sales in the province continued to climb higher in March. Compared to March of 2010, MLS® residential unit sales increased 11.5 per cent to 8,600 units. The average MLS® residential price rose 15 per cent to $594,157 in March compared to the same month last year. “We continue to observe a two-speed market in BC, with surging consumer demand in Metro Vancouver overshadowing more moderate demand in other regions,” said Cameron Muir, BCREA Chief Economist. “Vigorous consumer demand drove Greater Vancouver to its most active March since 2004, while the Fraser Valley had its strongest March in four years. Conversely, sales activity in other BC markets is expanding at a pace more in- line with overall economic growth.” Year-to-date, BC residential sales dollar volume increased 21 per cent to $11.14 billion, compared to the same period last year. Residential unit sales increased 4.7 per cent to 19,147 units. The average MLS® residential price rose 15.4 per cent to $582,021 over the same period. -30- For more information, please contact: Cameron Muir Damian Stathonikos Chief Economist Director, Communications and Public Affairs Direct: 604.742.2780 Direct: 604.742.2793 Mobile: 778.229.1884 Mobile: 778.990.1320 Email: cmuir@bcrea.bc.ca Email: dstathonikos@bcrea.bc.ca For detailed statistical information, contact your local real estate board. 1420 – 701 Georgia Street W, PO Box 10123, Pacific Centre, Vancouver, BC V7Y 1C6 President Moss Moloney | Vice President Rick Valouche | bcrea@bcrea.bc.ca | 604.683.7702 (tel) Past President John Tillie | Chief Executive Officer Robert Laing | www.bcrea.bc.ca | 604.683.8601 (fax)
- 2. Two Speed Market Continues for BC Home Sales . . . Page 2 March 2011 Residential Average Price, Active Listings and Sales-to-Active-Listings Data by Board Average Price Active Listings Sales-to-Active-Listings March 2011 March 2010 March 2011 March 2010 March 2011 March 2010 Residential Residential Residential Residential Board Residential Residential % change % Active Active Sales to Active Sales to Active Average Price Average Price change Listings Listings Listings Listings ($) ($) (Units) (Units) (%) (%) BC Northern 219,090 213,250 2.7 2,436 2,618 -7.0 13.8 12.0 Chilliwack 281,874 319,886 -11.9 1,604 1,551 3.4 11.7 13.2 Fraser Valley 526,828 455,947 15.5 7,679 8,016 -4.2 22.5 18.2 Greater Vancouver 786,311 693,482 13.4 14,100 14,679 -3.9 29.3 21.7 Kamloops 312,318 287,977 8.5 1,880 1,855 1.3 10.1 11.8 Kootenay 254,534 273,561 -7.0 2,609 2,657 -1.8 5.2 7.3 Okanagan Mainline 376,574 385,396 -2.3 5,922 6,100 -2.9 7.9 8.0 Powell River 226,185 243,744 -7.2 213 221 -3.6 12.2 7.2 South Okanagan 303,859 315,231 -3.6 1,858 1,754 5.9 5.3 8.0 Northern Lights 187,775 175,372 7.1 253 242 4.5 20.9 18.6 Vancouver Island 320,505 328,520 -2.4 5,688 5,349 6.3 11.1 13.2 Victoria 494,207 521,917 -5.3 3,284 2,890 13.6 18.6 25.6 Provincial Totals* 594,157 516,970 14.9 47,488 47,932 -0.9 18.1 16.1 *Numbers may not add due to rounding March 2011 BC Residential Multiple Listing Service® Data by Board Dollar Volume (000s) Units March 2011 March 2010 March 2011 March 2010 Board Residential Sales Residential Sales % change Residential Sales Residential Sales % change ($) ($) (Units) (Units) BC Northern 73,395 66,961 9.6 335 314 6.7 Chilliwack 52,992 65,577 -19.2 188 205 -8.3 Fraser Valley 911,413 664,771 37.1 1,730 1,458 18.7 Greater Vancouver 3,252,968 2,212,209 47.0 4,137 3,190 29.7 Kamloops 59,028 63,067 -6.4 189 219 -13.7 Kootenay 34,362 52,797 -34.9 135 193 -30.0 Okanagan Mainline 176,613 186,917 -5.5 469 485 -3.3 Powell River 5,881 3,900 50.8 26 16 62.5 South Okanagan 30,082 44,448 -32.3 99 141 -29.8 Northern Lights 9,952 7,892 26.1 53 45 17.8 Vancouver Island 201,598 231,607 -13.0 629 705 -10.8 Victoria 301,466 385,697 -21.8 610 739 -17.5 Provincial Totals* 5,109,750 3,985,840 28.2 8,600 7,710 11.5 * Numbers may not add due to rounding **NOTE: The Northern Lights Real Estate Board (NLREB) became part of the South Okanagan Real Estate Board (SOREB) on January 1, 2011. Data for SOREB in these tables includes transaction data from the former NLREB. 1420 – 701 Georgia Street W, PO Box 10123, Pacific Centre, Vancouver, BC V7Y 1C6 President Moss Moloney | Vice President Rick Valouche | bcrea@bcrea.bc.ca | 604.683.7702 (tel) Past President John Tillie | Chief Executive Officer Robert Laing | www.bcrea.bc.ca | 604.683.8601 (fax)
- 3. Two Speed Market Continues for BC Home Sales . . . Page 3 March 2011 Year-to-Date BC Residential Multiple Listing Service® Data by Board Dollar Volume (000s) Unit Sales Average Price Board % % % 2011 2010 2011 2010 change 2011 2010 change change ($) ($) ($) ($) BC Northern 157,311 157,388 0.0 739 730 1.2 212,870 215,600 -1.3 Chilliwack 132,428 157,452 -15.9 473 507 -6.7 279,974 310,557 -9.8 Fraser Valley 1,833,420 1,545,574 18.6 3,704 3482 6.4 494,984 443,875 11.5 7,153,158 5,130,098 39.4 9,132 7667 19.1 783,307 669,114 17.1 Greater Vancouver Kamloops 136,307 145,360 -6.2 442 496 -10.9 308,387 293,064 5.2 Kootenay 89,450 124,732 -28.3 353 466 -24.2 253,400 267,665 -5.3 Okanagan 398,452 441,425 -9.7 1,082 1155 -6.3 368,255 382,186 -3.6 Mainline Powell River 14,018 14,877 -5.8 66 56 17.9 212,397 265,655 -20.0 South Okanagan 73,819 105,919 -30.3 248 334 -25.7 297,658 317,122 -6.1 Northern Lights 20,356 16,313 24.8 101 80 26.2 201,545 203,907 -1.2 Vancouver Island 448,342 519,739 -13.7 1,409 1605 -12.2 318,199 323,825 -1.7 Victoria 686,887 861,973 -20.3 1,398 1,706 -18.1 491,336 505,260 -2.8 Provincial 11,143,948 9,220,848 20.9 19,147 18,284 4.7 582,021 504,312 15.4 Totals* * Numbers may not add due to rounding BCREA represents 11 member real estate boards and their approximately 18,000 REALTORS® on all provincial issues, providing an extensive communications network, standard forms, economic research and analysis, government relations, applied practice courses and continuing professional education (cpe). To demonstrate the profession’s commitment to improving Quality of Life in BC communities, BCREA supports policies that encourage economic vitality, provide housing opportunities, respect the environment and build communities with good schools and safe neighbourhoods. For detailed statistical information, contact your local real estate board. MLS® is a cooperative marketing system used only by Canada’s real estate boards to ensure maximum exposure of properties listed for sale. 1420 – 701 Georgia Street W, PO Box 10123, Pacific Centre, Vancouver, BC V7Y 1C6 President Moss Moloney | Vice President Rick Valouche | bcrea@bcrea.bc.ca | 604.683.7702 (tel) Past President John Tillie | Chief Executive Officer Robert Laing | www.bcrea.bc.ca | 604.683.8601 (fax)