Home sales slow after strong first quarter bcrea - may 2011
•
0 likes•206 views

The May 2011 market update from the the British Columbia Real Estate Association.

Recommended
More Related Content
Viewers also liked
Viewers also liked (14)
More from Matt Collinge
More from Matt Collinge (20)
Recently uploaded
Recently uploaded (20)
Home sales slow after strong first quarter bcrea - may 2011
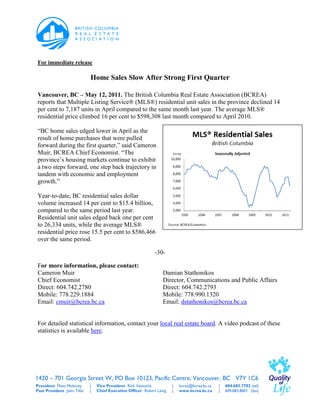
- 1. For immediate release Home Sales Slow After Strong First Quarter Vancouver, BC – May 12, 2011. The British Columbia Real Estate Association (BCREA) reports that Multiple Listing Service® (MLS®) residential unit sales in the province declined 14 per cent to 7,187 units in April compared to the same month last year. The average MLS® residential price climbed 16 per cent to $598,308 last month compared to April 2010. “BC home sales edged lower in April as the result of home purchases that were pulled forward during the first quarter,” said Cameron Muir, BCREA Chief Economist. “The province’s housing markets continue to exhibit a two steps forward, one step back trajectory in tandem with economic and employment growth.” Year-to-date, BC residential sales dollar volume increased 14 per cent to $15.4 billion, compared to the same period last year. Residential unit sales edged back one per cent to 26,334 units, while the average MLS® residential price rose 15.5 per cent to $586,466 over the same period. -30- For more information, please contact: Cameron Muir Damian Stathonikos Chief Economist Director, Communications and Public Affairs Direct: 604.742.2780 Direct: 604.742.2793 Mobile: 778.229.1884 Mobile: 778.990.1320 Email: cmuir@bcrea.bc.ca Email: dstathonikos@bcrea.bc.ca For detailed statistical information, contact your local real estate board. A video podcast of these statistics is available here. 1420 – 701 Georgia Street W, PO Box 10123, Pacific Centre, Vancouver, BC V7Y 1C6 President Moss Moloney | Vice President Rick Valouche | bcrea@bcrea.bc.ca | 604.683.7702 (tel) Past President John Tillie | Chief Executive Officer Robert Laing | www.bcrea.bc.ca | 604.683.8601 (fax)
- 2. Home Sales Slow After Strong First Quarter . . . Page 2 April 2011 Residential Average Price, Active Listings and Sales-to-Active-Listings Data by Board Average Price Active Listings Sales-to-Active-Listings April 2011 April 2010 April 2011 April 2010 April 2011 April 2010 Residential Residential Residential Residential Board Residential Residential % change % Active Active Sales to Active Sales to Active Average Price Average Price change Listings Listings Listings Listings ($) ($) (Units) (Units) (%) (%) BC Northern 215,122 220,039 -2.2 2,696 3,002 -10.2 11.8 11.3 Chilliwack 297,870 317,700 -6.2 1,757 1,694 3.7 10.6 13.8 Fraser Valley 534,123 454,557 17.5 8,064 8,838 -8.8 17.5 19 Greater Vancouver 815,252 673,579 21 15,239 17,039 -10.6 21.5 21 Kamloops 312,970 316,520 -1.1 2,083 2,096 -0.6 7.5 9.5 Kootenay 270,615 289,001 -6.4 2,864 3,001 -4.6 5.4 6.3 Okanagan Mainline 372,499 394,516 -5.6 6,318 6,676 -5.4 6.3 8.4 Powell River 176,904 243,631 -27.4 235 254 -7.5 11.1 10.2 South Okanagan 299,281 323,924 -7.6 1,981 1,963 0.9 5.8 7.3 Northern Lights 210,717 186,988 12.7 277 281 -1.4 9.4 15.7 Vancouver Island 338,581 334,024 1.4 6,206 6,026 3 9.4 11.5 Victoria 508,005 518,536 -2 3,709 3,400 9.1 14.6 20.8 Provincial Totals* 598,308 514,791 16.2 51,268 54,270 -5.5 14 15.5 *Numbers may not add due to rounding April 2011 BC Residential Multiple Listing Service® Data by Board Dollar Volume (000s) Units April 2011 April 2010 April 2011 April 2010 Board Residential Sales Residential Sales % change Residential Sales Residential Sales % change ($) ($) (Units) (Units) BC Northern 68,409 74,373 -8 318 338 -5.9 Chilliwack 55,702 74,024 -24.8 187 233 -19.7 Fraser Valley 755,251 762,293 -0.9 1,414 1,677 -15.7 Greater Vancouver 2,665,872 2,407,370 10.7 3,270 3,574 -8.5 Kamloops 49,136 62,988 -22 157 199 -21.1 Kootenay 41,945 54,332 -22.8 155 188 -17.6 Okanagan Mainline 147,137 221,324 -33.5 395 561 -29.6 Powell River 4,600 6,334 -27.4 26 26 0 South Okanagan 34,118 46,321 -26.3 114 143 -20.3 Northern Lights 5,479 8,228 -33.4 26 44 -40.9 Vancouver Island 198,070 231,812 -14.6 585 694 -15.7 Victoria 274,323 367,123 -25.3 540 708 -23.7 Provincial Totals* 4,300,041 4,316,522 -0.4 7,187 8,385 -14.3 * Numbers may not add due to rounding **NOTE: The Northern Lights Real Estate Board (NLREB) became part of the South Okanagan Real Estate Board (SOREB) on January 1, 2011 1420 – 701 Georgia Street W, PO Box 10123, Pacific Centre, Vancouver, BC V7Y 1C6 President Moss Moloney | Vice President Rick Valouche | bcrea@bcrea.bc.ca | 604.683.7702 (tel) Past President John Tillie | Chief Executive Officer Robert Laing | www.bcrea.bc.ca | 604.683.8601 (fax)
- 3. Home Sales Slow After Strong First Quarter . . . Page 3 April 2011 Year-to-Date BC Residential Multiple Listing Service® Data by Board Dollar Volume (000s) Unit Sales Average Price Board % % % 2011 2010 2011 2010 change 2011 2010 change change ($) ($) ($) ($) BC Northern 225,720 231,761 -2.6 1,057 1,068 -1 213,547 217,005 -1.6 Chilliwack 188,129 231,476 -18.7 660 740 -10.8 285,044 312,806 -8.9 Fraser Valley 2,588,671 2,307,866 12.2 5,118 5,159 -0.8 505,797 447,348 13.1 Greater Vancouver 9,819,031 7,537,468 30.3 12,402 11,241 10.3 791,730 670,534 18.1 Kamloops 185,443 208,347 -11 599 695 -13.8 309,588 299,780 3.3 Kootenay 131,395 179,064 -26.6 508 654 -22.3 258,653 273,798 -5.5 Okanagan Mainline 545,589 662,748 -17.7 1,477 1,716 -13.9 369,390 386,217 -4.4 Powell River 18,618 21,211 -12.2 92 82 12.2 202,366 258,672 -21.8 South Okanagan 107,937 152,240 -29.1 362 477 -24.1 298,169 319,161 -6.6 Northern Lights 25,835 24,540 5.3 127 124 2.4 203,423 197,904 2.8 Vancouver Island 646,412 751,551 -14 1,994 2,299 -13.3 324,178 326,903 -0.8 Victoria 961,210 1,229,097 -21.8 1,938 2,414 -19.7 495,981 509,154 -2.6 Provincial Totals* 15,443,989 13,537,370 14.1 26,334 26,669 -1.3 586,466 507,607 15.5 * Numbers may not add due to rounding BCREA represents 11 member real estate boards and their approximately 18,000 REALTORS® on all provincial issues, providing an extensive communications network, standard forms, economic research and analysis, government relations, applied practice courses and continuing professional education (cpe). To demonstrate the profession’s commitment to improving Quality of Life in BC communities, BCREA supports policies that encourage economic vitality, provide housing opportunities, respect the environment and build communities with good schools and safe neighbourhoods. For detailed statistical information, contact your local real estate board. MLS® is a cooperative marketing system used only by Canada’s real estate boards to ensure maximum exposure of properties listed for sale. 1420 – 701 Georgia Street W, PO Box 10123, Pacific Centre, Vancouver, BC V7Y 1C6 President Moss Moloney | Vice President Rick Valouche | bcrea@bcrea.bc.ca | 604.683.7702 (tel) Past President John Tillie | Chief Executive Officer Robert Laing | www.bcrea.bc.ca | 604.683.8601 (fax)