SlideShare ist ein Scribd-Unternehmen logo
1 von 45
TIME SERIES ANALYSIS PRESENTED BY:- JEET SINGH                  SATYENDRA SINGHAL
Introduction: 	We know that planning about future is very necessary for the every business firm, every govt. institute, every individual and for every country.Every family is also doing planning for his income expenditure.As like every business is doing planning for possibilities of its financial resources & sales and for maximization its profit. Definition:      “A time series is a set of observation taken at specified times, usually at equal intervals”. “A time series may be defined as a collection of reading belonging to different time periods of some economic or composite variables”.							By –Ya-Lun-Chau ,[object Object]
One variable is  “Time” which is independent variable & and the second is “Data” which is the dependent variable.,[object Object]
Importance of Time Series Analysis:- As the basis of Time series Analysis businessman can predict about the changes in economy. There are following points which clear about the its importance: 1.  Profit of  experience.		    2. Safety from future 3. Utility Studies 4. Sales Forecasting			   5. Budgetary Analysis 6. Stock Market Analysis		   7. Yield Projections 8. Process and Quality Control	  9.  Inventory Studies 10. Economic Forecasting 11. Risk Analysis & Evaluation of changes.  12. Census Analysis
Components of Time Series:- The change which are being in time series, They are effected by Economic, Social, Natural, Industrial & Political Reasons. These reasons are called components of Time Series. ,[object Object]
  Seasonal variation :-
  Cyclical variation :-
  Irregular variation :-,[object Object]
change in technological progress ,
large scale shift in consumers demands, For example,  population increases over a period of time,price increases over a period of years,production of goods on the capital market of the country increases over a period of years.These are the examples of upward trend. The sales of a commodity may decrease over a period of time because of better products coming to the market.This is an example of declining trend or downward.
Seasonal variation:  Seasonal variation are short-term fluctuation in a time series which occur periodically in a year. This continues to repeat  year after year. The major factors that are weather conditions and customs of people. More woolen clothes are sold in winter than in the season of summer .  each year more ice creams are sold in summer and very little in Winter season.  The sales in the departmental stores are more during festive seasons that in the normal days.
[object Object],Cyclical variations are recurrent upward or downward movements in a time series but the period of cycle is greater than a  year. Also these variations are not regular as seasonal variation.  A business cycle showing these oscillatory movements has to pass through four phases-prosperity, recession, depression and recovery. In a business, these four phases are completed by passing one to another  in this order.  
Irregular variation: Irregular variations are fluctuations in time series that are short in duration, erratic in nature and follow no regularity in the occurrence pattern. These variations are also referred to as residual variations since by definition they represent what is left out in a time series after trend ,cyclical and seasonal variations. Irregular fluctuations results due to the occurrence of unforeseen events like : Floods, Earthquakes, Wars, Famines 
[object Object],Addition Model: 				Y = T + S + C + I 				Where:-  Y = Original Data 	         				T = Trend Value 	       				S = Seasonal Fluctuation 	  	    	C = Cyclical  Fluctuation I =  	                              I = Irregular Fluctuation ,[object Object],Y = T x S x C x I 				    or 			Y = TSCI
[object Object],The following methods are used for calculation of trend: ,[object Object]
  Semi – Average Method:
  Moving Average Method:
  Least Square Method:,[object Object]
Actual Data
Semi – Average Method:-  In this method the given  data are divided in two parts, preferable  with the equal  number of  years. For example,  if we are  given data from 1991 to 2008, i.e., over a period of 18 years, the two equal  parts will be first  nine years, i.e.,1991 to 1999 and  from 2000 to 2008. In case of  odd number of  years like, 9, 13, 17, etc.., two equal parts can be made simply by ignoring  the middle year. For example, if data are given  for  19 years from 1990 to 2007 the  two equal  parts  would  be from 1990 to 1998 and from 2000 to 2008 - the middle year 1999 will  be ignored.
Example: 			Find the trend line from the following data by Semi – Average Method:- ,[object Object],Now we calculated Average mean for every part. First Part  =          150 + 152 + 153 + 151     =   151.50 		             		4 Second Part =     154 + 153 + 156 + 158   =   155.25 		           		  4
155.25 151.50
[object Object],It is one of the most popular method for calculating Long Term Trend. This method is also used for ‘Seasonal fluctuation’, ‘cyclical fluctuation’ & ‘irregular fluctuation’. In this method we calculate the ‘Moving Average for  certain years.  For example: If we calculating ‘Three year’s Moving Average’ then according to this method:  		 =(1)+(2)+(3) ,     (2)+(3)+(4) ,     (3)+(4)+(5),   …………….. 			    3		        3		             3 Where (1),(2),(3),………. are the various years of time series.  ,[object Object],[object Object]
[object Object],This method is most widely in practice. When this method is applied, a trend line is fitted to data in such a manner that the following  two conditions are satisfied:- ,[object Object]
i.e., the sum of the squares of the deviation of the actual  and computed values is least from this line. That is why method is called the method of least squares. The line obtained by this method is known as the line of `best fit`.							is least
The Method of least square can be used either to fit a straight line trend or a parabolic trend. The straight line trend is represented by the equation:- = Yc = a + bx Where,	Y = Trend value to be computed 					 X = Unit of  time (Independent Variable) 					 a = Constant to be Calculated 					 b = Constant to be calculated ,[object Object],	Draw a straight line trend and estimate trend value for 1996:
Solution:- ’ Now we calculate the value of two constant  ‘a’ and ‘b’ with the help of two equation:-
Now we put the value of                                                         :- 50 =  5a + 15(b)     …………….		(i) 166 = 15a + 55(b) ………………	              (ii) Or    5a + 15b = 50	………………		   (iii) 15a + 55b = 166 ………………….	                 (iv) Equation (iii) Multiply by 3 and subtracted by (iv) -10b = -16 b = 1.6 Now we put the value of “b” in the equation  (iii)
 =   5a + 15(1.6) = 50 			5a = 26 				a =     = 5.2 As according the value of ‘a’ and ‘b’ the trend line:- 					 Yc = a + bx 						Y= 5.2 + 1.6X Now we calculate the trend line for 1996:- 				Y1996 = 5.2 + 1.6 (6) = 14.8
[object Object],In above Example the trend equation is:  Y  = 5.2 + 1.6x Here the base year is 1993 that means actual base of these year will 1st July 1993. Now we change the base year in 1991. Now the base year is back 2 years unit than previous base year.  Now we will reduce the twice of the value of the ‘b’ from the value of ‘a’.  Then the new value of ‘a’ = 5.2 – 2(1.6) Now the trend equation on the basis of year 1991: Y = 2.0+ 1.6x
Parabolic Curve:- Many times the line which draw by “Least Square Method” is not prove ‘Line of best fit’ because it is not present actual long term trendSo we distributed Time Series in sub- part and make following equation:- Yc = a + bx + cx2 ,[object Object],Its are calculated by following three equation:-
If we take the deviation from ‘Mean year’ then the all three equation are presented like this: Parabola of second degree:-
[object Object]
Draw a parabola of second degree from the following data:-,[object Object]
Equation (ii) is multiply by 2 and subtracted from (iii): 		10a + 34c = 76				……………..	(iv) 		10a + 20c = 70				……………..	(v) 		14c = 6  or c =          = 0.43 Now we put the value of c in equation (i) 			5a + 10 (0.43) = 35 5a = 35-4.3	= 5a = 30.7 			a = 6.14 Now after putting the value of ‘a’, ‘b’ and ‘c’,  Parabola of second degree is made that is: Y = 6.34 + 1.2x + 0.43x2
Parabola of Third degree:- There are four constant ‘a’, ‘b’, ‘c’ and ‘d’ which are calculated by following equation. The main equation is Yc = a + bx + cx2  + dx3. There are also four normal equation.
[object Object],Seasonal Average Method Link Relative Method Ratio To Trend Method Ratio To Moving Average Method
Seasonal Average Method Seasonal Averages =    Total of Seasonal Values 					  	      No. Of Years  General Averages =     Total of Seasonal Averages 						   No. Of Seasons Seasonal Index       = 	Seasonal Average 						   General Average
EXAMPLE:- From the following data calculate quarterly seasonal indices assuming the absence of any type of trend:
Solution:-      Calculation of quarterly seasonal indices
General Average =  497.75 =  124.44 				   4 Quarterly Seasonal variation index = 125.75 x 100 					   		   124.44 So as on we calculate the other seasonal indices
Link Relative Method: In this Method the following steps are taken for calculating the seasonal variation indices We calculate the link relatives of seasonal figures. 	Link Relative:   Current Season’s Figure x 100 				   Previous Season’s Figure We calculate the average of link relative foe each season. Convert These Averages in to chain relatives on the basis of the first seasons.
Calculate the chain relatives of the first season on the base of the last seasons. There will be some difference between the chain relatives of the first seasons and the chain relatives calculated by the pervious Method. This difference will be due to effect of long term changes. For correction the chain relatives of the first season calculated by 1st method is deducted from the chain relative calculated by the second method. Then Express the corrected chain relatives as percentage of their averages.
Ratio To Moving Average Method: In this method seasonal variation indices are calculated in following steps:  We calculate the 12 monthly or 4 quarterly moving average. We use following formula for calculating the moving average Ratio: Moving Average Ratio= Original Data    x 100 					  	     Moving Average Then we calculate the seasonal variation indices on the basis of average of seasonal variation.

Weitere ähnliche Inhalte

Was ist angesagt?

Hypothesis testing; z test, t-test. f-test
Hypothesis testing; z test, t-test. f-testHypothesis testing; z test, t-test. f-test
Hypothesis testing; z test, t-test. f-testShakehand with Life
 
Lesson 2 stationary_time_series
Lesson 2 stationary_time_seriesLesson 2 stationary_time_series
Lesson 2 stationary_time_seriesankit_ppt
 
Nature, Scope, Functions and Limitations of Statistics
Nature, Scope, Functions and Limitations of StatisticsNature, Scope, Functions and Limitations of Statistics
Nature, Scope, Functions and Limitations of StatisticsAsha Dhilip
 
Types of data by kamran khan
Types of data by kamran khanTypes of data by kamran khan
Types of data by kamran khankamran khan
 
Time Series, Moving Average
Time Series, Moving AverageTime Series, Moving Average
Time Series, Moving AverageSOMASUNDARAM T
 
Regression analysis ppt
Regression analysis pptRegression analysis ppt
Regression analysis pptElkana Rorio
 
Application of Univariate, Bi-variate and Multivariate analysis Pooja k shetty
Application of Univariate, Bi-variate and Multivariate analysis Pooja k shettyApplication of Univariate, Bi-variate and Multivariate analysis Pooja k shetty
Application of Univariate, Bi-variate and Multivariate analysis Pooja k shettySundar B N
 
Sampling and statistical inference
Sampling and statistical inferenceSampling and statistical inference
Sampling and statistical inferenceBhavik A Shah
 
Logit and Probit and Tobit model: Basic Introduction
Logit and Probit  and Tobit model: Basic IntroductionLogit and Probit  and Tobit model: Basic Introduction
Logit and Probit and Tobit model: Basic IntroductionRabeesh Verma
 
Forecasting and methods of forecasting
Forecasting and methods of forecastingForecasting and methods of forecasting
Forecasting and methods of forecastingMilind Pelagade
 
Statistical inference: Estimation
Statistical inference: EstimationStatistical inference: Estimation
Statistical inference: EstimationParag Shah
 
Scope of research - Research Methodology - Manu Melwin Joy
Scope of research - Research Methodology - Manu Melwin JoyScope of research - Research Methodology - Manu Melwin Joy
Scope of research - Research Methodology - Manu Melwin Joymanumelwin
 
Time Series Analysis - Modeling and Forecasting
Time Series Analysis - Modeling and ForecastingTime Series Analysis - Modeling and Forecasting
Time Series Analysis - Modeling and ForecastingMaruthi Nataraj K
 

Was ist angesagt? (20)

Hypothesis testing; z test, t-test. f-test
Hypothesis testing; z test, t-test. f-testHypothesis testing; z test, t-test. f-test
Hypothesis testing; z test, t-test. f-test
 
Lesson 2 stationary_time_series
Lesson 2 stationary_time_seriesLesson 2 stationary_time_series
Lesson 2 stationary_time_series
 
Nature, Scope, Functions and Limitations of Statistics
Nature, Scope, Functions and Limitations of StatisticsNature, Scope, Functions and Limitations of Statistics
Nature, Scope, Functions and Limitations of Statistics
 
Types of data by kamran khan
Types of data by kamran khanTypes of data by kamran khan
Types of data by kamran khan
 
ARIMA
ARIMA ARIMA
ARIMA
 
Time Series, Moving Average
Time Series, Moving AverageTime Series, Moving Average
Time Series, Moving Average
 
Sampling design ppt
Sampling design pptSampling design ppt
Sampling design ppt
 
Regression analysis ppt
Regression analysis pptRegression analysis ppt
Regression analysis ppt
 
Application of Univariate, Bi-variate and Multivariate analysis Pooja k shetty
Application of Univariate, Bi-variate and Multivariate analysis Pooja k shettyApplication of Univariate, Bi-variate and Multivariate analysis Pooja k shetty
Application of Univariate, Bi-variate and Multivariate analysis Pooja k shetty
 
Time Series - 1
Time Series - 1Time Series - 1
Time Series - 1
 
Correlation analysis
Correlation analysisCorrelation analysis
Correlation analysis
 
Sampling and statistical inference
Sampling and statistical inferenceSampling and statistical inference
Sampling and statistical inference
 
Logit and Probit and Tobit model: Basic Introduction
Logit and Probit  and Tobit model: Basic IntroductionLogit and Probit  and Tobit model: Basic Introduction
Logit and Probit and Tobit model: Basic Introduction
 
Time series.ppt
Time series.pptTime series.ppt
Time series.ppt
 
Sample design
Sample designSample design
Sample design
 
Forecasting and methods of forecasting
Forecasting and methods of forecastingForecasting and methods of forecasting
Forecasting and methods of forecasting
 
Regression Analysis
Regression AnalysisRegression Analysis
Regression Analysis
 
Statistical inference: Estimation
Statistical inference: EstimationStatistical inference: Estimation
Statistical inference: Estimation
 
Scope of research - Research Methodology - Manu Melwin Joy
Scope of research - Research Methodology - Manu Melwin JoyScope of research - Research Methodology - Manu Melwin Joy
Scope of research - Research Methodology - Manu Melwin Joy
 
Time Series Analysis - Modeling and Forecasting
Time Series Analysis - Modeling and ForecastingTime Series Analysis - Modeling and Forecasting
Time Series Analysis - Modeling and Forecasting
 

Ähnlich wie Time Series

timeseries-100127010913-phpapp02.pptx
timeseries-100127010913-phpapp02.pptxtimeseries-100127010913-phpapp02.pptx
timeseries-100127010913-phpapp02.pptxHarshitSingh334328
 
Demand forecasting by time series analysis
Demand forecasting by time series analysisDemand forecasting by time series analysis
Demand forecasting by time series analysisSunny Gandhi
 
Business forecasting and timeseries analysis phpapp02
Business forecasting and timeseries analysis phpapp02Business forecasting and timeseries analysis phpapp02
Business forecasting and timeseries analysis phpapp02MD ASADUZZAMAN
 
Applied Statistics Chapter 2 Time series (1).ppt
Applied Statistics Chapter 2 Time series (1).pptApplied Statistics Chapter 2 Time series (1).ppt
Applied Statistics Chapter 2 Time series (1).pptswamyvivekp
 
time series.pdf
time series.pdftime series.pdf
time series.pdfcollege
 
Presentation 2
Presentation 2Presentation 2
Presentation 2uliana8
 
Statistics assignment help service
Statistics assignment help serviceStatistics assignment help service
Statistics assignment help serviceMark Austin
 
Chapter 16
Chapter 16Chapter 16
Chapter 16bmcfad01
 
Moving average method maths ppt
Moving average method maths pptMoving average method maths ppt
Moving average method maths pptAbhishek Mahto
 
Data Science - Part X - Time Series Forecasting
Data Science - Part X - Time Series ForecastingData Science - Part X - Time Series Forecasting
Data Science - Part X - Time Series ForecastingDerek Kane
 
Trend analysis - Lecture Notes
Trend analysis - Lecture NotesTrend analysis - Lecture Notes
Trend analysis - Lecture NotesDr. Nirav Vyas
 

Ähnlich wie Time Series (20)

timeseries-100127010913-phpapp02.pptx
timeseries-100127010913-phpapp02.pptxtimeseries-100127010913-phpapp02.pptx
timeseries-100127010913-phpapp02.pptx
 
timeseries.ppt
timeseries.ppttimeseries.ppt
timeseries.ppt
 
Demand forecasting by time series analysis
Demand forecasting by time series analysisDemand forecasting by time series analysis
Demand forecasting by time series analysis
 
Business forecasting and timeseries analysis phpapp02
Business forecasting and timeseries analysis phpapp02Business forecasting and timeseries analysis phpapp02
Business forecasting and timeseries analysis phpapp02
 
Applied Statistics Chapter 2 Time series (1).ppt
Applied Statistics Chapter 2 Time series (1).pptApplied Statistics Chapter 2 Time series (1).ppt
Applied Statistics Chapter 2 Time series (1).ppt
 
Time series
Time series Time series
Time series
 
Time series
Time seriesTime series
Time series
 
The Dynamic AD AS Model
The Dynamic AD AS ModelThe Dynamic AD AS Model
The Dynamic AD AS Model
 
time series.pdf
time series.pdftime series.pdf
time series.pdf
 
Time series
Time seriesTime series
Time series
 
Time series
Time seriesTime series
Time series
 
Presentation 2
Presentation 2Presentation 2
Presentation 2
 
Time series
Time seriesTime series
Time series
 
Statistics assignment help service
Statistics assignment help serviceStatistics assignment help service
Statistics assignment help service
 
Chapter 16
Chapter 16Chapter 16
Chapter 16
 
Moving average method maths ppt
Moving average method maths pptMoving average method maths ppt
Moving average method maths ppt
 
Data Science - Part X - Time Series Forecasting
Data Science - Part X - Time Series ForecastingData Science - Part X - Time Series Forecasting
Data Science - Part X - Time Series Forecasting
 
Chapter 18 Part I
Chapter 18 Part IChapter 18 Part I
Chapter 18 Part I
 
Chapter-3_Heizer_S1.pptx
Chapter-3_Heizer_S1.pptxChapter-3_Heizer_S1.pptx
Chapter-3_Heizer_S1.pptx
 
Trend analysis - Lecture Notes
Trend analysis - Lecture NotesTrend analysis - Lecture Notes
Trend analysis - Lecture Notes
 

Mehr von yush313

Presentation On Hul
Presentation On HulPresentation On Hul
Presentation On Hulyush313
 
Presentation On Sub Prime Crises
Presentation On Sub Prime CrisesPresentation On Sub Prime Crises
Presentation On Sub Prime Crisesyush313
 
Doordarshan
DoordarshanDoordarshan
Doordarshanyush313
 
Bajaj Auto Financial Analysis
Bajaj Auto Financial AnalysisBajaj Auto Financial Analysis
Bajaj Auto Financial Analysisyush313
 

Mehr von yush313 (6)

Presentation On Hul
Presentation On HulPresentation On Hul
Presentation On Hul
 
Power
PowerPower
Power
 
Presentation On Sub Prime Crises
Presentation On Sub Prime CrisesPresentation On Sub Prime Crises
Presentation On Sub Prime Crises
 
Doordarshan
DoordarshanDoordarshan
Doordarshan
 
Inflat
InflatInflat
Inflat
 
Bajaj Auto Financial Analysis
Bajaj Auto Financial AnalysisBajaj Auto Financial Analysis
Bajaj Auto Financial Analysis
 

Kürzlich hochgeladen

08448380779 Call Girls In Greater Kailash - I Women Seeking Men
08448380779 Call Girls In Greater Kailash - I Women Seeking Men08448380779 Call Girls In Greater Kailash - I Women Seeking Men
08448380779 Call Girls In Greater Kailash - I Women Seeking MenDelhi Call girls
 
Maximizing Board Effectiveness 2024 Webinar.pptx
Maximizing Board Effectiveness 2024 Webinar.pptxMaximizing Board Effectiveness 2024 Webinar.pptx
Maximizing Board Effectiveness 2024 Webinar.pptxOnBoard
 
How to convert PDF to text with Nanonets
How to convert PDF to text with NanonetsHow to convert PDF to text with Nanonets
How to convert PDF to text with Nanonetsnaman860154
 
Enhancing Worker Digital Experience: A Hands-on Workshop for Partners
Enhancing Worker Digital Experience: A Hands-on Workshop for PartnersEnhancing Worker Digital Experience: A Hands-on Workshop for Partners
Enhancing Worker Digital Experience: A Hands-on Workshop for PartnersThousandEyes
 
Unblocking The Main Thread Solving ANRs and Frozen Frames
Unblocking The Main Thread Solving ANRs and Frozen FramesUnblocking The Main Thread Solving ANRs and Frozen Frames
Unblocking The Main Thread Solving ANRs and Frozen FramesSinan KOZAK
 
Slack Application Development 101 Slides
Slack Application Development 101 SlidesSlack Application Development 101 Slides
Slack Application Development 101 Slidespraypatel2
 
Raspberry Pi 5: Challenges and Solutions in Bringing up an OpenGL/Vulkan Driv...
Raspberry Pi 5: Challenges and Solutions in Bringing up an OpenGL/Vulkan Driv...Raspberry Pi 5: Challenges and Solutions in Bringing up an OpenGL/Vulkan Driv...
Raspberry Pi 5: Challenges and Solutions in Bringing up an OpenGL/Vulkan Driv...Igalia
 
08448380779 Call Girls In Diplomatic Enclave Women Seeking Men
08448380779 Call Girls In Diplomatic Enclave Women Seeking Men08448380779 Call Girls In Diplomatic Enclave Women Seeking Men
08448380779 Call Girls In Diplomatic Enclave Women Seeking MenDelhi Call girls
 
The 7 Things I Know About Cyber Security After 25 Years | April 2024
The 7 Things I Know About Cyber Security After 25 Years | April 2024The 7 Things I Know About Cyber Security After 25 Years | April 2024
The 7 Things I Know About Cyber Security After 25 Years | April 2024Rafal Los
 
My Hashitalk Indonesia April 2024 Presentation
My Hashitalk Indonesia April 2024 PresentationMy Hashitalk Indonesia April 2024 Presentation
My Hashitalk Indonesia April 2024 PresentationRidwan Fadjar
 
From Event to Action: Accelerate Your Decision Making with Real-Time Automation
From Event to Action: Accelerate Your Decision Making with Real-Time AutomationFrom Event to Action: Accelerate Your Decision Making with Real-Time Automation
From Event to Action: Accelerate Your Decision Making with Real-Time AutomationSafe Software
 
Automating Business Process via MuleSoft Composer | Bangalore MuleSoft Meetup...
Automating Business Process via MuleSoft Composer | Bangalore MuleSoft Meetup...Automating Business Process via MuleSoft Composer | Bangalore MuleSoft Meetup...
Automating Business Process via MuleSoft Composer | Bangalore MuleSoft Meetup...shyamraj55
 
08448380779 Call Girls In Friends Colony Women Seeking Men
08448380779 Call Girls In Friends Colony Women Seeking Men08448380779 Call Girls In Friends Colony Women Seeking Men
08448380779 Call Girls In Friends Colony Women Seeking MenDelhi Call girls
 
GenCyber Cyber Security Day Presentation
GenCyber Cyber Security Day PresentationGenCyber Cyber Security Day Presentation
GenCyber Cyber Security Day PresentationMichael W. Hawkins
 
CNv6 Instructor Chapter 6 Quality of Service
CNv6 Instructor Chapter 6 Quality of ServiceCNv6 Instructor Chapter 6 Quality of Service
CNv6 Instructor Chapter 6 Quality of Servicegiselly40
 
Tech-Forward - Achieving Business Readiness For Copilot in Microsoft 365
Tech-Forward - Achieving Business Readiness For Copilot in Microsoft 365Tech-Forward - Achieving Business Readiness For Copilot in Microsoft 365
Tech-Forward - Achieving Business Readiness For Copilot in Microsoft 3652toLead Limited
 
Histor y of HAM Radio presentation slide
Histor y of HAM Radio presentation slideHistor y of HAM Radio presentation slide
Histor y of HAM Radio presentation slidevu2urc
 
Understanding the Laravel MVC Architecture
Understanding the Laravel MVC ArchitectureUnderstanding the Laravel MVC Architecture
Understanding the Laravel MVC ArchitecturePixlogix Infotech
 
Finology Group – Insurtech Innovation Award 2024
Finology Group – Insurtech Innovation Award 2024Finology Group – Insurtech Innovation Award 2024
Finology Group – Insurtech Innovation Award 2024The Digital Insurer
 
Google AI Hackathon: LLM based Evaluator for RAG
Google AI Hackathon: LLM based Evaluator for RAGGoogle AI Hackathon: LLM based Evaluator for RAG
Google AI Hackathon: LLM based Evaluator for RAGSujit Pal
 

Kürzlich hochgeladen (20)

08448380779 Call Girls In Greater Kailash - I Women Seeking Men
08448380779 Call Girls In Greater Kailash - I Women Seeking Men08448380779 Call Girls In Greater Kailash - I Women Seeking Men
08448380779 Call Girls In Greater Kailash - I Women Seeking Men
 
Maximizing Board Effectiveness 2024 Webinar.pptx
Maximizing Board Effectiveness 2024 Webinar.pptxMaximizing Board Effectiveness 2024 Webinar.pptx
Maximizing Board Effectiveness 2024 Webinar.pptx
 
How to convert PDF to text with Nanonets
How to convert PDF to text with NanonetsHow to convert PDF to text with Nanonets
How to convert PDF to text with Nanonets
 
Enhancing Worker Digital Experience: A Hands-on Workshop for Partners
Enhancing Worker Digital Experience: A Hands-on Workshop for PartnersEnhancing Worker Digital Experience: A Hands-on Workshop for Partners
Enhancing Worker Digital Experience: A Hands-on Workshop for Partners
 
Unblocking The Main Thread Solving ANRs and Frozen Frames
Unblocking The Main Thread Solving ANRs and Frozen FramesUnblocking The Main Thread Solving ANRs and Frozen Frames
Unblocking The Main Thread Solving ANRs and Frozen Frames
 
Slack Application Development 101 Slides
Slack Application Development 101 SlidesSlack Application Development 101 Slides
Slack Application Development 101 Slides
 
Raspberry Pi 5: Challenges and Solutions in Bringing up an OpenGL/Vulkan Driv...
Raspberry Pi 5: Challenges and Solutions in Bringing up an OpenGL/Vulkan Driv...Raspberry Pi 5: Challenges and Solutions in Bringing up an OpenGL/Vulkan Driv...
Raspberry Pi 5: Challenges and Solutions in Bringing up an OpenGL/Vulkan Driv...
 
08448380779 Call Girls In Diplomatic Enclave Women Seeking Men
08448380779 Call Girls In Diplomatic Enclave Women Seeking Men08448380779 Call Girls In Diplomatic Enclave Women Seeking Men
08448380779 Call Girls In Diplomatic Enclave Women Seeking Men
 
The 7 Things I Know About Cyber Security After 25 Years | April 2024
The 7 Things I Know About Cyber Security After 25 Years | April 2024The 7 Things I Know About Cyber Security After 25 Years | April 2024
The 7 Things I Know About Cyber Security After 25 Years | April 2024
 
My Hashitalk Indonesia April 2024 Presentation
My Hashitalk Indonesia April 2024 PresentationMy Hashitalk Indonesia April 2024 Presentation
My Hashitalk Indonesia April 2024 Presentation
 
From Event to Action: Accelerate Your Decision Making with Real-Time Automation
From Event to Action: Accelerate Your Decision Making with Real-Time AutomationFrom Event to Action: Accelerate Your Decision Making with Real-Time Automation
From Event to Action: Accelerate Your Decision Making with Real-Time Automation
 
Automating Business Process via MuleSoft Composer | Bangalore MuleSoft Meetup...
Automating Business Process via MuleSoft Composer | Bangalore MuleSoft Meetup...Automating Business Process via MuleSoft Composer | Bangalore MuleSoft Meetup...
Automating Business Process via MuleSoft Composer | Bangalore MuleSoft Meetup...
 
08448380779 Call Girls In Friends Colony Women Seeking Men
08448380779 Call Girls In Friends Colony Women Seeking Men08448380779 Call Girls In Friends Colony Women Seeking Men
08448380779 Call Girls In Friends Colony Women Seeking Men
 
GenCyber Cyber Security Day Presentation
GenCyber Cyber Security Day PresentationGenCyber Cyber Security Day Presentation
GenCyber Cyber Security Day Presentation
 
CNv6 Instructor Chapter 6 Quality of Service
CNv6 Instructor Chapter 6 Quality of ServiceCNv6 Instructor Chapter 6 Quality of Service
CNv6 Instructor Chapter 6 Quality of Service
 
Tech-Forward - Achieving Business Readiness For Copilot in Microsoft 365
Tech-Forward - Achieving Business Readiness For Copilot in Microsoft 365Tech-Forward - Achieving Business Readiness For Copilot in Microsoft 365
Tech-Forward - Achieving Business Readiness For Copilot in Microsoft 365
 
Histor y of HAM Radio presentation slide
Histor y of HAM Radio presentation slideHistor y of HAM Radio presentation slide
Histor y of HAM Radio presentation slide
 
Understanding the Laravel MVC Architecture
Understanding the Laravel MVC ArchitectureUnderstanding the Laravel MVC Architecture
Understanding the Laravel MVC Architecture
 
Finology Group – Insurtech Innovation Award 2024
Finology Group – Insurtech Innovation Award 2024Finology Group – Insurtech Innovation Award 2024
Finology Group – Insurtech Innovation Award 2024
 
Google AI Hackathon: LLM based Evaluator for RAG
Google AI Hackathon: LLM based Evaluator for RAGGoogle AI Hackathon: LLM based Evaluator for RAG
Google AI Hackathon: LLM based Evaluator for RAG
 

Time Series

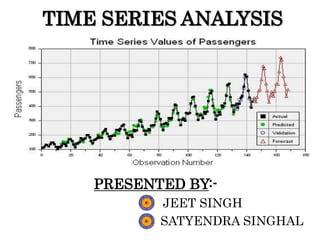
  • 1. TIME SERIES ANALYSIS PRESENTED BY:- JEET SINGH SATYENDRA SINGHAL
  • 2.
  • 3.
  • 4. Importance of Time Series Analysis:- As the basis of Time series Analysis businessman can predict about the changes in economy. There are following points which clear about the its importance: 1. Profit of experience. 2. Safety from future 3. Utility Studies 4. Sales Forecasting 5. Budgetary Analysis 6. Stock Market Analysis 7. Yield Projections 8. Process and Quality Control 9. Inventory Studies 10. Economic Forecasting 11. Risk Analysis & Evaluation of changes. 12. Census Analysis
  • 5.
  • 6. Seasonal variation :-
  • 7. Cyclical variation :-
  • 8.
  • 10. large scale shift in consumers demands, For example, population increases over a period of time,price increases over a period of years,production of goods on the capital market of the country increases over a period of years.These are the examples of upward trend. The sales of a commodity may decrease over a period of time because of better products coming to the market.This is an example of declining trend or downward.
  • 11. Seasonal variation: Seasonal variation are short-term fluctuation in a time series which occur periodically in a year. This continues to repeat  year after year. The major factors that are weather conditions and customs of people. More woolen clothes are sold in winter than in the season of summer . each year more ice creams are sold in summer and very little in Winter season. The sales in the departmental stores are more during festive seasons that in the normal days.
  • 12.
  • 13. Irregular variation: Irregular variations are fluctuations in time series that are short in duration, erratic in nature and follow no regularity in the occurrence pattern. These variations are also referred to as residual variations since by definition they represent what is left out in a time series after trend ,cyclical and seasonal variations. Irregular fluctuations results due to the occurrence of unforeseen events like : Floods, Earthquakes, Wars, Famines 
  • 14.
  • 15.
  • 16. Semi – Average Method:
  • 17. Moving Average Method:
  • 18.
  • 20. Semi – Average Method:- In this method the given data are divided in two parts, preferable with the equal number of years. For example, if we are given data from 1991 to 2008, i.e., over a period of 18 years, the two equal parts will be first nine years, i.e.,1991 to 1999 and from 2000 to 2008. In case of odd number of years like, 9, 13, 17, etc.., two equal parts can be made simply by ignoring the middle year. For example, if data are given for 19 years from 1990 to 2007 the two equal parts would be from 1990 to 1998 and from 2000 to 2008 - the middle year 1999 will be ignored.
  • 21.
  • 22.
  • 24.
  • 25.
  • 26. i.e., the sum of the squares of the deviation of the actual and computed values is least from this line. That is why method is called the method of least squares. The line obtained by this method is known as the line of `best fit`. is least
  • 27.
  • 28. Solution:- ’ Now we calculate the value of two constant ‘a’ and ‘b’ with the help of two equation:-
  • 29. Now we put the value of :- 50 = 5a + 15(b) ……………. (i) 166 = 15a + 55(b) ……………… (ii) Or 5a + 15b = 50 ……………… (iii) 15a + 55b = 166 …………………. (iv) Equation (iii) Multiply by 3 and subtracted by (iv) -10b = -16 b = 1.6 Now we put the value of “b” in the equation (iii)
  • 30. = 5a + 15(1.6) = 50 5a = 26 a = = 5.2 As according the value of ‘a’ and ‘b’ the trend line:- Yc = a + bx Y= 5.2 + 1.6X Now we calculate the trend line for 1996:- Y1996 = 5.2 + 1.6 (6) = 14.8
  • 31.
  • 32.
  • 33. If we take the deviation from ‘Mean year’ then the all three equation are presented like this: Parabola of second degree:-
  • 34.
  • 35.
  • 36. Equation (ii) is multiply by 2 and subtracted from (iii): 10a + 34c = 76 …………….. (iv) 10a + 20c = 70 …………….. (v) 14c = 6 or c = = 0.43 Now we put the value of c in equation (i) 5a + 10 (0.43) = 35 5a = 35-4.3 = 5a = 30.7 a = 6.14 Now after putting the value of ‘a’, ‘b’ and ‘c’, Parabola of second degree is made that is: Y = 6.34 + 1.2x + 0.43x2
  • 37. Parabola of Third degree:- There are four constant ‘a’, ‘b’, ‘c’ and ‘d’ which are calculated by following equation. The main equation is Yc = a + bx + cx2 + dx3. There are also four normal equation.
  • 38.
  • 39. Seasonal Average Method Seasonal Averages = Total of Seasonal Values No. Of Years General Averages = Total of Seasonal Averages No. Of Seasons Seasonal Index = Seasonal Average General Average
  • 40. EXAMPLE:- From the following data calculate quarterly seasonal indices assuming the absence of any type of trend:
  • 41. Solution:- Calculation of quarterly seasonal indices
  • 42. General Average = 497.75 = 124.44 4 Quarterly Seasonal variation index = 125.75 x 100 124.44 So as on we calculate the other seasonal indices
  • 43. Link Relative Method: In this Method the following steps are taken for calculating the seasonal variation indices We calculate the link relatives of seasonal figures. Link Relative: Current Season’s Figure x 100 Previous Season’s Figure We calculate the average of link relative foe each season. Convert These Averages in to chain relatives on the basis of the first seasons.
  • 44. Calculate the chain relatives of the first season on the base of the last seasons. There will be some difference between the chain relatives of the first seasons and the chain relatives calculated by the pervious Method. This difference will be due to effect of long term changes. For correction the chain relatives of the first season calculated by 1st method is deducted from the chain relative calculated by the second method. Then Express the corrected chain relatives as percentage of their averages.
  • 45. Ratio To Moving Average Method: In this method seasonal variation indices are calculated in following steps: We calculate the 12 monthly or 4 quarterly moving average. We use following formula for calculating the moving average Ratio: Moving Average Ratio= Original Data x 100 Moving Average Then we calculate the seasonal variation indices on the basis of average of seasonal variation.
  • 46. Ratio To Trend Method:- This method based on Multiple model of Time Series. In It We use the following Steps: We calculate the trend value for various time duration (Monthly or Quarterly) with the help of Least Square method Then we express the all original data as the percentage of trend on the basis of the following formula. = Original Data x 100 Trend Value Rest of Process are as same as moving Average Method
  • 47.
  • 50.
  • 51. At last we express the cyclical and irregular variation as the Trend Ratio & Seasonal variation Indices(b) When monthly or quarterly data are given:
  • 52. Measurement of Irregular Variations The irregular components in a time series represent the residue of fluctuations after trend cycle and seasonal movements have been accounted for. Thus if the original data is divided by T,S and C ; we get I i.e. . In Practice the cycle itself is so erratic and is so interwoven with irregular movement that is impossible to separate them.
  • 53. References:- Books of Business Statistics S.P.Gupta & M.P.Gupta Books of Business Statistics : Mathur, Khandelwal, Gupta & Gupta
  • 54. m

Hinweis der Redaktion

  1. Time