
Empfohlen
Weitere ähnliche Inhalte
Andere mochten auch
Ähnlich wie February 17 Blackboards
Ähnlich wie February 17 Blackboards (20)
Mehr von yukondawn
February 17 Blackboards
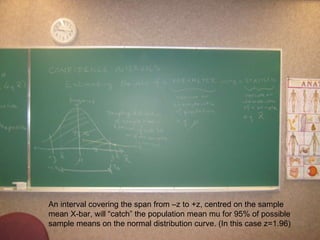
- 1. An interval covering the span from –z to +z, centred on the sample mean X-bar, will “catch” the population mean mu for 95% of possible sample means on the normal distribution curve. (In this case z=1.96)
- 3. Confidence interval formulae for mu where n>= 30 and sigma is known (top), and where n>= 30 but sigma is not known (bottom).
- 4. Confidence interval formulae for the mean when n<30 and sigma is known (top), and n<30 but sigma not known (bottom). The variable has to be normally distributed to use either of these – if it isn’t, we don’t know how to deal (in this course).
- 6. Confidence interval formula for sample proportion. Works as long as n is big enough that n times p-hat is >=5, and n times q-hat is also >=5.
- 7. Example of confidence interval for a proportion
- 9. The “margin of error” E is half the width of the confidence interval. This is what people are talking about when they say things like “plus or minus 5%, 19 times out of 20” (19/20=0.95, or 95% confidence)
- 10. If you know the level of confidence you want, and the margin of error you are willing to tolerate, you can calculate how much data you will need to collect (minimum sample size).
- 11. Example of calculating minimum sample size needed to estimate a proportion.
- 12. Example continued. Note you should ALWAYS round up (you have to take a whole extra person to get 0.1 of a person).
- 13. Example of finding a confidence interval for a variance or standard deviation.
- 15. Another example
- 16. End of example