Fuel optimization
•Als PPS, PDF herunterladen•
3 gefällt mir•2,579 views

Fuel Cost represents about 30 % of airline cost any saving in this element will lead to reduce the total cost , this presentation explore the method of monitoring the fuel and the human factors
![Introduction ,[object Object],[object Object],[object Object],[object Object]](data:image/gif;base64,R0lGODlhAQABAIAAAAAAAP///yH5BAEAAAAALAAAAAABAAEAAAIBRAA7)
Empfohlen
Weitere ähnliche Inhalte
Was ist angesagt?
Was ist angesagt? (20)
Ähnlich wie Fuel optimization
Ähnlich wie Fuel optimization (20)
Mehr von Mohammed Awad
Mehr von Mohammed Awad (20)
Kürzlich hochgeladen
Kürzlich hochgeladen (20)
Fuel optimization
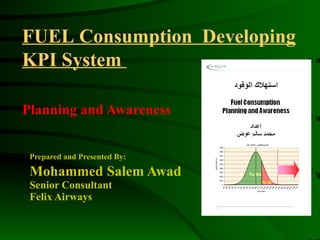
- 1. Prepared and Presented By: Mohammed Salem Awad Senior Consultant Felix Airways Planning and Awareness FUEL Consumption Developing KPI System
- 8. Statistics In Practice Exponential Distribution: Time Between Overhaul, Life of Component. Weibull Distribution: Failure Diagnostics and Performance Monitoring. Poisson Distribution: Initial Spare Provisioning, Engines In Stocks. Gama Distribution: Material Forecasting. Beta Distribution: Time Activity in Maintenance. Normal Distribution: Spill Analysis Quality Control – Fuels, Defects
- 9. Quality Control Chart Normal Distribution Basic Equation
- 10. Quality Control Chart Examples Control Chart of Defective Products ( in Manufacture Process ) Mean Value Upper Control Limit Lower Control Limit Dimensions
- 11. Quality Control Chart Examples Control Chart for Unscheduled Removal ( Maintenance & Reliability ) Mean Value Upper Control Limit Lower Control Limit Removal Rate
- 12. Developing Control limits of Fuel Consumption The Sequence of the analysis Input Data Frequency Distribu- tion Data Filtra- tion Data Analysis N. D. Control Chart Develop KPI
- 13. Developing Control limits of Fuel Consumption Basic Collection Data Fuel Used Input Data
- 14. Developing Control limits of Fuel Consumption Basic Collection Data Input Data
- 15. Developing Control limits of Fuel Consumption Frequency Distribution Frequency Distribu- tion
- 16. Developing Control limits of Fuel Consumption Data Filtration Data Filtra- tion SAH-ADE Sector – Frequency Distribution Fuel Consumption Qty
- 17. Developing Control limits of Fuel Consumption Data Filtration Data Filtra- tion SAH-ADE Sector – Frequency Distribution Fuel Consumption Qty
- 18. Developing Control limits of Fuel Consumption Data Filtration Data Filtra- tion
- 19. Developing Control limits of Fuel Consumption Data Filtration Data Filtra- tion SAH-ADE Sector – Frequency Distribution Fuel Consumption Qty
- 20. Developing Control limits of Fuel Consumption Data Analysis No. of Reading : 761 Average = 1008 Standard Deviation = 127 Sector: SAH-ADE Data Analysis N. D.
- 21. Developing Control limits of Fuel Consumption Data Analysis N. D.
- 22. Developing Control limits of Fuel Consumption Data Analysis N. D.
- 23. Developing Control limits of Fuel Consumption Data Analysis N. D.
- 24. Developing Control limits of Fuel Consumption Control Chart For SAH-ADE Develop KPI
- 25. Developing Control limits of Fuel Consumption Alert Level Aircraft CRJ 700 Develop KPI
- 26. Developing Control limits of Fuel Consumption Alert Level Aircraft CRJ 200 Develop KPI
- 28. contact Further Information: Mohammed Salem Awad : Tel: 00967 734777518 Email: smartdecision2002@yahoo.com www.freewebs.com/wingsofwisdom/ www.freewebs.com/art-of-knowledge/ www.standout-from-the-crowds.webs.com