![[object Object],[object Object],[object Object],[object Object],[object Object],[object Object],[object Object],[object Object],OBJECTIVES](data:image/gif;base64,R0lGODlhAQABAIAAAAAAAP///yH5BAEAAAAALAAAAAABAAEAAAIBRAA7)
Empfohlen
Weitere ähnliche Inhalte
Was ist angesagt?
Was ist angesagt? (20)
Andere mochten auch
Andere mochten auch (20)
Ähnlich wie Map Skills Revision
Ähnlich wie Map Skills Revision (20)
Mehr von whiskeyhj
Mehr von whiskeyhj (20)
Kürzlich hochgeladen
Kürzlich hochgeladen (20)
Map Skills Revision
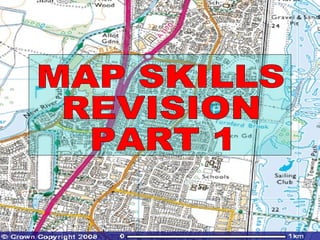
- 1. MAP SKILLS REVISION PART 1
- 6. USING A MAP KEY Ordnance survey maps use a series of symbols to indicate features of the landscape. In the examination you will be given a key to the symbols. This is exactly the same as the one you now have in front of you. Study this lots at home. You are not expected to know it off be heart but a good general understanding of some of the key features will help you save time in the exam. Take care with the following symbols that are often confused. Look at your symbol key now
- 14. COMPASS DIRECTIONS The minimum you should know is the eight point compass although it would be better to know the 16 point compass shown here.
- 17. Step 2 Repeat this process until you reach your destination
- 18. Step 3 You should be left with a series of marks along the edge of your paper. You can now place the sheet against the scale bar on your map. The last mark you made will tell you the real distance you need to travel
- 19. Describing Human & Physical Features from Maps Example Question Study Figure 1, the Ordnance Survey map extract for Reading in southern England. (c) Compare the relief and land uses in grid squares 7877 and 6677.
- 20. RELIEF My goodness, I am quite RELIEVED I got to the top Relief means the height and shape of the land. I like to remember it by thinking about how relieved I am when I get to the top. – This associates it with land height and shape. Take care with the spelling though.
- 21. DRAINAGE This is the surface water features such as:- Rivers – drawn as blue line but not to be confused with motorways!!! Lakes – Looks like a large blue puddle Marsh-
- 22. VEGETATION This includes the obvious green wooded areas but look out for which means rough grassland. On the OS 1:25 000 map vegetation is shown in more detail – check the symbols key carefully Rough Grassland Coniferous Trees Non Coniferous Trees
- 23. Vegetation
- 24. Rough Grassland Coniferous Woodland Non Coniferous
- 25. LAND USE When asked what the land use is you must explain what the land is USED for. In this case depending on which grid square you can see a variety of land uses e.g. a golf course, residential areas, lakes used for recreation, Roads, Allotments and many more.
- 26. SETTLEMENT This includes:- Its location – Where is it? Its shape – (linear, star shaped, nucleated) Its pattern – (nucleated, dispersed or evenly spread)
- 27. PATTERNS OF COMMUNICATION This includes:- Canals Railways Roads don’t forget to know the difference between A roads, Motorways, B Roads, Rough Tracks. Look at your OS key carefully
- 28. River Motorway
- 29. Four Figure Grid Reference 7877
- 30. Four Figure Grid Reference 6677
- 31. 7877 6677 RELIEF RELIEF LAND USES LAND USES COMPARE
- 32. Four Figure Grid Reference 7877 Four Figure Grid Reference 6677
- 34. 7877 6677 RELIEF RELIEF LAND USES LAND USES COMPARE
- 37. ANALYSING AERIAL PHOTOGRAPHS As well as Ordnance Survey maps you will also be given a photograph of part of the area shown on an OS map. The first thing to do is make sure you orientate your photograph correctly so you know exactly which part of the map is shown. Lets do this now for Reading What are the key points to look at?
- 38. Y X Z Look for key features on the map to find out where it is on the OS map then use the OS map to identify the features. For this example the stadium is easy to see as is the roads and shape of the fields
- 40. A CHECK LIST TO HELP YOU TO DESCRIBE FEATURES ON A MAP
- 41. Includes settlement, vegetation and communications but also industry, recreational areas and agriculture Site – height, slope, landform, water supply, resources Situation – relate site to relief and drainage and other settlements Route focus, bridging point Shape – linear or star shaped, dispersed, nucleated Land Use Settlement Types, Direction Landforms followed or avoided Influence of settlement Woodland – location, amount, plantations or natural woodland Rough Pasture – location, amount Communications Vegetation Number of rivers Direction of flow Width Straight or winding Tributaries Human influence – straightening Lakes, marshes or floodplains Contour patterns Landforms Steepness of slopes Heights (general height, maximum, lowers) Valleys – number, shape, gradient, Drainage Relief
- 42. TYPES OF MAPS YOU WILL HAVE TO KNOW HOW TO READ
- 43. Dot Maps Dot maps show the distribution of actual numbers of items. In geography they are Mainly used to show population distribution. Above one dot equals 1 million people. The map overall gives a good impression of the world population distributions but it is difficult to obtain accurate figures.
- 44. Rules of the Choropleth map 1. Only use one colour to show differences in intensity or density This is a good example however it is very difficult to carry it so one alternative may be hatching WHAT IS A CHOROPLETH MAP?
- 47. Try Cross Hatching If you don’t have 3 different colour blues varying greatly in shade from dark to light use the cross hatching technique to show density ANSWERS DON’T FORGET THE KEY IT’S WORTH 2 MARKS!
- 50. PLENARY