
Empfohlen
Weitere ähnliche Inhalte
Was ist angesagt?
Was ist angesagt? (20)
Ähnlich wie Abc holdings results 2014
Ähnlich wie Abc holdings results 2014 (20)
Mehr von wgjlubbe
Mehr von wgjlubbe (12)
Kürzlich hochgeladen
Kürzlich hochgeladen (20)
Abc holdings results 2014
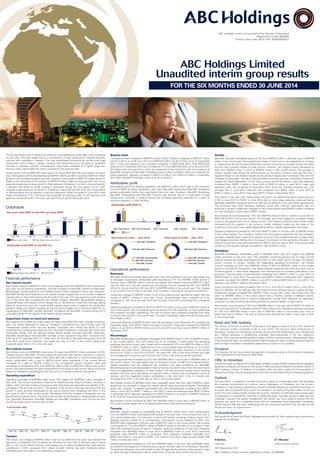
- 1. ABC Holdings Limited (Incorporated in the Republic of Botswana) (Registration number 99/4865) Ordinary share code: ABCH ISIN: BW0000000017 ABC Holdings Limited Unaudited interim group results FOR THE SIX MONTHS ENDED 30 JUNE 2014 The Group posted a set of results that were less than satisfactory, particularly when compared to prior year. This was largely due to a combination of high impairments, reduced business volumes and a squeeze in margins. This was exacerbated somewhat by the fact that huge investments were made in people, systems and infrastructure on the back of projected increase in business volumes. Consequently costs have increased at a higher pace than revenue which was broadly fl at when compared to the previous year. Group pre-tax profi t at BWP100 million was 41% below BWP169 million achieved in the prior year. Attributable profi t to shareholders at BWP63 million was 56% lower than BWP143 million posted in the comparative period last year. However, total assets at BWP16.3 billion were 4% ahead of the December 2013 position of BWP15.8 billion. Balance sheet growth was not as expected largely due to lower growth in Botswana and Zimbabwe. In a bid to improve liquidity, a decision was taken to curtail lending in Botswana during the fi rst quarter of this year, whereas tough economic conditions in Zimbabwe meant that we had to be very conservative on lending hence the low growth in loans and advances. When compared to June 2013, total assets increased by 27%. The Group has expanded its physical outlets to 161 branches and agencies compared to 65 in the prior year and 73 as at end of December 2013. OVERVIEW Net asset value (BWP m) and NAV per share (BWP) 2.87 3.09 420 453 4.35 650 5.54 5.64 5.61 1 422 1 450 1 441 Jun 10 Jun 11 Jun 12 Jun 13 Dec 13 Jun 14 Net asset value Net asset value per share Attributable profit (BWP m) and ROE (%) 14% 17% 18% 28 37 56 143 63 22% 9% Jun 10 Jun 11 Jun 12 Jun 13 Jun 14 Attributable profit (BWP m) ROE (%) Financial performance Net interest income Net interest income of BWP472 million was marginally lower than BWP476 million achieved in prior year. All the banking subsidiaries, with the exception of BancABC Zambia and BancABC Mozambique, posted growth in net interest income when compared to prior year. However, BancABC Zambia had a reduction in net interest margins largely due to an increase in deposit interest rates in that market during the fi rst half of the year. This put pressure on the funding cost of the bank and consequently net interest margins. BancABC Mozambique posted a marginally lower net interest income largely due to the decline in rates that has been taking place for some time now. As a result overall margins were lower. In addition the centre also posted a larger net interest expense during the period largely due to having funded the re-capitalisation of BancABC Zambia, BancABC Zimbabwe and BancABC Tanzania during H2-13 using debt ahead of the closure of the capital raising initiatives. Impairment losses on loans and advances Net impairments of BWP152 million were 4% higher than BWP146 million charged in the prior year. The Group continued to have an increase in non-performing loans mostly from the Zimbabwean market which has had liquidity constraints that limited the ability of most corporates from repaying their debts on time. BancABC Zimbabwe constituted 42% of the loan impairment charge with the balance shared almost equally amongst BancABC Botswana, BancABC Mozambique and BancABC Zambia. Gross non-performing loans increased from 9.8% as at 31 December 2013 to 14.9% as at 30 June 2014. Non-performing loans as at 30 June 2013 were 8.7%. However, the credit loss ratio of 2.9% in the current period was marginally lower than 3.1% in the prior year. Non interest income Non-interest income of BWP363 million was 2% lower than BWP371 million achieved in 2013. Trading income in BancABC Tanzania was lower than prior year due to a reduction in volumes of government securities traded. Head offi ce also had a reduction in mark-to-market gain in equity investments with a loss of BWP5 million being registered in the current period compared to a gain of BWP54 million in the comparative period. However, fees and commissions increased by 32% from BWP187 million in 2013 to BWP247 million in the current period. This demonstrates the vast improvement in the quality of this income line as the Group reaps the rewards of expanding its retail foot print to increase customer transactions. Operating expenditure Operating expenses of BWP584 million were 10% higher than BWP529 million recorded in prior year. The Group continued to expand its Retail banking footprint thereby resulting in higher costs. The total number of physical outlets (branches and agencies) now stands at 161, compared to 65 as at 30 June 2013. The growth in the Group’s revenues was lower than the growth in costs and this contributed to the cost to income ratio increasing from 62% in the prior year to 70% in the current period. We believe that this increase is temporary and we should see an improvement in the cost to income ratio as the change in strategy begins to bear fruit. BancABC Botswana, BancABC Zambia and BancABC Zimbabwe were not too far from the Group target cost to income ratio of 50%. Cost income ratio 77% 77% 72% 74% 62% 71% 75% 70% 66% Jun 10 Dec 10 Jun 11 Dec 11 Jun 12 Dec 12 Jun 13 Dec 13 Jun 14 Taxation The Group’s tax charge at BWP40 million was not too different from prior year despite the reduction in profi tability. This increased the effective tax from 24% in the prior year to about 40% in the current period and this was largely due to higher dividends that were paid by subsidiaries in 2014 compared 2013 where virtually nothing was paid. Dividends attract withholding tax when paid in the respective jurisdictions. Balance sheet The balance sheet increased to BWP16.3 billion (US $1.9 billion) compared to BWP13.7 billion (US $1.6 billion) as at 30 June 2013 and BWP15.8 billion (US $1.8 billion) as at 31 December 2013. Loans and advances only increased marginally to BWP10.58 billion from BWP10.55 billion as at 31 December 2013 but increased by 7% from BWP9.85 billion as at 30 June 2013. All entities had some growth in loans and advances during the period with the exception of BancABC Tanzania and BancABC Zimbabwe where market conditions were not conducive for credit expansion. Deposits increased to BWP12.9 billion from BWP12.2 billion in December 2013 (6%) and BWP10.9 billion (18%) as at 30 June 2013. Attributable profit Attributable profi t from banking operations was BWP147 million which was a 15% reduction from the BWP172 million achieved in prior year. BancABC Zambia and BancABC Zimbabwe posted attributable profi ts that were better than prior year. However, BancABC Botswana, BancABC Mozambique and BancABC Tanzania had declines due to a combination of high impairments, reduction in trading income and increased operating expenses as a result of business expansion in retail banking. Attributable profit (BWP m) 59 1 9 1 (17) 35 69 81 33 48 ABC Botswana ABC Mozambique ABC Tanzania ABC Zambia ABC Zimbabwe 2014 2013 Total assets by entity – June 2014 Total assets by entity – June 2013 29% BancABC Zimbabwe 33% BancABC Botswana 15% BancABC Mozambique 7% BancABC Tanzania 16% BancABC Zambia 31% BancABC Zimbabwe 38% BancABC Botswana 12% BancABC Mozambique 7% BancABC Tanzania 12% BancABC Zambia Operational performance Botswana BancABC Botswana’s performance was lower than that achieved in the prior year largely due to increased impairments. Attributable profi t declined by 27% from BWP81 million earned in the prior year to BWP59 million in the current period. Net interest income at BWP191 million was the same as in the prior period, but non-interest income increased by 6% from BWP36 million for the six months to 30 June 2013 to BWP39 million in the current year. The increase in non-interest income was on the back of an increase in volumes of customer transactions. Impairment charges of BWP32 million in the current period were signifi cantly higher than the charge of BWP11 million in prior year. Gross non-performing loans increased to 3.4% compared to 1.8% as at 30 June 2013 with the bulk of the NPLs emanating from wholesale banking. Operating expenses increased by 8% from BWP112 million in prior year to BWP122 million in the current period, due to increased business activity from the expansion of retail outlets that the subsidiary has been undertaking. The cost to income ratio increased marginally from 49% in the prior year to 53% in the current year. The ratio is marginally higher than the Group’s short term target of 50%. Loans and advances at BWP3.8 billion were fl at compared to the December 2013 position but marginally higher than BWP3.7 billion recorded in June 2013. Deposits increased from BWP4.8 billion in June 2013 to BWP5.0 billion as at 30 June 2014 and they were at BWP4.7 billion in December 2013. Mozambique BancABC Mozambique’s profi tability decreased from BWP9 million in 2013 to BWP0.6 million in the current period. This was mainly due to an increase in impairments and operating expenses during the current year. Impairments increased by 27% from BWP18 million in 2013 to BWP22 million in 2014. Impairments in the current period were driven by a mix of both corporate and retail clients. However, gross non-performing loans improved in the current period from 12.8% in June 2013 to 8.0%. The gross NPL ratio at this level remains very high and management is working hard to lower this further in the coming reporting periods. Operating expenses increased by 33% from BWP66 million in prior year to BWP88 million in the current period. This was largely due to increased number of staff and increased branch-related expenses from the expansion the subsidiary has been embarking on. BancABC Mozambique plans to be represented in most of the key economic hubs within the country and hence the aggressive expansion of retail outlets. The new branches always have a time-lag between the time costs start being incurred and when a critical mass is achieved in terms of revenue and this negatively impacts profi tability in the short-term. Cost to income ratio increased from 67% in the prior year to 79% in the current period. Net interest income of BWP56 million was marginally lower than prior year’s BWP57 million largely due to a squeeze in margins as market interest rates continued to decline. The balance sheet size, however, increased dramatically with loans and advances increasing from BWP1 billion in June 2013 to BWP1.7 billion in June 2014. Loans and advances were BWP1.5 billion in December 2013. Deposits increased from BWP1.6 billion in June 2013 to BWP2.3 billion as at 30 June 2014 the same level as at December 2013. Non-interest income increased by 36% from BWP40 million in prior year to BWP55 million in the current period largely due to increased trade fi nance fees and commissions. Tanzania BancABC Tanzania posted an attributable loss of BWP17 million which was a deterioration from the BWP0.6 million attributable profi t posted in the prior year. Income was lower than in prior period largely due to a reduction in bond and foreign exchange trading income from reduced volumes traded. As a consequence, non-interest income declined by 36% from BWP39 million registered in the prior year to BWP25 million in the current period. Net interest income grew by 11% from BWP17 million to BWP19 million on the back of an increase in retail loans and advances during the period. However, loans and advances in total only marginally increased from BWP592 million in June 2013 to BWP610 million in June 2014. Loans and advances were BWP575 million in December 2013. Deposits increased marginally from BWP1,181 million in June 2013 to BWP1, 227 million in June 2014. Deposits were BWP1,299 million in December 2013. Operating expenses increased by 18% from BWP58 million in the prior year to BWP68 million as a result of the expansion of the business to grow the retail reach of the business. BancABC Tanzania has followed a low cost model to open 87 agencies during the current period in order to utilise the payroll deduction code to under-write consumer loans across the country. Zambia BancABC Zambia’s profi tability grew by 8% from BWP33 million in the prior year to BWP35 million in the current year. The exceptional increase in total income was negated by an increase in impairments during the period. Business volumes continued to increase across the board and this had a positive impact on total income. However, net interest income decreased by 20% from BWP42 million in 2013 to BWP34 million in the current period. The increase in market interest rates during the period pushed up the bank’s funding costs and this had a negative impact on net interest margins as the pricing of assets did not change in line with the interbank funding rates. The bank’s balance sheet continued growing in Botswana Pula terms despite the rapid depreciation of the local currency during the period. Loans and advances increased from BWP1.1 billion in June 2013 to BWP1.4 billion in June 2014. Loans and advances were fl at compared to December 2013 when the Zambian Kwacha was 12% stronger than in June 2014. Deposits also increased from BWP1 billion in June 2013 to BWP1.4 billion in June 2014. They were BWP1.2 billion in December 2013. The quality of the loan book deteriorated with gross non-performing loans worsening from 4.3% in June 2013 to 15.9% in June 2014 due to a few large corporate customers being adversely classifi ed during the period as they did not perform in line with facility agreements. The consumer loan book remained relatively sound with minimal impairments and low accounts in arrears. Impairment charges for the current period were BWP33 million compared to a net write-back in prior year of BWP1 million. Non-interest income increased by 72% from BWP79 million in the six months to June 2013 to BWP135 million in the current period. The increase was driven largely by increased foreign currency and government bond trading income. The volumes of government bonds traded increased and the volatility in the currency market widened margins as the value of the currency at some point was rapidly depreciating before it rapidly appreciated once again. Operating expenses increased by 15% from BWP72 million in the prior year to BWP82 million in the current period. The increase is mainly from the business expansion that the subsidiary has been undertaking as it grew the capacity of some of the smaller branches to make them fully fl edged branches offering the full bouquet of products to the customers. However, the cost to income ratio continued to decline from 59% in the prior year to 49% in the period under review as income grew strongly compared to the increase in costs. Zimbabwe BancABC Zimbabwe’s attributable profi t of BWP69 million was 42% higher than BWP48 million achieved in the prior year. The subsidiary continued growing all its major income streams despite the tough operating environment in that market which has seen the liquidity crunch continue to worsen. Despite the challenging operating environment, net interest income increased by 22% from BWP182 million in 2013 to BWP222 million in the current period on the back of the growth in the higher yielding consumer loan book and lower cost of funds as growth in other asset categories was restricted due to increasing bad debts in the economy. The loan book in total declined marginally from BWP3.1 billion in June 2013 to BWP3.0 billion in June 2014. The loan book was BWP3.1 billion in December 2013. Deposits, however, increased from BWP2.3 billion in June 2013 to about BWP3 billion in June 2014 – the deposits were BWP2.7 billion in December 2013. Gross non-performing loans increased from 9.1% in June 2013 to about 25% in June 2014. This is a refl ection of the diffi culty that the whole fi nancial services industry is going through. Impairment charges increased from BWP57 million in prior year, which was mostly from one client, to BWP64 million in the current period from a diverse number of different clients. Management is determined to reduce impairments through both collection on delinquent customers as well as restricting lending primarily to industry leaders in each sector. Non-interest income grew by 16% from BWP99 million in the prior year to BWP115 million in the current period from increased volumes of retail transactions. Operating expenses increased by 10% from BWP166 million in prior year to BWP183 million in the current year, most of which was due to infl ation. The cost to income ratio declined from 59% in prior year to 54% in the current year. Retail and SME banking The Group continued its rollout of the branch and agency network which now stands at 161 physical outlets compared to 65 in June 2013. The Group’s retail performance in Botswana, Zambia and Zimbabwe remained strong and both Mozambique and Tanzania are also making headways in establishing profi table retail businesses in the two respective entities. The Group has payroll deduction codes in all the markets except in Mozambique. Most of the consumer loans are therefore either payroll deduction loans or group scheme loans for staff of large corporates or respective governments in each of our markets. Dividend The Directors do not recommend the payment of dividend owing to the imminent fi nalisation of the acquisition of the Group by Atlas Mara. Offer to minorities During the month of August 2014, Atlas Mara Co-Nvest Limited (ATMA) obtained all the regulatory approvals to acquire the shares of the Group. ATMA has secured 95.84% benefi cial interest in ABC Holdings Limited. In addition a mandatory offer has been made for the acquisition of shares from all the minority shareholders in line with the Botswana Stock Exchange regulations. Outlook The economies in presence countries continue to grow at a reasonable pace. We anticipate the business environment to continue being challenging in Zimbabwe but the Group’s subsidiary in that market is expected to remain profi table despite the expected slow-down in business. We are determined to arrest the increase in non-performing loans within the Group and to this end, a special team comprising of senior members of staff that have several years of experience in successfully collecting on defaulting loans, has been set-up to deal with this challenge. Liquidity and capital management will remain key focus areas to ensure that the business can grow at a sustainable pace with all subsidiaries being adequately capitalised. Whilst the fi rst half has been challenging we are cautiously optimistic that the second half results will show an improvement. Acknowledgment We would like to thank the Board, Management and staff for their resilience and commitment despite the challenges. H Buttery D T Munatsi Chairman Chief executive offi cer 29th September 2014 ABC Holdings Limited company registration number: CO.99/4865
- 2. ê Total income down by 3% from BWP701 million to BWP684 million é Operating expenses up 10% from BWP529 million to BWP584 million due to continued expansion of our retail outlets é Cost to income ratio increased to 70% (H113: 62%) ê Net operating income down 42% from BWP172 million to BWP100 million ê Pre-tax profit 41% down from BWP169 million to BWP100 million ê Attributable profit to shareholders of BWP63 million (H113: BWP143 million); ê Basic EPS of 24.4 thebe (H113: 59.1 thebe) ê Shareholders’ funds declined by 1% since December 2013 to BWP1.44 billion largely due to the weakening of the Zambian Kwacha during the period ê NAV per share declined marginally from BWP5.64 as at 31 December 2013 to BWP5.61. NAV per share was BWP5.54 on 30 June 2013 é Deposits increased by 6% since December 2013 and 18% from June 2013, to BWP12.9 billion é Loans and advances increased marginally by 0.2% since December 2013 and by 7% from June 2013, to BWP10.6 billion é Total assets increased by 4% since December 2013 and by 19% from June 2013 to BWP16.3 billion; ê Average return on equity at 9% (H113: 22%) continued overleaf Consolidated income statement FOR THE SIX MONTHS PERIOD ENDED 30 JUNE 2014 BWP’000s – (Presentation currency) Notes Unaudited 30 Jun 2014 6 months Reviewed 30 Jun 2013 6 months Audited 30 Dec 2013 12 months Interest and similar income 1,010,332 993,559 1,928,833 Interest expense and similar charges (538,141) (517,070) (918,502) Net interest income before impairment of advances 472,191 476,489 1,010,331 Impairment losses on loans advances (151,821) (146,055) (327,974) Net interest income after impairment of advances 320,370 330,434 682,357 Non interest income 3 363,300 370,892 692,094 Total income 683,670 701,326 1,374,451 Operating expenditure 4 (584,014) (529,377) (1,116,458) Net income from operations 99,656 171,949 257,993 Share of results of associates – (2,826) (4,004) Profit before tax 99,656 169,123 253,989 Tax (39,857) (40,555) (79,633) Profit for the period 59,799 128,568 174,356 Attributable to: Ordinary shareholders 62,791 142,878 198,454 Non-controlling interest (2,992) (14,310) (24,098) Profit for the period 59,799 128,568 174,356 Earnings per share (thebe) 24.4 59.1 79.6 Diluted earnings per share (thebe) 24.4 57.3 79.0 Dividend per share (thebe) 4.5 8.0 22.0 Weighted average number of shares (000’s) 256,886 241,635 249,344 Consolidated balance sheet AS AT 30 JUNE 2014 BWP’000s – (Presentation currency) Notes Unaudited 30 Jun 2014 Reviewed 30 Jun 2013 Audited 30 Dec 2013 ASSETS Cash and short-term funds 2,262,632 1,478,562 2,304,283 Financial assets held for trading 1,840,106 861,034 1,260,049 Financial assets designated at fair value 261,156 250,394 261,552 Derivative financial assets 16,091 18,889 27,636 Loans and advances 5 10,575,540 9,854,372 10,554,699 Investment securities 66,977 63,173 67,975 Prepayments and other receivables 260,363 235,509 261,651 Current tax assets 30,905 17,863 32,992 Investment in associates 13,254 14,440 13,320 Property and equipment 729,579 712,342 756,832 Investment properties 27,616 0 0 Intangible assets 109,504 141,818 130,002 Deferred tax assets 142,447 89,595 112,664 TOTAL ASSETS 16,336,170 13,737,991 15,783,655 EQUITY AND LIABILITIES Liabilities Deposits 12,900,729 10,939,638 12,209,087 Derivative financial liabilities 31,094 5,554 37,640 Creditors and accruals 178,160 287,507 295,883 Current tax liabilities 15,531 28,140 12,917 Deferred tax liabilities 21,296 9,573 21,143 Borrowed funds 6 1,753,532 1,039,565 1,759,320 Total liabilities 14,900,342 12,309,977 14,335,990 Equity Stated capital 781,025 781,025 781,025 Foreign currency translation reserve (204,093) (153,384) (143,899) Non-distributable reserves 395,441 269,090 242,196 Distributable reserves 468,221 525,686 570,235 Equity attributable to ordinary shareholders 1,440,594 1,422,417 1,449,557 Non-controlling interest (4,766) 5,597 (1,892) Total equity 1,435,828 1,428,014 1,447,665 TOTAL EQUITY AND LIABILITIES 16,336,170 13,737,991 15,783,655 Guarantees and other credit commitments 7 818,779 939,171 770,746 Consolidated statement of cash flow FOR THE SIX MONTHS PERIOD ENDED 30 JUNE 2014 BWP’000s – (Presentation currency) Unaudited 30 Jun 2014 6 months Reviewed 30 Jun 2013 6 months Audited 30 Dec 2013 12 months CASH FLOWS FROM OPERATING ACTIVITIES (193,115) (396,055) (227,584) Cash generated from operating activities 311,615 383,538 715,013 Net profit before tax 99,656 169,123 253,989 Adjusted for: Impairment of loans and advances 151,821 146,055 327,974 Depreciation and amortisation 60,539 53,669 114,175 Dividends receivable (208) (13) (5,266) Net (gains)/losses on derivative financial instruments (32) 12,238 19,085 Loss from associates – 2,826 4,004 Impairment of investment in associates – – 1,082 Profit on disposal of property and equipment (161) (360) (30) Tax paid (58,995) (61,935) (135,628) Net cash inflow from operating activities before changes in operating funds 252,620 321,603 579,385 Net decrease in operating funds (445,735) (717,658) (806,969) Increase in operating assets (1,265,318) (248,112) (1,573,392) Increase/(decrease) in operating liabilities 819,583 (469,546) 766,423 CASH FLOWS FROM INVESTING ACTIVITIES (19,701) (73,879) (126,106) Purchase of property and equipment (17,546) (34,835) (105,435) Purchase of intangible assets (2,564) (34,904) (21,738) Additions to associates – (4,849) (4,849) Dividends received 208 13 5,266 Proceeds on disposal of property and equipment 201 696 650 CASH FLOWS FROM FINANCING ACTIVITIES (11,560) (150,850) 508,680 (Decrease)/increase in borrowed funds – (132,226) 563,268 Dividend paid (11,560) (18,624) (54,588) (Decrease)/increase in cash and cash equivalents (224,376) (620,784) 154,990 Cash and cash equivalents at the beginning of the period 1,597,662 1,314,895 1,314,895 Exchange adjustment on opening balance (48,173) 103,307 127,777 Cash and cash equivalents at the end of the period 1,325,113 797,418 1,597,662 Cash and cash equivalents 1,325,113 797,418 1,597,662 Statutory reserves 937,519 681,144 706,621 Cash and short-term funds 2,262,632 1,478,562 2,304,283 Notes to the Income Statement and Balance Sheet 1. Basis of presentation 1.1 Statement of compliance This condensed consolidated financial information has been prepared in accordance with International Financial Reporting Standards (“IFRS”), and the requirements of the Botswana Companies Act (Chapter 42.01). Significant accounting policies have been applied consistently from the prior year. 1.2 Functional and presentation currency The financial statements are presented in Botswana Pula (BWP), which is the company’s functional currency and the Group’s presentation currency. Except as indicated, financial information presented in BWP has been rounded off to the nearest thousand. 2. Stated capital During the period under review there were no changes in stated capital. 3. Non-interest income BWP’000s 30 Jun 2014 6 months 30 Jun 2013 6 months 31 Dec 2013 12 months Gains on financial assets at fair value through profit or loss 13,006 80,583 84,769 Net losses on derivative financial instruments 32 (12,238) (19,085) Dividends received 208 13 5,266 Fees and commission income 246,625 186,695 415,680 Forex trading income and currency revaluation 83,518 87,595 156,215 Loss on disposal of property and equipment 161 360 30 Rental and other income 19,750 27,884 49,219 363,300 370,892 692,094 4. Operating expenditure BWP’000s 30 Jun 2014 6 months 30 Jun 2013 6 months 31 Dec 2013 12 months Administrative expenses 256,581 226,853 488,407 Property lease rentals 23,294 17,926 43,948 Staff costs 221,906 210,924 435,237 Auditors’ remuneration 5,902 6,224 8,063 Depreciation and amortisation 60,539 53,669 114,176 Directors remuneration 15,792 13,781 25,545 Impairment of investment in associate – – 1,082 584,014 529,377 1,116,458 5. Loans and advances BWP’000s 30 Jun 2014 30 Jun 2013 31 Dec 2013 Mortgage lending 401,555 308,021 349,044 Instalment finance 629,609 706,328 670,372 Corporate lending 5,099,582 5,254,548 5,381,767 Commercial and property finance 67,060 72,595 53,716 Consumer lending 5,086,130 4,011,648 4,711,160 Gross loans and advances 11,283,936 10,353,140 11,166,059 Less: impairments (708,396) (498,768) (611,360) Net loans and advances 10,575,540 9,854,372 10,554,699 5.1 Analysis of impairments Specific impairments 596,694 408,789 516,887 Portfolio impairments 111,702 89,979 94,473 708,396 498,768 611,360 5.2 Distribution of loans and advances by credit quality Neither past due nor impaired 8,446,063 8,465,460 8,652,045 Past due but not impaired 1,151,720 988,894 1,395,703 Individually impaired 1,686,153 898,786 1,118,311 Gross loans and advances 11,283,936 10,353,140 11,166,059 Less: Allowance for impairment (708,396) (498,768) (611,360) Net loans and advances 10,575,540 9,854,372 10,554,699 5.2.1 Distribution of loans and advances neither past due nor impaired Mortgage lending 359,221 287,983 279,535 Instalment finance 345,128 441,183 436,890 Corporate lending 3,376,919 3,809,080 3,639,197 Commercial and property finance 65,423 72,105 42,935 Consumer lending 4,299,373 3,855,109 4,253,488 8,446,063 8,465,460 8,652,045 5.2.2 Distribution of loans and advances past due but not impaired Mortgage lending 5,723 14,943 62,221 Instalment finance 61,643 108,869 61,028 Corporate lending 459,271 794,424 967,944 Commercial and property finance 7,351 491 10,248 Consumer lending 617,732 70,167 294,262 1,151,720 988,894 1,395,703 5.2.3 Distribution of loans and advances individually impaired Mortgage lending 8,920 5,095 7,315 Instalment finance 120,430 156,277 46,014 Corporate lending 1,256,500 651,044 901,403 Commercial and property finance 1,155 – 536 Consumer lending 299,148 86,370 163,043 1,686,153 898,786 1,118,311 6. Borrowed funds BWP’000s Convertible bond – – – Other borrowed funds 1,753,532 1,039,565 1,759,320 1,753,532 1,039,565 1,759,320 (a) Convertible bond Balance at beginning of the period – 97,950 97,950 Interest expense – 5,140 5,140 Principal repayment – (27,175) (27,175) Interest paid – (2,399) (2,399) Conversion into equity – (73,516) (73,516) – – – (b) Other borrowed funds National Development Bank of Botswana Limited 58,617 80,827 67,175 BIFM Capital Investment Fund One (Pty) Ltd 256,375 256,169 256,352 Afrexim Bank 854,269 361,732 821,765 Africa Agriculture and Trade Investment Fund S.A. 217,391 – 216,843 Norsad Finance Limited 115,311 62,825 131,738 Other 251,569 278,012 265,447 1,753,532 1,039,565 1,759,320 Consolidated income statement FOR THE SIX MONTHS PERIOD ENDED 30 JUNE 2014 USD’000s – (Convenience conversion) 30 Jun 2014 6 months 30 Jun 2013 6 months 31 Dec 2013 12 months Interest and similar income 114,269 119,850 227,988 Interest expense and similar charges (60,864) (62,372) (108,567) Net interest income before impairment of advances 53,405 57,478 119,421 Impairment losses on loans advances (17,171) (17,619) (38,766) Net interest income after impairment of advances 36,234 39,859 80,655 Non interest income 41,089 44,739 81,805 Total income 77,323 84,598 162,460 Operating expenditure (66,052) (63,857) (131,965) Net income from operations 11,271 20,741 30,495 Share of results of associates – (340) (473) Profit before tax 11,271 20,401 30,022 Tax (4,508) (4,892) (9,413) Profit for the period 6,763 15,509 20,609 Attributable to: Ordinary shareholders 7,102 17,236 23,457 Non-controlling interest (339) (1,727) (2,848) Profit for the period 6,763 15,509 20,609 Earnings per share (cents) 2.8 7.1 9.4 Diluted earnings per share (cents) 2.8 6.7 9.3 Dividend per share (cents) 1.0 1.0 2.6 Weighted average number of shares (000’s) 256,886 241,635 249,344 Consolidated balance sheet AS AT 30 JUNE 2014 USD’000s – (Convenience conversion) 30 Jun 2014 30 Jun 2013 31 Dec 2013 ASSETS Cash and short-term funds 257,261 171,735 262,688 Financial assets held for trading 209,220 100,009 143,646 Financial assets designated at fair value 29,693 29,083 29,817 Derivative financial assets 1,830 2,194 3,151 Loans and advances 1,202,439 1,144,585 1,203,236 Investment securities 7,615 7,338 7,749 Prepayments and other receivables 29,604 27,355 29,828 Current tax 3,514 2,075 3,761 Investment in associates 1,507 1,677 1,518 Property and equipment 82,953 82,739 86,279 Investment properties 3,140 0 0 Intangible assets 12,451 16,472 14,820 Deferred tax assets 16,196 10,406 12,844 TOTAL ASSETS 1,857,423 1,595,668 1,799,337 EQUITY AND LIABILITIES Liabilities Deposits 1,466,813 1,270,639 1,391,836 Derivative financial liabilities 3,535 645 4,291 Creditors and accruals 20,257 33,395 33,731 Current tax liabilities 1,766 3,268 1,473 Deferred tax liabilities 2,421 1,112 2,410 Borrowed funds 199,377 120,745 200,563 Total liabilities 1,694,169 1,429,804 1,634,304 Equity attributable to ordinary shareholders 163,796 165,214 165,249 Non-controlling interest (542) 650 (216) Total equity 163,254 165,864 165,033 TOTAL EQUITY AND LIABILITIES 1,857,423 1,595,668 1,799,337 Guarantees and other credit commitments 93,095 109,085 87,865 Consolidated statement of comprehensive income FOR THE PERIOD ENDED 30 JUNE 2014 BWP’000s – (Presentation currency) Unaudited 30 Jun 2014 Reviewed 30 Jun 2013 Audited 31 Dec 2013 Profit for the period 59,799 128,568 174,356 Other comprehensive income to be reclassified to profit or loss in subsequent periods: (60,076) 88,471 97,052 Exchange differences on translating foreign operations (58,686) 88,295 116,422 Net loss on hedge of net investment in foreign operations (1,390) – (16,343) Share of reserves in associate companies – – 551 Movement in available-for-sale reserves – 176 (3,578) Income tax relating to components of other comprehensive income – – – Other comprehensive income not to be reclassified to profit or loss in subsequent periods: – – 1,246 Revaluation of property – – 1,424 Income tax relating to components of other comprehensive income – – (178) Other comprehensive income net of tax (60,076) 88,471 98,298 Total comprehensive income for the year (277) 217,039 272,654 Total comprehensive income attributable to: Ordinary shareholders 2,597 230,482 293,586 Non-controlling interest (2,874) (13,443) (20,932) (277) 217,039 272,654 Consolidated statement of comprehensive income FOR THE PERIOD ENDED 30 JUNE 2014 USD’000s – (Convenience conversion) 30 Jun 2014 30 Jun 2013 31 Dec 2013 Profit for the period 6,763 15,509 20,609 Other comprehensive income to be reclassified to profit or loss in subsequent periods: (6,794) 10,672 11,472 Exchange differences on translating foreign operations (6,637) 10,651 13,761 Net loss on hedge of net investment in foreign operations (157) – (1,931) Share of reserves in associate companies – – 65 Movement in available-for-sale reserves – 21 (423) Income tax relating to components of other comprehensive income – – – Other comprehensive income not to be reclassified to profit or loss in subsequent periods: – – 147 Revaluation of property – – 168 Income tax relating to components of other comprehensive income – – (21) Other comprehensive income net of tax (6,794) 10,672 11,619 Total comprehensive income for the year (31) 26,181 32,228 Total comprehensive income attributable to: Ordinary shareholders 294 27,802 34,702 Non-controlling interest (325) (1,621) (2,474) (31) 26,181 32,228
- 3. ABC Holdings Limited Unaudited interim group results www.bancabc.com FOR THE SIX MONTHS ENDED 30 JUNE 2014 6. Borrowed funds continued BWP’000s 30 Jun 2014 30 Jun 2013 31 Dec 2013 (b) Other borrowed funds continued Fair value National Development Bank of Botswana Limited 58,402 81,496 67,526 BIFM Capital Investment Fund One (Pty) Ltd 294,547 295,887 308,204 Afrexim Bank 854,248 362,398 822,511 Africa Agriculture and Trade Investment Fund S.A. 238,714 – 244,919 Norsad Finance Limited 132,859 62,825 150,331 Other 251,569 278,012 265,449 1,830,339 1,080,618 1,858,940 National Development Bank of Botswana Limited (NDB) The loan from National Development Bank of Botswana is denominated in Japanese Yen and attracts interest at 3.53% per annum. Principal and interest is payable semi-annually on 15 June and 15 December. The loan matures on 15 December 2016. BIFM Capital Investment Fund One (Pty) Ltd The loan from BIFM Capital Investment Fund One (Pty) Ltd is denominated in Botswana Pula and attracts interest at 11.63% per annum, payable semi-annually. The redemption dates for the principal amount are as follows: 30 September 2017 – BWP62 500 000 30 September 2018 – BWP 62 500 000 30 September 2019 – BWP62 500 000 30 September 2020 – BWP 62 500 000 Afrexim Bank Limited The loans from Afrexim Bank Limited consist of US$60 million advanced to ABC Holdings Limited (ABCH) and US$33 million advanced to ABC Zimbabwe Limited. The US$60 million short-term credit facility was advanced to ABCH in July 2013. The loan attracts interest at 3 months LIBOR +5% and it is repayable on 31 December 2014, but with a provision to extend it for a further, mutually agreeable period. The US$60 million advanced to ABCH was designated as a hedge in the net investment by the Group in BancABC Zimbabwe. The US$33 million trade finance facility was availed to ABC Zimbabwe by Afrexim Bank Limited from December 2013 to December 2016. It attracts interest at LIBOR +4.5% and it is repayable on the earlier of when the underlying customers funded repay their respective loans or in December 2016. Africa Agriculture and Trade Investment Fund S.A. (AATIF) The loan from AATIF is denominated in US Dollars and attracts interest at 3 months LIBOR +6.25%. Interest is payable quarterly on 31 March, 30 June, 30 September and 31 December. The loan matures on 21 December 2018 when the full principal amount is due for repayment in one instalment. Norsad Finance Limited The loans from Norsad Finance Limited were advanced to ABC Holdings Limited (ABCH) as well as BancABC Zambia and BancABC Zimbabwe. The US$10 million loan advanced to ABCH is a subordinated loan denominated and attracts interest at 6 months LIBOR +7.5%. Interest is payable semi-annually on 30 June and 31 December. The loan matures on 9 October 2020 when the full principal amount is due for repayment in one instalment. The loans advanced to BancABC Zambia and BancABC Zimbabwe are also denominated in US dollars and attract interest of between 7% and 12% per annum and they mature between 2014 and 2015. Other borrowings Other borrowings relate to medium to long term funding from international financial institutions for onward lending to BancABC clients. Fair value is equivalent to carrying amounts as these borrowings have variable interest rates. BWP’000s 30 Jun 2014 30 Jun 2013 31 Dec 2013 Maturity analysis On demand to one month 528,363 437,670 535,289 One to three months 18,513 24,192 21,025 Three months to one year 312,987 110,112 78,762 Over one year 893,669 467,591 1,124,244 1,753,532 1,039,565 1,759,320 7. Contingent liabilities BWP’000s 30 Jun 2014 30 Jun 2013 31 Dec 2013 Guarantees 728,462 771,371 671,224 Letters of credit and other contingent liabilities 90,317 167,800 99,522 818,779 939,171 770,746 Maturity analysis Less than one year 640,589 915,065 578,187 Between one and five years 178,190 24,106 192,559 818,779 939,171 770,746 8. Exchange rates The exchange rate to BWP1 were as follows: Closing 30 Jun 2014 Average 30 Jun 2014 Closing 30 Jun 2013 Average 30 Jun 2013 Closing 31 Dec 2013 Average 31 Dec 2013 United States Dollar 0.114 0.113 0.116 0.121 0.114 0.118 Tanzanian Shilling 188.433 185.721 188.745 195.890 180.839 191.116 Zambian Kwacha 0.711 0.699 0.637 0.649 0.629 0.640 Mozambican Metical 3.560 3.555 3.481 3.645 3.428 3.560 South African Rand 1.207 1.210 1.162 1.131 1.203 1.154 Consolidated statements of changes in equity FOR THE PERIOD ENDED 30 JUNE 2014 BWP’000s ATTRIBUTABLE TO OWNERS OF THE PARENT Non-controlling interest Total Equity Stated capital Foreign currency translation reserve Regulatory general credit risk reserve Property revaluation reserve Available for sale reserve Statutory reserve Convertible bond Treasury shares reserve Distri-butable reserves Total Balance as at 1 January 2013 663,401 (240,812) 38,559 161,214 3,030 90,779 44,109 – 376,764 1,137,044 19,040 1,156,084 Comprehensive income: Profit for the period – – – – – – – 142,878 142,878 (14,310) 128,568 Other comprehensive income: – 87,428 – – 176 – – – – 87,604 867 88,471 Foreign currency translation differences – 87,428 – – – – – – – 87,428 867 88,295 Movement in available for sale reserves: – – – – 176 – – – – 176 – 176 – Arising in current period – – – – 176 – – – – 176 – 176 TOTAL COMPREHENSIVE INCOME – 87,428 – – 176 – – – 142,878 230,482 (13,443) 217,039 Transfers within equity Movement in general credit risk reserve – – (24,668) – – – – – 24,668 – – – Total transfers within equity – – (24,668) – – – – – 24,668 – – – Transactions with owners Dividends paid – – – – – – – – (18,624) (18,624) – (18,624) Shares issued during the period 117,624 – – – – – (44,109) – 73,515 – 73,515 Total transactions with owners 117,624 – – – – – (44,109) – (18,624) 54,891 – 54,891 Balance as at 30 June 2013 781,025 (153,384) 13,891 161,214 3,206 90,779 – – 525,686 1,422,417 5,597 1,428,014 Comprehensive income: Profit for the period – – – – – – – – 55,576 55,576 (9,788) 45,788 Other comprehensive income: – 9,485 – 869 (3,754) 551 – – 377 7,528 2,299 9,827 Foreign currency translation differences – 25,828 – – – – – – – 25,828 2,299 28,127 Net loss on hedge of net investment in foreign operations – (16,343) – – – – – – – (16,343) – (16,343) Revaluation of property net of deferred tax – – – 869 – – – – 377 1,246 – 1,246 Share of reserves in associate companies – – – – – 551 – – – 551 – 551 Movement in available for sale reserves: – – – – (3,754) – – – – (3,754) – (3,754) – Arising in current period – – – – (3,754) – – – – (3,754) – (3,754) TOTAL COMPREHENSIVE INCOME – 9,485 – 869 (3,754) 551 – – 55,953 63,104 (7,489) 55,615 Transfers within equity Movement in general credit risk reserve – – 5,186 – – – – (5,186) – – – Movement in statutory reserves – – 3,319 – – (33,065) – – 29,746 – – – Total transfers within equity – – 8,505 – – (33,065) – – 24,560 – – – Transactions with owners Dividends paid – – – – – – – – (35,964) (35,964) – (35,964) Total transactions with owners – – – – – – – – (35,964) (35,964) – (35,964) Balance as at 1 January 2014 781,025 (143,899) 22,396 162,083 (548) 58,265 – – 570,235 1,449,557 (1,892) 1,447,665 Comprehensive income: Profit for the period – – – – – – – – 62,791 62,791 (2,992) 59,799 Other comprehensive income: – (60,194) 153,245 – – – – – (153,245) (60,194) 118 (60,076) Foreign currency translation differences – (58,804) – – – – – – – (58,804) 118 (58,686) Net loss on hedge of net investment in foreign operations – (1,390) – – – – – – – (1,390) – (1,390) Movement in general credit risk reserve – 153,245 – – – – – (153,245) – – – Total comprehensive income – (60,194) 153,245 – – – – – (90,454) 2,597 (2,874) (277) Transfers within equity Movement in general credit risk reserve – – 153,245 – – – – – (153,245) – – – Total transfers within equity – – 153,245 – – – – – (153,245) – – – Transactions with owners Dividends paid – – – – – – – – (11,560) (11,560) – (11,560) Total transactions with owners – – – – – – – – (11,560) (11,560) – (11,560) Balance as at 30 June 2014 781,025 (204,093) 328,886 162,083 (548) 58,265 – – 314,976 1,440,594 (4,766) 1,435,828 Segmental Analysis FOR THE SIX MONTHS PERIOD ENDED 30 JUNE 2014 BWP’000s Total income Contribution to banking operations Attributable profit Contribution to banking operations Total assets Contribution to banking operations BancABC Botswana 197,822 27% 59,484 40% 5,229,774 33% BancABC Mozambique 88,717 12% 605 1% 2,315,597 15% BancABC Tanzania 42,970 6% (17,144) (12%) 1,099,577 7% BancABC Zambia 135,944 18% 35,378 24% 2,455,890 16% BancABC Zimbabwe 272,349 37% 68,685 47% 4,599,015 29% Banking operations 737,802 100% 147,008 100% 15,699,853 100% Head office and other non-banking operations* (54,132) (84,217) 636,317 Total 683,670 62,791 16,336,170 for the six months ended 30 June 2013: BWP’000s BancABC Botswana 216,308 31% 81,107 47% 4,851,402 38% BancABC Mozambique 80,064 12% 9,444 6% 1,507,902 12% BancABC Tanzania 58,581 8% 555 0% 926,168 7% BancABC Zambia 122,099 17% 32,892 19% 1,583,826 12% BancABC Zimbabwe 223,665 32% 48,350 28% 3,959,445 31% Banking operations 700,717 100% 172,348 100% 12,828,742 100% Head office and other non-banking operations* 609 (29,470) 909,249 Total 701,326 142,878 13,737,991 for the 12 months ended 31 December 2013: BancABC Botswana 442,489 31% 152,986 49% 4,923,453 33% BancABC Mozambique 160,302 11% 9,040 3% 2,288,680 15% BancABC Tanzania 98,075 7% (19,581) (6%) 1,064,608 7% BancABC Zambia 231,866 16% 49,889 16% 2,105,691 14% BancABC Zimbabwe 508,913 35% 117,676 38% 4,543,157 31% Banking operations 1,441,645 100% 310,010 100% 14,925,589 100% Head office and other non-banking operations* (67,194) (111,556) 858,066 Total 1,374,451 198,454 15,783,655 * Reflects non-banking operations in various geograhical sectors Directors: Howard Buttery (Chairman) (South African), Douglas T Munatsi (Chief Executive Officer) (Zimbabwean), Francis M Dzanya (COO) (Zimbabwean), Bekithemba Moyo (CFO) (Zimbabwean,) Ngoni Kudenga (Zimbabwean), Doreen Khama (Motswana), Mark M Schneiders (Dutch), Dirk Harbecke (German), Ruth Credo (British) ABC Holdings Limited (Incorporated in the Republic of Botswana) (Registration number 99/4865) Ordinary share code: ABCH ISIN: BW0000000017