
Empfohlen
Weitere ähnliche Inhalte
Was ist angesagt?
Was ist angesagt? (20)
Andere mochten auch
Andere mochten auch (16)
Ähnlich wie Biology - Chp 5 - Populations - PowerPoint
Ähnlich wie Biology - Chp 5 - Populations - PowerPoint (20)
Mehr von Mr. Walajtys
Mehr von Mr. Walajtys (20)
Kürzlich hochgeladen
Kürzlich hochgeladen (20)
Biology - Chp 5 - Populations - PowerPoint
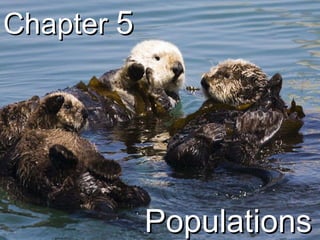
- 1. Chapter 5 Populations
- 2. Location of the ecosystem – Aleutian Islands, Alaska
- 3. Change in sea otter populations around the Aleutian Islands
- 4. WHY? With your group, discuss as many reason that you can think of that might be causing the sea otter population decline
- 6. Change in sea otter populations around the Aleutian Islands
- 9. Killer whale prey in the Aleutians
- 33. Competition
- 34. Predation
- 35. Parasitism
- 36. Disease
- 39. Unusual Weather
- 41. Seasonal Cycles
- 42. Human Activities
- 43. Human Activities
- 49. Agriculture
- 50. Industry
- 52. Shipping
- 54. Medicine
- 55. Technology
- 64. 9,078,850,714 .43 2050 8,646,671,023 .54 2040 8,127,227,506 .68 2030 7,515,218,898 .87 2020 6,812,009,338 1.06 2010 6,078,684,329 1.23 2000 5,275,407,789 1.58 1990 4,454,607,332 1.69 1980 3,708,067,105 2.07 1970 3,206,072,286 2.19 1963 3,136,556,092 2.19 1962 3,039,669,330 1.33 1960 2,555,360,972 1.47 1950 Population Average Annual Growth Rate (%) Year World Population: 1950 - 2050
Hinweis der Redaktion
- Sea otters are cute and furry.
- Initially, a dramatic decline in sea otter populations was first noted which indicated that some sort of major shift in predation as a result of a disturbance had happened. This is the kind of figures and data that a real biologist would make. How does it compare to the bar graphs you made? Is it similar? What happened? The number of sea otters in this population is on the y axis (left) and the Year is on the x axis.
- What is causing this major decline!?
- Killer whales had begun to prey upon the sea otters very heavily. But Why? Both organisms had always been in this ecosystem and this trend had not happened before.
- Killer whales prey was at one point, mainly northern sea lions, whales, and some sea otters but there’s been a shift away from sea lions to sea otters. Why? Make a hypothesis. Why did killer whales start eating sea otters at such a high rate? What might have happened in their ecosystem to cause this?
- Here’s another graph from a Biologist. What do you see? Do the different animal populations increase or decrease? Decline in whales, followed by a decline in harbor seals, followed by a decline in sea lions, and finally by a decline in sea otters. The decline in whales was due to commercial whaling that became very heavy following WW 2 and ended at the end of the 1970s. At this same time, there was also heavy commercial fishing. Because of the decreasing numbers of fish in the oceans, the harbor seals and sea lions did not have as much food as they needed. The killer whales were slowly shifting between prey as the prey became less available until they ended up eating sea otters . Sea otters have small bodies so these are not the best food for a large, killer whale. They’d much rather use their energy to kill something large bodied that would provide lots of food and energy.
- That decline in animals was happening mainly out in the ocean. Change then began to happen near shore when the killer whales began eating sea otters. IN this picture, you can see a sea otter eating a sea urchin in a kelp bed.
- When sea otters are present, they eat a huge amount of sea urchins. This is important because the sea urchins eat the kelp. You’ve seen this image before. You can see a kelp bed with otters present.
- This photo was taken at the exact same place as the photo above but this photo was taken AFTER the killer whales had eaten all of the sea otters that were present in this area. This image shows how the sea urchin populations have gotten out of control and have eaten all of the kelp. We call this sort of an area an urchin barrens.
- Here is what happened after the killer whales began focusing predation on the sea otters. Fig. 1. ( A ) Changes in sea otter abundance over time at several islands in the Aleutian archipelago and concurrent changes in Sea otters declined on four different islands. ( B ) sea urchin biomass, The number of sea urchins increased. The number of sea urchins in 1997 was MUCH larger than in the 1980’s. ( C ) grazing intensity, The amount of kelp the sea urchins ate also increased dramatically in 1997 from 1990 because there were MORE sea urchins. and ( D ) kelp density The amount of kelp decreased because the otters were gone or were fewer in number and weren’t eating as many sea urchins and the increasing number of sea urchins were eating many, many more kelp beds. measured from kelp forests at Adak Island. Error bars in (B) and (C) indicate 1 SE. The proposed mechanisms of change are portrayed in the marginal cartoons, the one on the left shows how the kelp forest ecosystem was organized before the sea otter’s decline and the one on the right shows how this ecosystem changed with the addition of killer whales as an apex predator. Heavy arrows represent strong trophic interactions; light arrows represent weak interactions.