1. CARL F. MELA, SUNIL GUPTA, and DONALD R. LEHMANN*
The authors examine the long-term effects of promotion and advertis-
ing on consumers' brand choice behavior. They use 8 1/4 years of panel
data for a frequently purchased packaged good to address two questions:
(1) Do consumers' responses to marketing mix variables, such as price,
change over a long period of time? (2) If yes, are these changes associ-
ated with changes in manufacturers' advertising and retailers' promotional
policies? Using these results, the authors draw implications for manufac-
turers' pricing, advertising, and promotion policies. The authors use a two-
stage approach, which permits them to assess the medium-term (quar-
terly) effects of advertising and promotion as weil as their long-term (i.e.,
over an infinite horizon) effects. Their results are consistent with the
hypotheses that consumers become more price and promotion sensitive
over time because of reduced advertising and increased promotions.
The Long-Term Impact of Promotion and
Advertising on Consumer Brand Choice
Trade promotions account for 50% oi lhe $70 billion bud- However, support lor value pricing strategy is not univer-
get of consumer packaged goods manufaclurcr.s (Progres- sal. There is an uncertainty in both industry and academia
sive Grocer 1995). Almost 70% of the finns have increased about the long-term impact of promotion and advertising on
their trade promotions between 1990 and 1995. Forbes brand perfonnance. Some companies such as Heinz have
(1991) also reports an increase in consumer and trade pro- emphasized their continued reliance on promotions as their
motional spending tor consumer packaged goods manufac- main marketing vehicle (Wall Street Journal 1992). Others
turers—from 50% to 75% of marketing budgets during cite such cases as that of Hi-C, which tried to switch away
1985-90. Il suggests that this increase induced a loss of from promotion in the early 1980s and lost significant share
8-15% in the share of the top three brands in categories as (Busine.'is Week 1992). The empirical evidence to date is lim-
diverse as popcorn, dishwashing detergent, cat food, barbe- ited and mixed. Although many previous studies examine
cue sauce, and prepared dishes. The article goes on (o cite the short- and long-term effects of advertising (e.g., Clarke
several marketing managers who blame couponing and pro- 1976), few focus on tiie long-term effects of promotions. As
motions for reduced brand loyalty. Business Week (1991) al- Blattberg and Neslin (1989, p. 93) note, "Almo., no rebc,
so contends that a shift of marketing dollars from advertis- has been conducted on the long term elT^ )f promotions.
ing to promotions is to be blamed for the drop in the num- Yet, it is critical to a brand's strategy." In summary, under-
ber of consumers that buy only well-known brands from standing whether promotion and advertising hurt or help a
77% in 1975 to 62% in 1990. brand in the long run appears to be relevant, important, and
In light of this, some companies now believe that promo- underresearched.
tions have made consumers more price sensitive, which con- We empirically examine the long-term effects of promo-
sequently has lowered the effective price companies can tion and advertising on consumers' brand choice decisions
charge (BrarulWeek 1993). As a result of this belief, Colgate- in mature product categories (i.e., we do not focus on
Palmolive. Ralston Purina, Quaker Oats, and Procter & changes due to die product life cycle factors). Specifically,
Gamble (P&G) recently have curtailed the frequency of we address the following two questions: (I) Does con-
their price promotions {Wall Street Journal 1996). sumers' responsiveness to marketing mix elements change
over time? For example, are consumers becoming more
price sensitive over time? Is the price-sensitive segment of
consumers growing over time? (2) If such changes as in-
•Carl F. Mela is an assi^lanl professor. College of Business Aclmiiiislra- creasing price sensitivity occur, what factors affect these
lion. University of Notre Dame. Sunil Gupia is a professor. Graduaie
School of Business, Columbia University. Donald R. Lehmann is George E. changes? For example, is the reduction in advertising ex-
Warren Professor, Graduate School of Business, Columbia University. The penditures and/or increase in promotions iatluencing con-
authors rhank Infornialion Resources. Inc. and an anonymous company for sumers' price sensitivity to the product?
providing lhe data and managerial inpiil for this sludy. and lhe edilor and
three anonymous JMK reviewers for their valuahle coin men Is. Investigation of these issues not only will enable us to
better understand the changes in consumer behavior over the
Jounml of Marketing Reseanh
Vol. XXXIV (May 1997), 248-261 248
2. The Long-Term Impact of Promotion and Advertising 249
lotig run. but also will provide useful marketing implications tivity (Comanor and Wilson 1974). The second theory states
tor manufaclurers" pricing, advertising, and promotion poli- that advertising increases competition by providing infor-
cies. To ensure consistent interpretation of long term mation to consumers that is likely to make consumers more
throughout this article, we begin by defining it. price sensitive (Nelson 1974). Mitra and Lyncb (1995) rec-
oncile tbese conilicting theories by suggesting that advertis-
What Is Long Term ? ing affects price elasticity through its inlluence on tvt'o mod-
Similar to Fader and colleagues (1992), we characterize erating constructs: Advertising can increase price elasticity
the effect of marketing actions on consumers' choice behav- by increasing tbe number of brands considered; it also can
ior as follows: decrease price elasticity by increasing the relative strength
of brand preference.
1. Short-term effects: This is the immediate (e.g., weekly) elTect
of proriiotion or advertising tin the sales or share of a brand. Kaul and Wittink (1995) provide an excellent review of
Most receni studies focus on these effeet.s. These studies gen- the studies examining tbe impact of advertising on price sen-
erally find very strong short term effect.s of promotion hut sitivity. They also suggest tbat the apparently conllicling re-
very weak or insignllleant effects of advertising on brand sults of many studies might be indicative of the ditferent as-
share (e.g., Guadagni and Little 1983; Gupta 1988; Tellis peeLs of the problem on which tbe researcbers inadvertently
1988a). focus. For example. Eskin and Baron (1977) study new
2. Medium-term effect.s: Some studies attempt to go beyond products, for whieb more advertising migbt attract addition-
week-by week effcct.s of promotions. Most of these studies al consumers who are more price sensitive, and Krishna-
use a 4- to 16 week time frame. For example, Davis. Inman. murthi and Raj (198.^) analyze a constant set of households.
and McAlister (1992) study Ihe impact of promotions on con- Researcbers seem to agree that if tbe advertising message is
sumer auiludes; Ehrenberg. Hammond, and Goodhardt (1994)
examine promotion cflects on brand shares; and Kim and non-price-oriented and brand building, then it lowers con-
Lehmann (I9').l) study changes in consumer sensitivities due sumers' price sensitivity, whereas a price-oriented message
to pro mot ions. Allhough many of these studies draw imphca- could increase consumers' price sensitivity.
tions about the long-term effects of promotions, we believe In our application, we use a product category in whicb
that effects of advertising and promotion in the following 4- five of the nine brands advertise, all using a non-price ad-
to-16 weeks qualify as medium-term rather than long-term ef- vertising message. Furtbermore, tbe price of these five
fects. Here, we define the impact of a current peritxl's adver-
brands is. in general, higher than the price of tbe remaining
tising/promotion on sales, share, or consumers' sensilivities of
the subsequent 1.1 weeks (or quarter) as the medium-term ef- four brands tbat do not advertise. According lo Boulding,
fect of advertising/promotion. Lee. and Staelin (1994). who use price as a proxy for the ad-
3. Umg-tenn effecis: Previous studies find that advertising has a
vertising message of a brand, firms charging bigher-than-av-
substantial carryover etfect. The long-term eftect of advertis- erage price bave a natural inclination to bave a non*price
ing (or prointition) is the cumulative eflect on consumers' message in their advertising. Tberefore,
brand choice behavior, lasting over several years. One ap- HJ: Non-price-oriented advertising is expected to reduce con-
proach to capture the long-term impact of advertising is the sumers' price sensitivity in the long run.
distributed lag model (e.g.. Clarke 1976). We use a similar ap-
proach here. Few studies, even those using disaggregate data, involve
4. Effects of changes in marketing strategy: P&G's move frorTi conducting analysis at tbe segment level. A notable exception
high-low pricing to everyday low pricing is a gcKxl example of is Krishnamurtbi and Raj (1985). who find that the impact of
a change in marketing strategy. An important task for market- advertising on consumers' price sensitivity is stronger for tbe
ing managers is to as.sess the impact of these strategy changes
on brand share or sales. Notice the distinction between long-
more price-sensitive (or nonloyal) segment, and this effect is
term effects and effects of a pohcy change. If a company marginal (or the less price-sensitive (or relatively loyal) seg-
changes its advertising in one period only and evaluates its cu- ment. Tbis suggests a "tloor" effect; l( tbe loyal segment is
mulative effect in future periods, it is measuring long-term ef- completely price insensitive, increased advertising will have
fects of advertising. Conversely, if the company cuts its ad- no effect on tbis segment's price sensitivity. On tbe basis of
vertising expenditure in half in all periods and .studies its ef- these findings, we expect tbe following;
fect on consumer choice, it is evaluating the effect of .strategy
change. HJ: The long-term impact of advertising on consumers' price
sensitivity is likely to be stronger for nonloyal consumers
Our focus here is to study the long-term efTects of pro- than for relatively loyal (and less price-sensitive) consumers.
inoiions and advertising on consumers' price and promotion
Although several studies address tbe issue of bow adver-
sensitivities. We proceed as follows: Wo start with a brief
tising affects price sensitivity, almost none focus on the
review of (he relevant literature and development of
effect of advertising on consumers' sensitivity to promo-
hypotheses. We then describe our modeling approach. This
tions. To understand advertising's effect on consumers' pro-
is followed by data, variables, and results sections. We dis-
motion sensitivity, we believe that promotions sbould be cat-
cuss managerial implications of these results and conclude
egorized into two groups: price-oriented and non-price-orl-
with the contributions and limitations of this study.
ented promotions.' Advertising tbat tnakes consumers less
LITERATURE REVIEW AND HYPOTHESES price sensitive also sbould make these consumers less sensi-
tive to price-oriented promotions tbat primarily focus on
Umg-Term Effects of Advertising price cues. Conversely, advertising should increase con-
Kconomists have developed iwo theories that predict sumers' response to non-price-oriented promotions that
opposite eftects of advertising on consumers' price sensitiv-
ity. The first theory suggests that advertising leads lo prod- 'We use the word promotions for all sates and irade promotions such as
uct differentiation, thereby reducing consumers' price sensi- lemporary price reductions, feature, coupon, display, and so on.
3. 250 JOURNAL OF MARKETING RESEARCH, MAY 1997
enhance the awareness and visibility of a brand without PIMS data at the business unit level to conclude that adver-
focusing on price. tising decreases and promotion increases consumers' price
setisitivity for large brands.
H3: In the long mn, advertising will reduce consumers' sensitiv-
Consumer behavior theories, empirical studies, and the
ity to price-oriented promolions.
H4: In the long run. advertising will increase consumers' sensi- previous discussion about advertising suggest that over the
tivity to non-price-oriented promotions. long run, price-oriented promotions will make consumers
H5: In general, these effects are likely to be stronger for the non- more price sensitive by focusing their attention on price
loyal segment than for the loyal segment. cues. Non-price-oriented cues therefore will become less
important to consumers. The opposite is likely to hold with
As advertising is expected lo reduce consumers' price increasing non-price-oriented promotions, which are likely
sensitivity and build loyalty, it is reasonable to expect that it to work like advertisements (consistent with the empirical
al.so will reduce the size of the nonloyal segment. generalizations of Kaul and Wittink 1995). Therefore,
Hg: Advertising will reduce the size of the nonloyal segment. H7: Over the long run, price-oriented promotions will (a) In-
Long-Term Effects of Promotion crease consumers' price sensitivity, (b) increase consumers'
sensitivity to price-oriented promotions, and (c) decrease
Several theories suggest a negative long-term effect of consumers' .sensitivity to non-price-orientcd promotions.
promotion on consumers' attitude and behavior. Self-per- HJJ: Over the long run, non-price-orientcd promotions will (a) de-
ception theory implies that consumers who buy on promo- crease consumers' price scnsitiviiy, (b) decrease consumers"
tions are likely to attrihute iheir behavior to the presence of sen.sitivity to price-oriented promotions, and (c) increase con-
promotions and not to their personal preference for the sumers" sensitivity to non-price-oriented promotions.
brand (Dodson, Tybout, and Stemthal 1978). Increased pro-
motion in a category is likely to lead to a perception that the Are results likely to be the same across the nonioyal and
key differentiating feature of hrands is the price (Sawyer and loyal segments? Some studies suggest that promotion sig-
Dickson 1983). This simplifying heuristic then can lead to nals that do not carry price information (e.g., displays) can
increased reliance on sales promotions for choosing hrands. have a dual effect. According to Inman, McAlister, and
Operant conditioning principles also suggest that frequent Hoyer (1990), these promotion signals have a positive
dealing in a category can cimdition consumers to look for impact on the choice behavior of "low need for cognition"
promotions in the future, thereby making them more pro- people. However, high-need-for-cognitlon people react to a
motion prone. promotion signal only when it is accompanied by a substan-
tive price reduction. By definition, loyal consumers are
There are some theories that predict an opposite effect of more habitual buyers and respond less to price and promo-
promotion. For example, leaming theory suggests that pro- tions. Therefore, it is reasonable to expect that, like the low
motions can help a brand through increased familiarity and need for cognition consumers examined by Inman. McAlis-
experience. However, this effect is likely to be small for ma- ter, and Hoyer (1990), loyal consumers will be less moti-
ture and stable product categories (like the one used in our vated to process non-price-oriented promotion information
study), in which consumers have been familiar with almost actively, This suggests that non-price-orientcd promotions
all of the brands for a long period of time. are likely to divert the attention of loyal consumers away
Empirical research in the ;irca of promotions typically fo- from price but in fact might make the nonloyal consumers
cuses on identifying the short-temi eltects of promotions (e.g., focus on price even more. Inman and McAlister (1993) sup-
Guadagni and Little 1983; Gupta 1988; Kamakura and Rus- port this view by suggesting that some consumers think of
sell 1989). These studies show that promotions have a large promotion signals as price-oriented promotions (prohably
short-term elTcct on consumers' brand choice. Few recent the nonloyals), whereas others think of them as a non-price
studies examine the medium-term effect {over 4-16 weeks) of promotion (probahly the loyals). Therefore,
promotion on brand share, brand evaluations, and consumers"
price setisitivity. Using data from four weeks before and four H9: Non-price-oriented promotions will decrease the price sen-
weeks after major promotions, Ehrenberg. Hammond, and sitivity of loyal consumers and increa.se the price sensitivity
Goodhitrdt (1994) conclude that consumer promotions for es- of nonloyal consumers.
tablished brands have no noticeable effect on either subse-
Consistent wilh our previous discussion, we expect price
quent sales or brand loyalty. Davis, Inman. and McAlister
promotions to reduce consumers' loyalty by making them
(1992) use a controlled experiment over three months to con-
more sensitive to price and price promotions. Therefore we
clude that promotions have no negative eflect on brand evalu-
expect these promotions to increa.se the size of" the nonloyal
ations. However, these studies do not address whether promo-
segment. However, the effect of non-price-oriented promo-
tions make consumers more sensitive to short-tenn (weekly)
tions on consumers" brand loyalty and price sensitivity is
price and promotion activities. Kim and Lehmann (1993) ex-
expected to be mixed (depending on the loyal or the non-
amine this issue using a four-month time frame and suggest
loyal segment), which makes it hard to assess their impact
that promotions do make consumers more price sensitive.
on segment sizes. Therefore,
Two studies discuss the long-term effect of advertising
and promotions. Johnson (1984) analyzes 20 product cate- H|n: Price-oriented promotions are likely to increase nonloyal
gories to examine changes in brand loyalty over the period segmeni size.
1975-83. He fmds no significant changes in a brand's share These hypotheses are summarized in Table 1.2
of requirements. However, if promotions have increased
over time, then it is difficult to say if a brand's share is high -Price scnsiliviiy i.'; generally negative, indicating ihal higher prices
because of consumer loyalty for the brand or increased reduce brand choice probahiliiy. Therefore a pttsitivc sign in ihis labie indi-
hrand promotions. Bouiding. Lee. and Staeiin (1994) use cates reduciion in price sensitivity.
4. The Long-Term Impact of Promofion and Advertising 251
Table 1
SUMMARY OF HYPOTHESES (3)
Impact on
Consumer Sensitivity to where
Nonloyal
Long Term Price Non-price Segment K^ = share of the sth .segment. 0 <'K^< .Zn^= 1 and
tmpact of Price Pmmotions Promotion.^ Size P*^^, = probability that household h in segment s buys brand i at
Advenising time t.
Price Promotions
Non-price Promotions The segment-level choice probability is a logit model:
•This effect is expected to be positive for loyal consumers and negative
(4)
for nonloyal consumers.
where Pojo^ and p^^ are segment-specific parameters esti-
MODELING APPROACH mated for each quarter q.
Although the marketing response pimimeters, [i^^, are not
We begin by briefly describing the multinomial logit
brand specific within a segment, the net effect ot the mar-
model we used to capture the impact of short-tenn (weekly)
keting activity of a hrand is a convex comhination of seg-
price and promotion activities on consumers" brand choice
ment-level response parameters. The weights in this convex
behavior. We then extend this model to a segment-level logit
combination depend on within-segment brand shares, which
model, which allows for consumer heterogeneity in
typically differ substantially across brands and segments
response parameters (Kamakura and Russell 1989), Next,
(Kamakura and Russell 1989). This approach allows for
we suggest that the slope or llrst derivative of the logit
hrand-specit'ic responses and consumer heterogeneity with-
model with respect to, for example, price is a better measure
out making the number of model parameters very large. In
of consumers' sensitivity to short-term marketing activities
our application, estimating brand-specific response parame-
than are the response parameters or elasticities. This is fol-
ters does not provide better fit or insigbts.
lowed by a discussion of the distributed lag model used to
capture changes in consumers' sensitivities over time as a When the segment-level logit parameters and segment
function of quarterly marketing activities such as advertis- sizes are estimated, we can obtain a household's posterior
ing. Finally, we discuss estimation issues. probability (Wqjj) of belonging to a segment s in quarter q by
Bayes' rule:
Modeling Consumers' Brand Choice Behavior
(5)
Single-Jiegment logit. The probability that household h
buys brand i at occasion t is captured by the multinomial
logil model (Guadagni and Little 198.^): where L^^'is, the likelihood of household h's purchase history
given that it belongs to segment s in quarter q.
(I)
A Measure of Consumers' Sensitivities to Short-Term
Marketing Activities
where the deterministic part of the utility is The segment specific parameters, (J, represent consumers'
(2) V,f = p , . response to weekly price and promotion activities of hrands.
We could use these parameters, which vary over time (quar-
The vector X^, includes short-term (weekly) marketing ters), to capture changes in consumers' sensitivities to short-
variables such as price and promotion, as well as household- term marketing activities. However, logit models pose a spe-
specific variables such as brand loyalty. The parameter p^j is cial problem because the logit parameters arc identified only
a brand-specific constant, and p is a vector of parameters for up to a scale constant (Ben-Akiva and Lerman 1985). This
variables X;',. One ot our key objectives bere is to test explic- scale constant is inversely proportional to the variance of the
itly whether consumers' sensitivities to short-term market- error in the utility function. Therefore, comparison of p
ing activities (which are a function of P parameters) change parameters across time or models is not desirable because
over time and if these changes are correlated with marketing the comparison is confounded by the error variances {Swait
activity such as advertising over the long run. Because some and Louviere 1993).
long-term marketing variables are reported (at least in our It is possible to use elasticities instead of mt)del parame-
data set) on a quarterly basis, we estimate (i for each quarter ters as measures of consumers' sensitivities to short-term
q, This is consistent with previous research (e.g., Moore and marketing variables. Unlike the elasticities in multiplicative
Winer 1987) and the managerial judgment of the company models (Krishnamurthi and Raj 198,^). the elasticities in log-
that provided us the data. (In the Estimation .section, we pro- it tiiodels are scaled by brand choice probabilities. This scal-
vide more details about the choice of a quarter as the time ing implies thai low-share brands will tend to have high
period of analysis.) elasticities, though consumers are not necessarily more re-
Multiple-segmt-nt logit. We allow lor consumer hetero- sponsive to the marketing aciions of stiiall-sharc brands
geneity in response parameters by using segment-level logit {Guadagni and Little 1983). Scaling also introduces asym-
models. Instead of specifying these segments a priori, we metry into cross-elasticities, even though there might he no
use the latent class or mixture modeling approach advocat- underiying asymmetry in consumer respon.se (Russell,
ed by Katnakura and Russcil (1989): Bucklin, and Srinivasan 1993).
5. 252 JOURNAL OF MARKETING RESEARCH, MAY 1997
We therefore use ftrst derivatives or slopes as our measure Yi(q - Dsx ~ '3St quarter*.s respon.se value, that is. lag term;
of consumers' sensitivities. The first derivative represents Zjq = vector of quarterly marketing variables, such as
change in brand share for one unit change in an independent advertising, for brand i. quarter q;
variable, such as price. In the logit model, for segment s the Cq = control variables, .such as economy, for quarter q;
first derivative of market share of brand i in quarter q with Ctjs, Xjs, Yis. 5s = parameters to be estimated; and
respect to one unit change in an independent variable Xj is Gjq^ = enor term.
given by This model has several important features. First, the
model parameters (y) represent the medium-term (quarterly)
(6) • i qsx impact of advertising and promotion on consumers' .sensi-
tivities. Second, the decay parameter {X) indicates how long
For discrete (0,1) independent variables, such as promo- the effect of advertising and promotion on consumers' sen-
sitivities last. Third, the cumulative long-term effects (over
tion, the discrete analog of the first derivative is
infinite time horizon) of marketing activities, such as adver-
tising, are captured hy 9 = y/( 1 - X). When the estimates and
(7) Y- =
the variance-covariance of y and X are obtained, the variance
of the long-term effect 6 can be estimated using Cramer's
where APj^, is the change in purchase probability due to theorem, which enables us to test for the significance of &*;
change in the Xj variable from 0 to 1 (e.g., from no promo-
2y
tion to promotion scenario). (9) Var(9) = Var(y) +
Note that there are three important features of this mea- (I - xy- (1 -
sure. First, it does not suffer from the scaling problems men-
tioned previously. Second, for a given value of P^^^, this
measure is the highest when Pj^, = .5. This is intuitively ap-
pealing because it suggests that consumers have the highest An implicit assumption of the model in Equation 8 is that
response to price and promotion when they have the highest the decay parameter X is identical for all quarterly market-
level of uncertainty of whether to choose a particular brand. ing variables such as advertising and promotion. Although
Third, even if all brands have the same ^^^^ parameters, this makes the model parsimonious, it potentially is a very
brands will have different responses to their marketing ac- restrictive assumption. In other words, if the long-term
tivities as measured hy the first derivatives. effects of advertising last for several years but the long-term
In summary, in the first stage of our model, we estimate effects of promotions last for only a few quarters, then this
segment-level logits and then compute first derivatives with assumption can lead to erroneous conclusions. Following
respect to price, price-oriented promotion, and non-price- Johnston (1984, p. 347). we test whether advertising, price
oriented promotion for each quarter of the data. promotion, and non-price promotion have different lag
structures.
Modeling the Long-Term Impact of Advertising and
Promotion Estimation
The .second stage of our model captures the impact of The model is estimated in two stages. In stage one. we
quarterly marketing variables, such as advertising, on quar- estimate the segment-level logit model by maximum likeli-
terly sensitivity {first derivative) estimates using a distrib- hood (Kamakura and Russell 1989). From this stage of the
uted lag model. These models (e.g., the Koyck model and analysis we obtain parameter estimates for each quarter. We
the partial adjustment model) have been used extensively in chose a quarter as the appropriate window or interval length
marketing to capture the carryover effects of advertising for several reasons. First, we have SV^ years of data, which
(e.g., Clarke 1976). The Koyck model, for example, makes suggests that a larger window (e.g., 1 year) will leave us
the assumption that the advertising effect has a geometric with few observations for the second stage of the analysis;
decay over time. The partial adjustment model assumes that second, because the median interpurchase time in our appli-
in the short run consumers adjust their behavior only par- cation is approximately six weeks, a shorter window (e.g., a
tially to changes in the environment. For example, frequent month) will leave us with few observations and unstable
promotions can lead consumers to expect promotions in the coefficients in the first stage of the analysis; third, infonna-
future, thereby making them more price sensitive. However, tion on some of the marketing variables (e.g., advertising) is
this shift in price sensitivity is likely to be gradual, as con- available on a quarterly basis; and fourth, the managers of
sumers slowly adjust their behavior to the new market envi-
ronment. These assumptions lead to the following modeM:
•'Var(ei = g l i t where gis ihc vetlor of first derivatives of the function g
Ihat define.s the reliilionship between 6 and y. K (i.e.. 6 = g(Y, ) = yl{ - >.)».
where and Z is the variance-eovariancc matrix for the parameter estimates y and
)L. This implies that
Yjqs^ = con.sumer response in quarter q for hrand i in
segment s, with respect to .short-term marketing
variable X, .such as price;
Var(G) =
r X)
[Cov(y.
Cov(y. A.)
Var(X)
39 rlX
'Bolh Ihc Koyck and ihc partial adjuslmeni models' formulations arc
.similar to Ettuucion 8. Hciwcvcr, in ihc Koyck mtxicl. errors are .•;erially cor-
reblcd. wherea.s these errom are independent in ihe partial adjustment
model (John.ston 1984). We tesi for error correlation in our eslimalion. Appropriate substitution then leads lo Equation 9.
6. The Long-Term Impact of Promotion and Advertising 253
[he company that provided us the data believe that most sig- dent variables (such as price and promotion) as per Equation
nificant marketing decisions are made on a quarterly basis. 6 or 7. We then use these first derivatives as dependent vari-
Our initial attempt at estimating .segment-level logit mod- ables in Equation 8. which is estimated by ordinary least
els on quarterly data indicates that even a quarter is too short squares.
a period to obtain stable parameter estimates. Given this
dilemma (i.e., a desire lo have quarterly parameter estimates DATA
so that we have enough observations for the second stage The data and managerial input for our application were
analysis, while needing a longer time interval to obtain more provided by a major consumer packaged goods company
stable parameter estimates in the first stage), we use a and Information Resources, Inc. The data contain panel,
rolling three-quarter window for estimating the segment- store, and demographic infonnation for a consumer non-
level logit. Specifically, we assume the parameter estimates durahle category in one market area for 8 ^ years, from Jan-
for data covering quarters 1, 2, and 3 to represent quarter 2. uary 1984 to March 1992. The spon.soring company also
estimates from quarters 2, 3, and 4 to represent quarter 3, provided quarterly advertising expenditures for all brands.
and so on. Although this procedure could smooth out some Because scanner data began to proliferate approximately ten
of the quarterly fluctuations in coetficients, it also will years ago, it is only now tbat researchers can use this infor-
smooth out random error. In the spirit of moving averages, mation to make long-term inferences regarding changes in
this prtKcdure captures the overall trend in coefficients in consumer behavior. Our study is one of the llrst to utilize
the 8!^ years of data. More important, it provides us with this long a period of disaggregate data.
more stable parameter estimates, which are essential for
We cannot reveal the product category or the brands. The
drawing meaningful conclusions.^
category is a household nonfood product. The median inter-
When we obtain quarterly estimates of p parameters, we purchase time is 6 weeks, and the mean is 12 weeks. The
then can compute tlrst derivatives with respeet to indepen- category has several characteristics that make it particularly
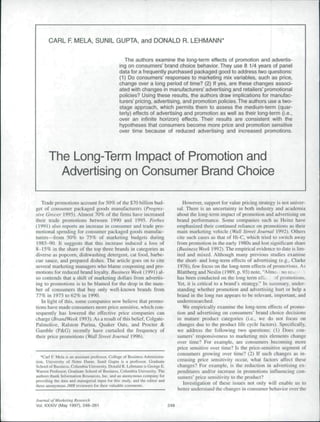
suitable for our application. First, like most other consumer
'We conducted an oilcnsive sensiliviiy unalysis fur our choice of the packaged goods, advertising in this category bas declined
"window" length of ihree quarters. Using a sub-sample of Ihc data, we over time relative to promotion (Figure 1). This enahles us
compared ihe coctTicicnls of the three quiirter window wilh the coefficients to examine the effecis of these changes, if in fact they exist.
from one-quarter and five-quancr windows. The results were not slatisti-
caliy significanlly diflerent acrt)ss thtrsc scenarios. We acknowledge that Second, this is a mature product category. Therefore, our re-
using the three-quarter window parameters could inflaie the lag parameter sults will not be confounded by changes over the product
in fy.]u;itinn 8. life cycle (Sethuraman and Tellis 1991; Tellis 1988b). Final-
Rgure 1
CHANGES IN CATEGORY MARKETING ACTIVITY
Frequency of Discounts Advertising
Percent Dollars (000)
40 500
30
200 •
10
100
0 I IIIII IIIM IIIIII I II1IIMM I 0
1984 1985 1986 1987 1988 1989 1990 1991 1992 1984 1985 1986 1987 1988 1989 1990 1991 1992
Time Time
7. 254 JOURNAL OF MARKETING RESEARCH, MAY 1997
ly, there were no major brand entries or exits during the pe- (e.g., advertising, feature) are brand oriented rather than de-
riod to complicate the analysis of advertising and promo- signed specifically for a brand size. Previous studies use
tional effects. brand, instead of brand size, for similar reasons (Krishna-
The category consists of eight major brands that account murthi and Raj 1991).
for approximately 85% of the market. We consider all other
brands, along with private-label and generic brands, to con- VARIABLES
stitute a ninth brand. There are four major sizes, and there is Short-Term (Weekly) Variables
a great deal of switching among sizes. The two medium
sizes repre.sent appro.ximately three-quarters of the market We include the following short-term variables X^, (for
share, and the largest and smallest account for approximate- household h, brand i, occasion t) in the logit model.
ly one-eighth each. There are 11 stores in this particular Price. Price for a brand is the actual shelf price in dollars
market. The panel data include l.'i90 households making per ounce, net of all discounts. The existence of multiple
54,731 product purchases over 8!^ years, that is. 33 quarters. brand sizes poses a problem for creating a price variable tor
The demographics of the panelists roughly match the demo- competing brands. We use mininwm shelf price per ounce
graphics of the United States on age, family size, education, across different sizes of a brand as the price for that brand
and children; though the panelists in our study had slightly for several reasons. First, in our data the average unit price
higher incomes. Approximately 92% of households pur- differential among the three largest brand sizes, which con-
chased more than one brand during the period of the study. stitute the bulk of purchases, is approximately 3%. Second,
Households did not enter or exit the panel during the study the average price differences across brands are far greater
period. The lack of entry or exit could raise questions of than are the average price differences across sizes of the
maturation or mortality, however, any disaggregate long-du- same brand. Third, and most important, a weigbted average
ration study will suffer from this limitation/' By having the price fonnulation is likely to underestimate the true price
same households, we are uniquely able to monitor exposure variation in the marketplace. For example, if a retailer offers
to promotions and track concurrent changes in behavior. As a 15% discount on the largest size of a brand that accounts
we mentioned previously, conflicting results about the im- for, say, one-eighth of the volume, then the weighted aver-
pact of advertising on consumers" price sensitivity can be age percent discount will be (.15 x 1/8). or less than 2%.
explained partially by whether advertising is attracting new Given size switching in this category, such averaging will
price-sensitive consumers {Eskin and Baron 1977) or reduc- understate price effects. Fourth, consumers swiich heavily
ing the price sensitivity of existing consumers (Krishna- among sizes, which suggests that minimum price per ounce
murthi and Raj 1985). By having a fixed set of households, more accurately reflects their price search behavior
we avoid this potential confounding. Table 2 provides some Price promotions. We classify three types of promotions
descriptive statistics of the data. as price promotions: (!) temporary price reduction (TPR),
(2) feature, and (3) coupon. Temporary price reduction and
Although most brands in our product category have four
coupons always are accompanied by price di.scounts and are
sizes, our unit of analysis is a brand, not brand size. This
therefore clearly price-promotion signals to consumers. Fea-
cboice was made for tbe following reasons: First, with nine
tures almost always are accompanied by prominent pricing
brands and four sizes, even a single-segment logit model
information with Mttle product information.
will have a large number of parameters. This problem in-
creases dramatically in a multi-segment logit tnndel. Sec- We define a brand to be on feature or TPR, or as offering
ond, a model witb 36 br:ind-size combinations is likely to vi- a coupon if any size of that brand is on feature or TPR or of-
olate the UA property of the logit model. Third, manage- fering a coupon. Although the data provide infonnation
ment believes that most marketing actions in this category about coupon redcmpti<m. there is no infonnation about tbe
recency of coupon drop. Therefore, we assume a coupon
drop for a brand occurred in a week if the total number of
^tn the spirit of cohort analysis, we checked our data to sec il" the per-
centage of purchases on discounl or brand switching for three dilfcrcnt age redemptions for that brand by all households in the panel da-
groups of panelists dilTered over time. We found no sigaificant dillerences. ta exceed one standard deviation higher than the average
Table 2
DESCRIPTIVE STATISTICS OF THE DATA
Market Price Advertising
Share (S/oumes) ($000) TFR' Feature [hsptuv Coupon
Brand 1984 199} }9!i4 }99} }984 /yy/ I }99} t984 }99} }984 }99I }984 }99I
1 .38 .38 .057 .060 393 128 .27 .55 .04 .09 .08 .19 .07 .10
2 .07 .10 .054 .059 142 30 .12 .40 .07 .03 .05 .14 .12 .04
3 .19 .13 .057 .063 225 57 .12 .43 .01 .04 .00 .12 .14 .04
4 .04 .10 .052 .056 144 0 .10 .54 .01 .04 .04 .19 .00 .04
5 .08 .07 .057 .062 278 44 .08 .42 .00 .05 .02 .15 .05 .15
6 .09 .06 .049 049 0 0 .03 .15 .00 .01 .02 .05 .14 .04
7 .04 .03 .029 .0.34 0 0 .04 .08 .00 .01 .00 .02 .25 .06
8 .00 .04 .061 .054 0 0 .08 .28 .00 .02 .00 .05 ,00 .42
9 .11 .10 .024 .030 0 0 .18 .21 .01 .01 .02 .06 .06 .04
'TPR (temporary price reduction). Feature. Display, and Coupon variabtes rcpresetit ttie proponioti of times the category was discounted, featured, dis-
played, or couponed in that year. i
8. The Long-Term Impact of Promotion and Advertising 255
weekly redemption for that hrand across the entire period of which we use quarterly marketing variables to explain
the study. In other words, a significant increase in coupon changes in consumers' sensitivities. These results provide a
redemption is assumed to be an indicator of a recent coupon test of our hypotheses.
drop.
Non-price promotions. We classify display as the non- Stage One: Estimating Segment-Level Logit Models
price promotion variable. Typically price is not the dominant Choosing the number of .segments. For each time period,
focus of displays. Similar to features and TPR, we define we calibrated the single-segment choice model and then
display as a binary (0.1) variable that is 1 if any size of the proceeded to fit multi-segment models for two and three
brand is on display. 0 otherwise. segments.** We used the Bayesian Infonnation Criterion
Brand loyalty. To contrt)l for observed differences in (BIC) and segment interpretability as guidelines to select the
households' purchasing patterns, we include a brand loyalty appropriate number of segments (Bucklin and Gupta 1992).
variable (e.g.. Guadagni and Little 1983). A household's For all time periods, the BIC values favored a two-segment
loyalty for a brand is defined as that brand's share in the last solution over a single-segment solution. Three-segment
four purchases of that household (on average four ptirchas- solutions were occasionally better, and ofien worse, than the
es represent one year of purchase history in this category). two-scgmont solutions. Across time periods, the average and
Previous studies use similar or even fewer purchases to as- maximum gain in BIC in going from two to three segments
sess brand loyalty (e.g.. Chiang 1991 used four weeks of were .30 and 23, respectively. Even the maximutn gain in
coffee purcha.ses). Our tneasure enables a household's loy- going from a two-segment to a three-segment solution rep-
alty for a brand to cbange over time, tbat is, we do not as- resented a percentage gain oi' only .5% in the BIC for that
sume that hrand loyalty for a household remains constant period, at the expense of 15 additional parameters. Because
over eight years.'' a constant number of segments over time facilitates inter-
pretation (Moore and Winer 1987). we chose a two-segment
Quarterly Variahles solution for all titne periods.
Quarterly variahles (Z,^) for each brand i and quarter q are The two segments appeared to be relatively loyal and non-
ope rationalized as follows: loyal segments, which is consistent with the conceptualiza-
Advertising. Advertising is the total advertising expendi- tion of Krishnamurthi and Raj (1991), Bucklin and Gupta
ture (in intlation adjusted dollars) for brand i in quarter q in (1992). and others.
the market area.** Average sensitivities of consumers across all time periods
Price promotions. Once again, tbe intensity of price pro- were as follows:
motion by a brand in a quarter is captured by tbree types of
Consumer Nonloya}
promotions: (I) TPR, (2) feature, and (3) coupon. Specifi- Sensiiiviiv lo Segment
cally, we define tbe feature activity for brand i in quarter q
(Fn,) as the proportion of times brand i is on feature across Price .28 -1.70
Price promotion .02 .04
all stores and all weeks of that quarter. Similarly, we define Non-price promotion .03 .09
frequency of price discount.s as the proportion of times a
brand is on TPR in a quarter Finally, coupon intensity for These results show ihal, as expected, consumers in the
brand i in quarter q is defined as the proportion of times that nonloyal .segment are more price and promotion sensitive
brund uses C[)upons in that quarter. Quarterly price promo- than are consumers in the loyal segment. The price sensitiv-
tion is defined as a sitnple average of quarterly feature, TPR, ity (or slope) estimates are equivalent to price elasticities of
and couponing activity of a brand. -.51 for the loyal segment and -1.02 for the nonloyal seg-
Non-price promotions. Our non-price promotion variable ment. These estimates are somewhat lower than the average
is the proportion of times a brand is on display across all of-1.76 reported by Tellis (1988b), who used a meta-analy-
stores and all weeks of that quarter, operationalized similar sis of several product categories.
to the long-term feature variable. Consumers' .sensitivities over time. Over the 29 quarters
RESULTS of the calibration period, in addition to segment size and
brand-specific constants, we estimated 348 response para-
We first present the results of the first stage analysis, in meters in the first stage of our analysis.'" Of these. 316 co-
which we calibrate segment-level logit models to obtain efficients were significant and correctly signed (e.g., the
quarterly parameter estimates and consumers' sensitivities. price parameter was negative, as expected), 8 were signifi-
Next, we discuss results from the second stage analysis, in cant and incorrectly signed, and 53 were insignificant. No-
tice that under the null hypothesis of zero paratneter value,
'Results were insensitive to slightly different operauona!i/;atiiins of using a 5% significance level would yield 348 x .05 = 17 co-
lirand loyally. Also, respi.tn.se parameters in the first stage were .similar for
models with or without tlie hrand loyalty variable.
"Because [i parameters are esiimated for a quarter, it could be unreason- also compared a single segment mixlel with brand specific parame-
able tosuj^gest that adverti.sing tor the f/tdrf current quarter (including cnd- ters for price, promotion, and so on with a .single segment model in which
itf-quiirter advertising) affects consumers' sensitiviiies for that quarter the parameters for short.term marketing variables were constrained to be
(which include consumer response al the beginning of the quarter as well). the same across brands. LIsing Bayesian Informaiion Critcrmn (which
Therefore, the quarterly advertising variable was created by phase-.s}iifiinf; penali/.es a model for estimating additional parameters), a model with the
advertising by half a quarter. In other words, for the current quarter of .same parameters for brands performed hctier than did a nunlcl with brand-
April-June, advenising was detmed as half the advertising expenditure for specific parameters. Moreover, this constrained mi.>del was found to tx;
April-June plus half the advonising expenditure for January-March. We more stable over time.
also delined the lag terms accordingly. Once again, this adjustment did not '"For each quarter we estimated 12 response parameters: 6 parameters
affect Ihe empirical results. We obtained similar results for other quarterly for each of the two segments. Therefore for the 29 quarters, we get 6 x 2 x
variables. 29 = 348 coeftkieius.
9. 256 JOURNAL OF MARKETING RESEARCH, MAY 1997
etTicients as significant, by chance. In other words, it is pos- Table 3
sible to obtain approximately 8 coefficients as significant CHANGE IN CONSUMERS' SENSITIVITIES OVER TIME
and correctly signed, and 8 coefficients as significant and in-
correctly signed, by chance. Consumers' Chaniies Significance
Next, we used these estimates of parameters and segment Sensitivity to Over Time Level
sizes and Equations 6 and 7 to compute consumer sensitivi- 1. Loyal Segmenl
ties to price, price promotion, and non-price promotion for Price Increase P<.001
each quarter q." We perfonned a simple trend analysis for Price [*romolion Increase p<.00!
each brand and segment by regressing quarterly sensitivities Non-price Promotion Decrease p<.05
against time. To control for exogenous macroeconomic fac-
2. Nonioyal Segmenl
tors, we used recession (0,1) as a covariate because con- Price Increase p<.00
sumers couid become more price sensitive during a recession Price Promolion Increase p<.00
period. Consistent with the economics literature, we define a Non-price Promolion Decrease p<.05
quarter to be in recession if it was a period of three or more
consecutive quarters with negative growth in gross domestic Nonloyal Segmenl Size Increase p<.05
product. Two interesting results emerged from this analysis.
First, consumers in the nonloyal segment became more price
sensitive over time. whcrea.s loyal consumers showed little changing over time?"—is a resounding yes.'2 Of special in-
change in their price behavior. Second, the nonloyal con- terest is the result that price and price promotion sensitivi-
sumers also demonstrated increasing sensitivity to price pro- ties are increasing over time. Our findings have important
motions and reduced sensitivity to non-price promotions, implications for managers and researchers who attempt to
though these effects were weaker than were the effects for draw empirical generalizations using meta-analysis or to
price. The promotion effects for the loyal consumers were in compare the results of two or more studies conducted over
the same direction as for the nonloyal consumers, though the different time periods. For example, Tellis (1988b) and
brand-level coefficients were not significant. Sethuraman and Tellis (1991) find average price elasticity to
We also conducted a trend analysis for the nonloyal seg- be around -1.7. However, our results suggest that these av-
ment size (Ti) with ln(Ti/l - 7i) as the dependent variable, and erages are likely to change over time. We next examine ihe
trend and recession as the independent variables. This re- reasons for these changes.
gression showed a significant increase in the size of ihe non-
loyal segmenl over time, which indicates that an increasing Stage Two: Impact of Marketing Activity cm Consumers'
proportion of consumers have become more price and pro- Sensitivities
motion sensitive over time. The puqxise of the second stage analysis is to test explic-
Pooling across brands. It is possible that consumer sensi- itly if advertising and promotion aftect consumers' price and
tivities for most brands could show a positive but insignifi- promotion sensitivities over the long run. We used the dis-
cant trend. However, if we conclude from these results that tributed lag model described in Equation 8. in which con-
consumer sensitivities are not changing over time, we may sumers" sensilivities (i.e.. first derivatives) to weekly price,
be making a Type II error by not appropriately pooling in- price promotion, and non-price promotion activities for each
formation across brands (Dutka 1984). Pooling results brand and segment were the dependent variables, and qutU"-
across brands also can be thought of as a "meta-analysis" teriy advertising, price promotion, and non-price promolion
across several brands. of that brand were the independent variitblcs along with the
One possibility is to run u c«/egory-level regression, lagged dependent variable. We also included recession as an
which gives us a single-trend parameter for the category independent variable to control for exogenous macroeco-
rather than separate trend parameters for the nine brands. Al- nomic factors. We first ran Durbin's test to check for serial
though this approach increases the sample size and pools ihe correlation of errors in a distributed lag model (Johnston
information across brands, it also could lead to erroneous re- 1984, p. 318). Out of 54 regressions (2 segments x 3 depen-
sults if the parameters for brands arc so far apart that pool- dent variables x 9 brands). 47 regressions had no correlation
ing across brands increases the variance of the category-lev- in the errors. Therefore, our formulation seems to be con.sis-
el parameter, making it insignificiint. Treating ihe results tcnt with the partial adjustment model. Next, we performed
from different brands as independent replications, we use a test as per Johnston (1984. p. 347) to see if the decay para-
Fisher's pooling test (Fisher 1948; Rosenthal 1978). Pooled meter k is different for advertising, price promotion, and
results that arc based on this test arc summarized in Table 3. non-price promotion. For all nine brands, we could not
These results suggest that the answer to our first ques- reject the null hypothesis that all of the decay parameters are
tion—"Are consumers' sensitivities to marketing variables the same.
''To contlrm furlhcr whether the long-term series of consumers' sensi-
tivities to price and promotion is evolving, for ail nine hrands we performed
the unit roiit test suggested by Dekimpe and Huns.scns (1995a). We found
strong evidence of evolving sensitivities in ihe nonloyal segment and some-
' 'Tt) ohioin consumers" sensitivity lo price pn>moUon. we used a simple what weaker evidence for the loyal segment, We also fnund the advertising
average of eonsumers' sensilivity lo TPR. feature, and coupoos. Results and promotion variables lo have unit roots. We thank Marnik DeKimpe for
were not sensitive to difTerenI weighting schemes. making the necessary program available for this test.
10. The Long-Term Impact of Promotion and Advertising 257
Using this brand- and segment-specific regression, we es- of this effect is on the nonloyal consumers.'^ Ftirthermore, we
timated the Y parameters associated with each of the quar- find that less advenising helps to increase the size of the non-
terly variahles (see Equation 8). These parameters rellect the loyal segment. This dual effect (i.e., a redtiction in advertising
quarterly (medium-tomi) effect of advertising and promo- leading to an iticrease in the size of the nonloyal segment and
making consumers more price sensitive) shows a poweriul
tion on consumers' response sensitivities. Results from these
role of advertising in reinforcing consumer preferences lor
hrand-speciHc regressions were pooled according to Fish- brands. Table 4 also shows that reduction (increa.se) in adver-
er's method. We estimated the long-temi impact o( advertis- tising reduces (increases) consumers' sensilivity to non-price
ing and promotion on consumers' sensitivities [9 = Y''(' ~ ^)l promotion for the nonloyal consumers. In other words, adver-
and its variance for each brand and segment. We then pooled tising makes non-price promotions such as displays more ef-
brand-level results using Fisher's method. fective. Moreover, our results indicate that if u market has a
large "loyal" segment, then using an unsegmented model ean
Finally, we also regressed the size of the nonloyal seg- lead to insignificant and/or substantially smaller advertising
ment (jc) against quarterly marketing variables. Specifically, effeets. This might explain partially the inability of many re-
we used log(7i/l- K) for each quarter as the dependent vari- searchers to fmd any advertising effects iti scanner data.
able and quarterly advertising, price promotion, non-price
promotion, and recession as independent variables along 2. Price pnmwtions. As expected, in the long aiti price promo-
with the lagged dependent variable. Because the segment tions make consumers more price .scnsilive in both the loyal
and nonloyal segments. They also train nonloyal consumers to
sizes were not brand specific, we used the mean category look for promotions, thereby making them more sensitive to
level variables (e.g., average category advertising) as our in- price promotions.
dependent variables. The purpose of this regression was to 3. Non-iyrireptimiotinns. Non-price promotions have signitlcant
see if. for example, decreased advertising expenditure made effects only on consumers' priee sensitivities. Consistent with
consumers less brand loyal. our hypotheses, these promotions make loyal consumers less
price sensitive and make the nonloyal consumers much more
The Long-Term Effects of Advertising and Promotions price sensitive. These results are consistent with prior litera-
ture that suggests opposite effects of certain promotions for
Results of both the medium-term (over one quarter) and different consumers.
long-tcnn (over infinite horizon) impact of advertising and
promotion on consumers" price and promotion sensitivities Several additional insights emerge from our analy.ses.
are given in Table 4. To facilitate comparison and discus- First, the results are identical for the medium term and kmg-
sion, we have also included the hypothesized signs for these term effects of advertising and promotion (except for the
effects. Overall, we found support for many of our hypothe-
ses. Although some of the results were insignificant, none I 'Although our data show advenising expenditures to be declining over
were signillcant in the wrong direction. lime, we ex[K.vt iiur results lo be bidirectional (i.e., we expect an
increasc/dccrcjse in advenising expenditure to rcduce/incrcasf consumers'
. Advertising. Consi.stenl with several previous studies (e.g., price sensiiiviiy). Also, when the price parameter (which i.s negative) is
Krishnamurthi and Raj l')85). we tlnd that a reduction in ad- used as a dependent variable, a positive coefficient for advertising implies
vertising make.s con.sumers more price sensitive and that most that advertising reduces price sensitivity.
Table 4
HYPOTHESES AND RESULTS
I. Hvpothi'sized Signs
Loyal Segment Nonloyal Segment
Impact on ("onsumer Sensitivity lo Impact on Consumer Sensitivity to
Ntmhyal
taring-Term Price Non-price Lfmi; Term Price Non-price Segment
Impact of Price Promotions Promotions Impact of Price Promotions Promotions Size
Adveni.sing
Price Promotions
Non-pdco Promotions •«-
I +
-
+
Advenising
Price Promotions
Non price Promotions : I *
2. Results for Medium-Term Effects
Advenising ns ns ns Advenising
Price Promotions ns ns Price Promotions ns ns
Non price Promotions ns ns Non price Promotions ns ns HS
i. Results for Long-Term Effects
Adveriisini: ns ns ns Advenising + ns 4-
Price Promotions ns as Price Promotions •t- ns ns
Non price Promotions ns ns Non-price Promotions ns ns ns
Note: Price sensitivity is generully negative. Therefore, a positive sign (e.g.. ad-price) indicates a decrease in price sensitivity. Significance is based on
pooled Fisher test wilh p < .05.
11. 258 JOURNAL OF MARKETING RESEARCH. MAY 1997
Table 5
AVERAGE EFFECT OF ADVERTISING AND PROMOTION ON CONSUMERS* SENSITIVITIES
REGRESSION RESULTS FROM SECOND-STAGE ANALYSIS'
iMyat Segment Nnnloyal Segment
Price- Non-price- Price- Non-price- Nontoval
Price Promotion Promotion Price Promotion Promotion Segmeni
Impact of Sensitivity Sen.silivity Sensitivity Sensitivity Sensitivity Sensitivity Size
Ug(>.) .384* .461* .410* .516* .285* .389* .639*
Advertising .0007 .000 .000 .008* .000 .0003* -.0001*
Price Promotion -.374* -.023 -.006 -1.2O7* .080* .Oil .059
Non-price Promotion .349* .041 .011 -4.368* .020 -.029 -.047
Recession -.106" -.003 -.012* -.015 .005 -.001 -.001
R^ .29 .32 .39 .56 .35 .27 .74
'Numbers in ihis table are weighted averages of Ihe parameters from brand-level regressions, where weights are proponional lo inverse of Ihe parameter
variances (R- is a simple, nol weighied average across brands). Therefore, they represent medium-term effects of advertising and promotion on consumers'
sensitivities. Parameters with p < .05 based on pooled Fisher test are repre.sented by an a.sterisk.
"effect size," which we discuss subsequently). Second, the size in the medium term for each of the two segments.'
average R- for the second stage analy.sis is .37 (R- = .26). long-temi effect size is then simply the medium-term effect
The model fit j s slightly poorer for the loyal segment (aver- size divided by (I - ), where is the decay parameter.
age R- = .34. Rl= .21) than tor the nonioyal segment (aver- We give the effect sizes in Table 6. Three key results
age R2 = .39, R2 = .30). This is an intuitively appealing emerge from this table: First, consistent with previous re-
result, which suggests that long-term marketing variables search, advertising effects are generally smaller than pro-
can explain better the changes in the behavior of nonloyal motion effects; second, long-term effect sizes are approxi-
consumers, who by definition are affected by marketing mately 1.5 to 2 times larger than medium-term effect sizes;
variables more than are loyal consumers. This is also and third, the changes in price sensitivities are greater than
reflected in more significant signs for the nonloyal segment the changes in promotion sensitivities.
than for the loyal segment. Third, the decay parameter X
varies from .29 to .52 with an average of .41 (see Table 5). Summary of Results
This indicates that on average the long-term effects of adver- In summary, our results suggest lhe following:
tising and promotion are 1/(1 - .41). or 1.7, times their
medium-term (quarterly) effects. The decay parameter also •Advertising helps a brand in the long run by making con.sumers
suggests that 90% of tbe cumulative effect of advertising (especially nonloya! ones) less price sensitive as well as by re-
and promotion on consumers' sensitivities occurs within ducing the size of the nonloyal segment.
"In the long run. price promotions make both loyal and nonloy-
three quarters, which is similar to the result obtained by
al consumers more sensitive to price. An increa.sed use of such
Clarke (1976). Finally, though recession bad no impact on promotions also trains consumers (especially nonloyai ones) to
consumers' sen.sitivities in the nonloyal segment, it look for deals in the marketplace. On average, we find these ef-
increased consumers' price sensitivity and reduced tbeir fects to be almost four times larger for nonloyal consumers tban
non-price promotion sensitivity in the loyal segmeni. for relatively loyal consumers.
•As expected, we found thai non price promotions have difFerent
How Large Are the Lang-Term Effects of Advertising and effects for loyal and nonloya! consumers. Although these pro-
Promotions? motions act like advertising for loyal consumers, making ihcm
less price sensitive, tbey make the nonloyal consumers focus
Our previous discussion indicates the directional effects even more on prices. In other words, these promotion.s reduce the
of advertising and promotions. It is also useful to assess the price sensitivity of loyal consumers but significantly increa-se the
magnitude of these effects. We estimated the medium- and price sensitivity of nonloyal consumers. The effects lor nonloy-
long-term effect sizes as follows. als are almost 12 times larger tban the effects for loyals.
To estimate the medium-term impact, 7. we note from To the extent that increased price and promotion sensitiv-
Equation 8 that the parameter y = dY/3Z represents the ity of consumers can be considered undesirable outcomes,
change in consumers' sensitivity (Y) for one unit change in our results confirm the conventional wisdom that in the long
the quarterly variable Z. Tberefore, (y/Y) x 100 is the per- run, advertising has "good' effects and promotions have
cent change in consumers' sensitivity for one unit change in "bad" effects on consumers' brand choice behavior. Note,
We use the average Y and Z values to arrive at the effect however, that these results are ba.sed on the analysis of only
one category in one market.
'^Striclly speaking, we should evaliiale changes in Y for each brand, seg-
f),Share Price ment, and quarier. However, our "aggregale" approach should provide us
.,, Price . .
HBeeausc price elasiieity ri = - Y It IS easy to with a good approximation. For example, in the conlexl ol' di.screte choice
e Share Share models, Ben-Akiva and Lerman (19K5) indicate that errors due to aggrega-
show thai under certain conditions. X 100 also represents percent tion across consuniers are relatively small if all consumers have the same
change in x for one unit change in Z. choice set.
12. The Long-Term Impact of Promotion and Advertising 259
{.•isues of Causality b) for the following reasons. Increasing promotion and re-
This study is correlational in nature. It is possible that duced advertising makes consumers more price and promo-
changes in consumer behavior bave led to changes in mar- tion sensitive. This leads finns to offer even more price pro-
keting activity rather than changes in marketing activity lead- motions to obtain short-term gains. However, all finns en-
ing to changes in bcbavior. We empirically tested for causal- gage in this action. This form of competitive action bas two
effects; First, it makes tbe overall promotional intensity in
ity by running a simultaneous equation model as follows;
tbe category higher, thereby making consumers even more
Price sensitivity = f(Lag price sensitivity. Ad. PP. NPP, Recession) price sensitive over time (as we find); and second, competi-
PP sensitivity = f(Lag PP sen.sitivity. Ad. PP. NPP. Recession) tive matching of promotional spending leaves tbe relative
NPP sensitivity = f(Lag NPP sensitiviiy. Ad. PP. NPP. Recession) promotion across firms to be largely the same, thereby bav-
Ad=f(Lag Ad of brand. Competitive Ad. Price ing little effect on tbeir market share. In other words, it is
sensitivity. PP sensitivity, NPP sensitivity) conceivable tbat though consumers are becoming more price
PP=f(Lag PP of brand. Competitive PP. Price sensitive because of increased promotional activities of var-
.sensitivity. PP sensitivity. NPP sensitivity) ious fimis. "tbe offsetting competitive activity plays a role in
NPP = f{Lag NPP of brand. Competitive NPP, Priee the maintenance of what appears to be stationary and zero
sensitivity, PP sensitivity. NPP sensitivity), order behavior" (Bass et al. 1984, p. 284). leading to sta-
tionary market shares. This highlights tbe importance of
where PP is price promotion and NPP is non-price promo-
studying tbe long-term effects of promotion and advertising
tion. The first three equations represent our second-stage
on not only tbe changes in market share or sales, but also on
analysis and the last tbree equations capture the reverse
changes in consumer behavior.
causality (i.e., the effect of changes in consumers' sensitivi-
ties on marketing activities). We estimated tbese equations
at a brand and segment level using two-stage least squares. CONCLUSION
We then pooled the results across brands using Fisher's pro-
Our purpose was to develop and empirically test a model
cedure, as indicated previously.
to understand tbe long-temi impact of advertisitig and pro-
Of the seven significant results obtained in Table 4. four motion on consumers' brand choice behavior. Specifically,
sbow causality only in the proposed direction alp < .03. and we set out to find if consumers' responsiveness to marketing
tbree show bidirectional effects (and two of them have p- mix variables cbanges over time and, if so. why. To address
values tbat are almost ten times smaller in tbe proposed di- these issues we used a unique data .set that includes store
rection tban in the reverse direction). Although these results environment and purchase history of more than 1500 buuse-
do not rule out reverse causality completely, they do lend hold for 8'4 years for one frequently purchased consumer
support for the proposed causal effects. packaged good in one market.
At least in our data set, consumers have become more
Competitive Reaction
price and promotion sensitive over time. We found two seg-
Recent articles by Lai and Padmanabban (1995) and ments of consumers—^loyal. or relatively less price-sensitive
l^cKimpe and Hans.sens (1995a. b) suggest tbat market consumers, and nonloyal, or price-sensitive consumers. Our
shares arc stationary (i.e.. not evolving over the long run) for results show that the size of the nonloyal segment has grown
a majority of product categories. Lai and Padmanabban over time. In otber words, a larger number of consumers
(1995) also llnd the long-term effect of promotions on mar- have become increasingly more price and promotion sensi-
ket shares to be largely insignificant. tive over time.
In contrast, we find long-term effects of advertising and We used quarterly advertising and promotion policies of
promotions on consumers' sensitivities to price and promo- brands to help explain tbese changes in consumer behavior.
tions, not on tbe market shares of various brands. We con- Our results confirm the conventiotial wisdom tbat in tbe long
jecture that our findings are consistent with those of Lai and run. advertising reduces consumers' price sensitivity and
Padmanabhan (1995) and DeKimpe and Hanssens (1995a, promotions increase consumers" price and promotion sensi-
Table 6
MEDIUM- AND LONG-TERM EFFECTS OF ADVERTISING AND PROMOTION ON CONSUMERS' SENSITIVITIES'
Loyal Segment Nonloyal Segment
% Change in Consumers ' Sen.titivily to % Change in Consumer.' Sensitivity to
s
Price Non price Price Non-price
1% Increase in Price Promotion Promotion Price Promotion Promotion
Mvdium-Term Effects
Advertising ns ns ns .15 ns .10
Price Promotion -.37 ns ns -1.20 .08
Non-price ProintMion .35 ns ns ^.37 ns
UmgTenn Effects
Advertising ns us BS .30 .15
Price ProiiTolion -.61 HS ns -2.50 .It
Non-price Promotion .57 ns ns -9.02 ns ns
'We focus on only significant effects {p < .05). Note that negative numbers for price imply increase in price sensitivity.