1. The New High School at Audenried
School-Wide Approach to Data Analysis and Student Voice/Student Ownership
Purpose:
In order to use data effectively to improve student achievement, we must have a
clear understanding of the many different aspects of collecting and using data not
only to drive instruction but also to inspire students as well. We must be able to
collect data, look at it critically and reflectively, and determine how to use it to
identify strengths and weaknesses, plot progress, plan and execute instructional
practices, and to hold ourselves and our students accountable for our own
achievement levels. With data driven decisions we are able to accurately point out
problems, identify students needing intervention, and find solutions. This process
also enables us to make decisions throughout the year to continually improve the
academic success of our students. There are 3 steps in this process at Audenried
High School:
Step 1: Accessing Your Benchmark Data
Step 2: Analyzing Data to Inform Instruction
Step 3: Student Voice/Student Ownership
You and your students will complete this process after each Benchmark cycle.
Step 1:
Accessing Your Benchmark Data
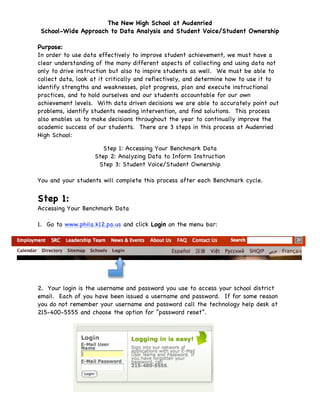
1. Go to www.phila.k12.pa.us and click Login on the menu bar:
2. Your login is the username and password you use to access your school district
email. Each of you have been issued a username and password. If for some reason
you do not remember your username and password call the technology help desk at
215-400-5555 and choose the option for “password reset”.
2. 3. After you log in you will be directed to your applications menu. Find the
Instructional Management System/SchoolNet application and click on Launch.
4. From the tabs at the top of the page, choose “Align”.
5. You will be brought to the Classroom Profile page. If it is not already chosen
for you, you will choose your name from the drop down menu next to “Teacher”.
The sections you teach will be listed under your name. Select one of your tested
subjects and then click on “Analyze this Section” next to “Performance”.
3. 6. Next, you will click on the “Item Analysis” tab. Make sure you choose the
correct test occurrence before proceeding:
7. If you scroll down, you will see your Section-Wide summary and the Student-by-
Student data. For easier viewing and printing capabilities, you will be creating a PDF
file of this data by clicking on the “Create PDF” option at the top, right-hand side
of the page. This will create a neat and concise file of your data. Save this file to
your computer and print it, as you will be using this information individually and in
your classrooms with your students.
4. Example of PDF output:
8. Due to system restrictions, you will have to print data for students receiving
special education support in your classroom separately. Therefore, for each section
you print, you will also have to print the data for the special education teacher you
work with as well. First, identify your section number. The section number of the
specific class you are looking at is the 2-digit number that is in parentheses next to
your name under “Course/Section”. In this example the section number is 11.
5. 9. Next, you will go to the pull down menu of teachers and choose your
corresponding special education teacher’s name:
10. Once you have selected their name, the Course/Section field will say “All
Courses”. Pull down on the “All Courses” menu and choose the section that matches
your section. In this case, the section was “11” so you would choose Algebra 1- (11)
6. 11. Again, be sure to choose the correct test occurrence, create the PDF, print, and
attach it to the data for the corresponding section.
12. You can stay on the “Analyze Sections” page to continue gathering data for
each of your classes. Just continue to use the pull downs on this screen to choose
your name, your course, the test occurrence and then your special education
teacher’s name and corresponding course and test occurence. Create and print
PDF’s for each of your sections.
7. Step 2:
Analyzing Data to Inform Instruction
(Left Blank for now……)
This will be protocols and “teacher voice” – like doing the same thing on a teacher
level that the kids will do on an individual level.
Scroll Down for step 3
8. Step 3:
Student Voice/Student Ownership
What is student voice/student ownership? According to the High School Plan
student voice is when…
“Students take ownership and responsibility for their learning and the demonstration
of their learning in assessments. Each student examines his/her own data and then
reacts reflectively and productively to the assessment results. As students increase
responsibility for their learning, they build a discipline that enables them to become
independent learners.”
During this step teachers share assessment data with their class. Students have the
opportunity to see their strengths and weaknesses, see where they fit into the
whole picture, and to create personal goals and a plan to reach those goals on the
next assessment.
Materials Needed:
• Individual benchmark score strips (cut from your item analysis report)
• Classrooom set of primary (regular education) benchmark item analysis report,
prepared as explained in the following instructions (student names blacked
out/important information circled)
• Classroom set of Benchmark test booklets
• One file folder per student (to be saved and used for each subsequent
benchmark)
• Individual copies of “Student Benchmark Analysis” sheet
• Individual copies of “Student Benchmark Performance” graphing sheet
Steps to implementing student voice/student ownership in the classroom. You
will do this for each section you teach:
1. First, you will cut your benchmark item analysis into strips by student. You will
give each student his/her individual scores so they can look at their individual
performance. Example:
Note: For the following classroom level activities, you will be using your primary
section (regular education) item analysis reports. As you know, special education
students are listed on a separate item analysis. However, remaining true to a full
9. inclusion model, special education students will analyze their performance within the
realm of the regular classroom.
2. Next, you will make a copy of your primary section’s Benchmark Item Analysis
(including the standards/skills page), black out the student names, and circle the
areas of data students will be analyzing in order to help them focus on the
important information.
3. Each student will also be given a copy of the benchmark booklet for reference,
the “Student Benchmark Analysis” sheet, and the “Student Benchmark Performance”
graphing sheet.
4. Once students have all of the necessary supplies…
• Individual performance strip
• Benchmark item analysis report,
• Benchmark test booklet
• Student Benchmark Analysis Sheet
• Student Benchmark Performance Graphing Sheet
…they will begin to look at their performance. Students should work in small
groups so they can support each other in looking at the data. They will answer the
10. questions about their individual performance on their own but can discuss their
individual performance with the group members.
5. When they are finished, students and teacher should discuss and compare their
findings as a whole group. Students will be given a folder to keep their
performance data. They will be using this data to compare their performance on
subsequent Benchmarks.
Each folder should include:
Student Benchmark Analysis Sheet
Student Benchmark Performance Graphing Sheet
11. Name: ________________________________ Date: ______________
Subject: _______________________
STUDENT BENCHMARK ANALYSIS
Benchmark #1
(October)
Directions: You will be reviewing your individual and classroom Benchmark results in
small groups. You will look at your strengths and weaknesses and set your goals for
the next Benchmark. Use the materials you were given to answer the following
questions.
1. What was your individual score? _____________
Use the item analysis sheet to answer the following questions:
2. What was your Classroom section’s Average Score? ______________
3. What was the School’s Average Score? ______________
4. What was the Region’s Average Score? _____________
5. What was the District’s Average Score? ____________
6. How did your Classroom Section (question #2) perform in comparison to:
(better, worse, or the same as)
The School? ___________________
The Region? ___________________
The District? __________________
7. How did YOU perform in comparison to:
(better, worse, or the same as)
Your Classroom Section? ___________________
The School? _______________________
The Region? ______________________
The District? ______________________
12. Using the Benchmark Item Analysis and the Benchmark test booklet, answer the
following questions using the following example as a guide:
You will be looking across the top of the item analysis at “Section Average Score”.
Identify the 3 highest percentages and 3 lowest percentages. These will be your
class strengths and weaknesses. Look up the corresponding question number on
standards/skill sheet and in your test booklet. What skill did the question ask you
to perform? For example:
Question #: 13
Section Average Score: 64.7
Based upon the skill sheet and the question in the test booklet this question
was asking us to: Identify the setting of a story (English example)
YOUR CLASS STRENGTHS:
8. Which three questions did your class perform the best on?
• Question #:
Section Average Score:
Based upon the skill sheet and the question in the test booklet this question
was asking us to:
• Question #:
Section Average Score:
Based upon the skill sheet and the question in the test booklet this question
was asking us to:
13. • Question #:
Section Average Score:
Based upon the skill sheet and the question in the test booklet this question
was asking us to:
YOUR CLASS WEAKNESSES:
9. Which 3 questions did your class perform the worst on?
• Question #:
Section Average Score:
Based upon the skill sheet and the question in the test booklet this question
was asking us to:
• Question #:
Section Average Score:
Based upon the skill sheet and the question in the test booklet this question
was asking us to:
• Question #:
Section Average Score:
Based upon the skill sheet and the question in the test booklet this question
was asking us to:
14. 10. YOUR PERSONAL PERFORMANCE
Now, you will identify the areas that you most need to work on. Look at your
individual strip. Turn to the questions you got wrong in the test booklet. Identify
the questions you answered wrong and decide which 3 were the most difficult for
you to answer. These are the areas you need to strengthen.
Question #:
This question was asking me to:
Question #:
This question was asking me to:
Question #:
This question was asking me to:
11. Being realistic, what is your goal for the next benchmark? (score) __________
12. What are some steps you can take or things you can do differently to help you
achieve your goal?
You will now graph your benchmark performance on the graph sheet you were
given so you can compare your performance throughout the year.