SlideShare ist ein Scribd-Unternehmen logo
1 von 30
Downloaden Sie, um offline zu lesen
Twin Cities

                                    Boise

                                                                                                            Chicago
                                                                                           Rockford

                                            Salt Lake     Northern CO                                            Indianapolis
                                                                                                                                               Baltimore
                                                           Denver
                     Reno                                                                                                                     Suburban MD/DC
                                                          Colorado Springs
                 Sacramento                                                                                                               Northern VA/DC
            Bay Area            St. Geo/Mesquite
     Central Valley         Las Vegas                                                                                             Triad
                                                                                                                 Nashville
                                             Prescott                                                                                     Raleigh/Durham
Central Coast                                            Santa Fe
                            Inland Empire                                                                                         Charlotte
                                                        Albuquerque
    LA Coastal
                                                                                                                      Atlanta
                                              Phoenix
                                 Tucson
                San Diego                                                     DFW

                                                                              Austin
                                                                                       Houston                               North Florida (Jacksonville)

                                                                             San Antonio                    Tampa Bay           Central Florida (Orlando)

                                                                             Rio Grande Valley    Sarasota/Bradenton
                                                                                                                                 Treasure Coast
                                                                                                          Naples/Ft. Myers
                                                                                                                                 South Florida (Miami-Ft.
                                                                                                                                 Lauderdale-Palm Beach)


                                                                © Copyright Metrostudy 2010


                                                                                                                                                               1
NATIONAL ECONOMIC OVERVIEW
       Overall Consumer Confidence Index-Monthly

    120
                           Dec. 2009 = 52.9
    100


     80


     60


     40


     20


       0
      Dec-01     Dec-02    Dec-03   Dec-04     Dec-05     Dec-06   Dec-07   Dec-08   Dec-09
Source: Conference Board

                                    © Copyright Metrostudy 2010


                                                                                              2
NATIONAL ECONOMIC OVERVIEW
                   Annual U.S. Non-Ag Job Growth
   5,000,000
                                        12 Months Ending
   3,000,000                      Nov. 2009: <4,659,000> Jobs

   1,000,000


  -1,000,000


  -3,000,000
                            Nov. 2009 Unemployment
  -5,000,000                      Rate = 10%

  -7,000,000
              Nov-99 Nov-00 Nov-01 Nov-02 Nov-03 Nov-04 Nov-05 Nov-06 Nov-07 Nov-08 Nov-09
Source: BLS

                                   © Copyright Metrostudy 2010


                                                                                             3
THE U.S. HOUSING MARKET
 ANNUAL RATE OF SINGLE FAMILY HOUSING STARTS
  Thousands
  2,000

  1,800

  1,600

  1,400

  1,200

  1,000

    800                                                Nov. 2009 Annual Starts= 482,000
    600                                                     (+5.7% from Nov. 2008)
                                                       (-74% from Peak in January 2006)
    400

    200
          Nov-89

                   Nov-90

                            Nov-91

                                     Nov-92

                                              Nov-93

                                                       Nov-94

                                                                Nov-95

                                                                          Nov-96

                                                                                   Nov-97

                                                                                            Nov-98

                                                                                                     Nov-99

                                                                                                              Nov-00

                                                                                                                       Nov-01

                                                                                                                                Nov-02

                                                                                                                                         Nov-03

                                                                                                                                                  Nov-04

                                                                                                                                                           Nov-05

                                                                                                                                                                    Nov-06

                                                                                                                                                                             Nov-07

                                                                                                                                                                                      Nov-08

                                                                                                                                                                                               Nov-09
Source: Census Bureau

                                                                         © Copyright Metrostudy 2010


                                                                                                                                                                                                        4
TOP 15 STATES RANKED BY SF PERMITS – (Nov ’09)

 Rank   State                     SF Annual Permit       SF Annual Change
   1    Texas                         63,222                 -20,425
   2    Florida                       26,574                 -16,802
   3    North Carolina                24,859                 -18,941
   4    California                    23,305                 -11,714
   5    Virginia                      15,933                  -5,350
   6    Pennsylvania                  13,899                  -5,678
   7    Georgia                       13,673                 -14,030
   8    South Carolina                13,203                  -7,998
   9    Washington                    12,282                  -5,519
  10    Arizona                       12,049                  -7,241
  11    Tennessee                     11,174                  -5,858
  12    Louisiana                     10,574                  -1,515
  13    Ohio                          10,554                  -6,959
  14    Indiana                        9,521                  -3,321
  15    New York                       9,481                  -3,611
Source: Metrostudy - MetroUSA           270,303             -134,962
                           © Copyright Metrostudy 2010


                                                                            5
THE U.S. HOUSING MARKET
   Months
                         MONTHS OF SUPPLY OF NEW HOMES
  15
  14                                                 Nov. 2009 MOS = 7.9 MOS
  13
  12
  11
  10
   9
   8
   7
   6
   5
   4
   3
   2
   1
      Nov-89

               Nov-90

                        Nov-91

                                 Nov-92

                                          Nov-93

                                                   Nov-94

                                                            Nov-95

                                                                     Nov-96

                                                                              Nov-97

                                                                                       Nov-98

                                                                                                Nov-99

                                                                                                         Nov-00

                                                                                                                  Nov-01

                                                                                                                           Nov-02

                                                                                                                                    Nov-03

                                                                                                                                             Nov-04

                                                                                                                                                      Nov-05

                                                                                                                                                               Nov-06

                                                                                                                                                                        Nov-07

                                                                                                                                                                                 Nov-08

Source: Census Bureau                                                                                                                                                                     Nov-09


                                                                       © Copyright Metrostudy 2010


                                                                                                                                                                                                   6
THE U.S. HOUSING MARKET
    ANNUAL % CHANGE IN HOME PRICES BY QUARTER
        S&P CASE SHILLER and FHFA FIGURES
   20.0%
                                                                                      FHFA 3Q09 <3.8%>
   15.0%

   10.0%

    5.0%

    0.0%

   -5.0%
                          S&P Case Shiller                           FHFA
 -10.0%

 -15.0%                                                          Case Shiller 3Q09 <8.9>%

 -20.0%
            3Q94

                   3Q95

                          3Q96

                                  3Q97

                                         3Q98

                                                3Q99

                                                       3Q00

                                                              3Q01

                                                                     3Q02

                                                                            3Q03

                                                                                   3Q04

                                                                                          3Q05

                                                                                                 3Q06

                                                                                                        3Q07

                                                                                                               3Q08

SOURCE: S&P/Case Shiller & FHFA                                                                                       3Q09
                                                © Copyright Metrostudy 2010


                                                                                                                             7
THE TEXAS HOUSING MARKETS
     AVERAGE ANNUAL % CHANGE IN HOME PRICES
                 San Antonio          Austin                  Dallas
                 Ft. Worth            Houston                 Texas
16

14                                                   3Q09 Austin = -0.6%
12

10

8

6

4

2

0

-2

-4
 3Q99     3Q00   3Q01   3Q02   3Q03      3Q04     3Q05       3Q06   3Q07   3Q08   3Q09
 SOURCE: FHFA


                               © Copyright Metrostudy 2010


                                                                                         8
JOB GROWTH-MAJOR TEXAS MARKETS
                     Annual Rate 2007, 2008 & Nov. 2009

 120,000
                    87,000                     76,000                    2007           2008       Nov-09
    70,000

                             22,500                                    26,100                24,800 9,900
    20,000                                                                      4,800

                                                    -2,500                          -6,200              -4,300
  -30,000

                                                             -50,700
  -80,000
                                     -88,900


-130,000
                          HOUSTON              DALLAS/FT. WORTH          SAN ANTONIO              AUSTIN

SOURCE: Texas Workforce Commission


                                                © Copyright Metrostudy 2010


                                                                                                                 9
AUSTIN ECONOMIC OVERVIEW
                 Non-Ag Job Growth: Annual Totals

 50,000               Net Job Losses Nov. ’08 to Nov. ’09 = 4,300
 40,000

 30,000

 20,000

 10,000

         0

-10,000                    Total Non-Ag
-20,000
                           Employment
                             780,900
-30,000
             1987    1989      1991   1993   1995   1997 1999      2001   2003   2005   2007   Nov-
                                                                                                09
Source: Texas Workforce Commission


                                         © Copyright Metrostudy 2010


                                                                                                      10
AUSTIN APARTMENT MARKET
                             Occupancy/Rents
  100%                                                                                          $1.25
                                    OCCUPANCY                           3Q09
                                                                                                $1.20
                                    RENT RATE                   Avg. Rent = $.93/SF
                                                                Avg. Occ. = 89%                 $1.15
    95%
                                                                                                $1.10
                                                                                                $1.05
    90%
                                                                                                $1.00
                                                                                                $0.95
    85%
                                                                                                $0.90
                                                                                                $0.85
    80%                                                                                         $0.80
                                                                                                $0.75
    75%                                                                                         $0.70
            3Q99     3Q00    3Q01   3Q02    3Q03    3Q04    3Q05    3Q06   3Q07   3Q08   3Q09
Source: Austin Investor Interests

                                           © Copyright Metrostudy 2010


                                                                                                        11
AUSTIN RESALE MARKET-MLS STATISTICS
                   Annual Closings History
 Closings
 35,000

 32,500             Nov. ‘09 Annual Closings = 20,758
 30,000

 27,500

 25,000

 22,500

 20,000

 17,500

 15,000

 12,500

 10,000
      Nov-99        Nov-00   Nov-01   Nov-02   Nov-03   Nov-04   Nov-05   Nov-06   Nov-07   Nov-08   Nov-09
Source: Real Estate Center


                                           © Copyright Metrostudy 2010


                                                                                                              12
AUSTIN RESALE MARKET - MLS STATISTICS
             Active Listings & Months of Supply
     Listings                                                        Nov. ’09                    Months of
                             Listings                            9,836 Listings                   Supply
     14,000
                             Months Supply                                                               9
                                                                 5.7 MOS
                                                                                                         8
     12,000
                                                                                                         7


     10,000                                                                                              6


                                                                                                         5
      8,000
                                                                                                         4


      6,000                                                                                              3


                                                                                                         2
      4,000
                                                                                                         1


      2,000                                                                                              0
          Nov-99   Nov-00    Nov-01   Nov-02   Nov-03   Nov-04   Nov-05   Nov-06   Nov-07   Nov-08   Nov-09
Source: Real Estate Center

                                           © Copyright Metrostudy 2010


                                                                                                              13
AUSTIN RESALE MARKET – MLS DATA
    Single Family MOS By Price Range-November 2009
 MOS      Previously Owned & New Construction
 30
                                                                                                                         26.4
                       Prev. Owned                                      New Const.                                25.9

 24


 18

                                                                                           13.4

 12                                                                                                     9.6
                                                                      8.7
          6.8                                             5.9
                  6.4     6.0                   6.7
                                    4.5                                         6.1
   6


   0
           <$ 12 5 K     $ 12 5 K- $ 17 5 K   $ 17 5 K- $ 2 5 0 K   $ 2 5 0 K- $ 4 0 0 K   $ 4 0 0 K- $ 7 5 0 K    >$ 7 5 0 K
Source: ABOR

                                              © Copyright Metrostudy 2010


                                                                                                                                14
AUSTIN RESALE MARKET-MLS STATISTICS
                             Average & Median Price Trend
   $290,000
                                               Nov. 2008 Avg.
                                                 =$236,041
   $265,000                                               (Single Family/TH/Condo)
   $240,000                   Average Price


   $215,000                   Median Price


   $190,000

   $165,000

   $140,000
                                                           Nov. 2008 Median=
   $115,000                                                     $176,300
                                                                    (Single Family)
     $90,000
                  1995 1996 1997 1998 1999 2000 2001 2002 2003 2004 2005 2006 2007 2008 Nov-
                                                                                         09

Source: Real Estate Center


                                      © Copyright Metrostudy 2010


                                                                                               15
AUSTIN MLS CLOSED SALES
                           Distributed by Sales Price
                       YTD Sept. 2008 vs. YTD Sept. 2009
30%


25%
                                                                       2008    2009

20%


15%


10%


 5%


 0%
             <$100K          $100K-$150k $150K-$200K $200K-$300K $300K-$500K   +$500K
SOURCE: Austin Board of Realtors


                                         © Copyright Metrostudy 2010


                                                                                        16
THE AUSTIN NEW HOME MARKET
             ANNUAL STARTS TREND: 2001 to 2009
                     Detached Housing
18,000
17,000
                                                          15,940
16,000
                                                14,638
15,000
14,000
                                     12,190                        12,436
13,000
                           11,225
12,000
         10,260   10,450
11,000
10,000
 9,000
                                                                            8,012
 8,000
                                                                                    6,490
 7,000
 6,000
 5,000
         2001     2002     2003       2004       2005      2006    2007     2008    2009

                                    © Copyright Metrostudy 2010


                                                                                            17
THE AUSTIN NEW HOME MARKET
                  ANNUAL STARTS TREND: 3Q06 to 4Q09
                          Detached Housing
18,000
         16,502
17,000
                  15,940
16,000
                           14,540
15,000
                                    14,009
14,000
                                             13,152
                                                      12,436
13,000
                                                               11,543
12,000
                                                                        10,399
11,000
10,000                                                                           9,315
 9,000
                                                                                         8,012
 8,000                                                                                           7,301
                                                                                                         6,587 6,511 6,490
 7,000
 6,000
 5,000
         3Q06 4Q06 1Q07 2Q07 3Q07 4Q07 1Q08 2Q08 3Q08 4Q08 1Q09 2Q09 3Q09 4Q09

                                                 © Copyright Metrostudy 2010


                                                                                                                             18
THE AUSTIN NEW HOME MARKET
             ANNUAL STARTS & CLOSINGS
20,000
                 DETACHED HOUSING
18,000               Annual Closings

16,000               Annual Starts
14,000

12,000

10,000

 8,000

 6,000                            6,490 Annual Starts
 4,000
                                  7,487 Annual Closings
 2,000

    0
     4Q95 4Q96 4Q97 4Q98 4Q99 4Q00 4Q01 4Q02 4Q03 4Q04 4Q05 4Q06 4Q07 4Q08 4Q09

                            © Copyright Metrostudy 2010


                                                                                  19
THE AUSTIN NEW HOME MARKET
             2009 ANNUAL STARTS BY SUB-MARKET
                      Detached Housing
1,400
         1,264

1,200

1,000
                         833
 800                                  734
                                                  608
 600                                                          536
                                                                          433
                                                                                   368
 400                                                                                          308           300
                                                                                                                          203                         166
                                                                                                                                        172
 200

   0    C P / Le a n.   R R oc k K y l e / B uda S W A us.   P f l ug.   G. Town   M a nor   D . Va l l e   H ut t o   S E A ust i n      Dr .      L. Tr a v i s
                                                                                                                                       S pr i ngs


                                                       © Copyright Metrostudy 2010


                                                                                                                                                                    20
THE AUSTIN NEW HOME MARKET
           Annual Starts by Price Range
              The Detached Market
            2006                 2007                    2008           2009
5,000
4,500
4,000
3,500
3,000
2,500
2,000
1,500
1,000
 500
   0
        <$150      $150-          $200-          $300-          $500-   >$750
                   $200           $300           $500           $750
                           © Copyright Metrostudy 2010


                                                                                21
TOTAL NEW HOME INVENTORY TREND
   (Under Construction & Finished Vacant Units)
                Detached Housing
10,000
 9,000      Under. Const. Inv. = 1,420 Units
 8,000      Fin. Vac. Inv. =     1,703 Units
            Total Inv. =         3,494 Units
 7,000
 6,000
 5,000
 4,000
 3,000
 2,000

 1,000
    0
     4Q89    4Q91   4Q93   4Q95   4Q97     4Q99     4Q01   4Q03   4Q05   4Q07   4Q09

                            © Copyright Metrostudy 2010


                                                                                       22
THE AUSTIN NEW HOME MARKET
Annual Starts/      Vacant Developed Lot Trend
Lot Inventory                                                                           MOS
30,000
                       The Detached Market                                                  48
                                  Annual Starts
                                  Vacant Developed Lots
                                  Months of Supply                                          42
25,000
                                                                                            36

20,000                                                                                      30

                                                                                            24
15,000                                                                                      18

                                                                                            12
10,000
                                                                                            6

 5,000                                                                                      0
         4Q99    4Q00   4Q01   4Q02   4Q03   4Q04    4Q05       4Q06   4Q07   4Q08   4Q09

                                  © Copyright Metrostudy 2010


                                                                                                 23
FORECLOSURE POSTING & SALES TREND
                    Travis & Williamson Counties
                            Annual Rate
13,000
12,000
                   Annual Postings
11,000
10,000
                   Annual Foreclosure Sales
 9,000
 8,000
 7,000
 6,000
 5,000
               Annual Postings + 61% from Jan. ’09 to Jan. ‘10
 4,000
 3,000
 2,000
 1,000             Annual Sales +24% from Dec. ’08 to Dec. ‘09
     0
     Jan-07    May-07     Sep-07   Jan-08   May-08    Sep-09    Jan-09   May-09   Sep-09   Jan-10
SOURCE: Real Estate Foreclosures


                                      © Copyright Metrostudy 2010


                                                                                                    24
Top 20 MSAs-Highest Rates of Home Appreciation
                  Annual Change as of 3Q09
 Wichita Falls, TX                                                          6.0%
   Corpus Christi,                                                      5.5%
  San Angelo, TX                                                       5.4%
     Hinesville, GA                                                  5.2%
    Texarkana, TX                                                4.7%
   Jonesboro, AR                                               4.5%
  Brownsville, TX                                             4.4%
  St. Joseph, MO-                                     3.7%
      Dubuque, IA                                    3.6%
       Midland, TX                                  3.5%
          Tyler, TX                                3.4%
       Amarillo, TX                               3.3%
       Wichita, KS                                3.3%
       Abilene, TX                                3.3%
       Lawton, OK                                 3.3%
   Sioux City, IA-                              3.1%
State College, PA                               3.1%
     Pittsfield, MA                            3.0%
    Burlington, NC                             3.0%
         Elmira, NY                           2.9%


SOURCE: FHFA     0.0%   1.0%    2.0%       3.0%        4.0%     5.0%     6.0%      7.0%

                               © Copyright Metrostudy 2010


                                                                                          25
Bottom 20 MSAs-Lowest Rates of Home Appreciation
                Annual Change as of 3Q09
                  El Centro, CA            -24.5%
      Las Vegas-Paradise, NV                  -22.5%
                      Miami, FL                  -20.5%
                       Bend, OR                    -19.4%
                    Merced, CA                      -18.6%
              Reno-Sparks, NV                         -17.5%
 Phoenix-Mesa-Scottsdale, AZ                           -16.9%
   Lakeland-Winter Haven, FL                            -16.2%
              Port St. Lucie, FL                         -15.8%
            Ft. Lauderdale, FL                            -15.4%
        Visalia-Porterville, CA                            -14.9%
                       Ocala, FL                           -14.9%
        Orlando-Kissimmee, FL                              -14.7%
                 St. George, UT                              -14.0%
                  Modesto, CA                                -13.9%
                     Fresno, CA                              -13.8%
       Madera-Chowchilla, CA                                  -13.6%
           Vallejo-Fairfield, CA                              -13.5%
                  Prescott, AZ                                -13.4%
Lake Havasu City-Kingman, AZ                                  -13.4%

                              -35%    -30%     -25%      -20%      -15%   -10%   -5%   0%
SOURCE: FHFA


                                     © Copyright Metrostudy 2010


                                                                                            26
STATES WITH HIGHEST SHARE OF NEGATIVE EQUITY AS
               OF THIRD QUARTER 2009
  Oklahoma             6.0%

     TEXAS                    11.0%

New Mexico                    11.0%

      Idaho                            20.0%

        Ohio                           20.0%

  Maryland                                  22.0%

    Virginia                                  24.0%

    Georgia                                   24.0%

  California                                              35.0%

   Michigan                                                 37.0%

     Florida                                                         45.0%

    Arizona                                                            48.0%

    Nevada                                                                           65.0%

            0%           10%          20%           30%      40%       50%     60%     70%
SOURCE: First American Core Logic


                                       © Copyright Metrostudy 2010


                                                                                             27
0
                                                            5,000
                                                                    10,000
                                                                             15,000
                                                                                           20,000
                                                                                                    25,000
                                           Houston

                                    Dall as/Ft Wort h

                                            Orl ando

                                            Phoe ni x

                                           Mary land

                                              Aust in


                                                                                      Austin
                                       San Antonio

                                             MD - C

                                   Northern Vi rginia

                                          Charlotte

                                           Cent Cal

                                      Inland Empir e

                                   Rale igh-Durha m

                                            NoVa-C

                                            Chicago


     © Copyright Metrostudy 2010
                                             Atl anta

                                       Salt Lake City

                                       So Cal Coast
                                                                                                              Annual Starts Comparison


                                          Las Vegas
                                                                                                             National Comparison – 3Q09


                                             Tampa

                                      San Francisc o

                                        Jack sonvi lle

                                           Nashvill e

                                        Minneapol is

                                             Denver


28
0
                                                            5,000
                                                                    10,000
                                                                             15,000
                                                                                               20,000
                                                                                                        25,000
                                            Chicago

                                            Orland o

                                             Atlanta

                                            Hou ston

                                            Phoenix

                                         Las Vegas

                                     San Francisco

                                    Dallas/Ft Worth

                                       So Cal Coast

                                           Maryland

                                      Inland Emp ire

                                           Char lotte

                                    Raleigh-Durham

                                             Denver

                                      Salt Lake City


     © Copyright Metrostudy 2010
                                   North ern Virginia

                                            Cent C al

                                              Tamp a

                                       Jackso nville
                                                                                                                       National Comparison – 3Q09


                                        San Anto nio

                                        Minneapo lis

                                              Aust in
                                                                                                                 Total New Housing Inventory - # of Units


                                              MD - C
                                                                                      Austin


                                             NoVa-C

                                          Nashville


29
0
                                                            2,000
                                                                    4,000
                                                                            6,000
                                                                                    8,000
                                                                                            10,000
                                                                                                     12,000
                                                                                                              14,000
                                                                                                                       16,000
                                            Orland o

                                             Atlanta

                                            Chicago

                                         Las Vegas

                                            Phoenix

                                       So Cal Coast

                                            Hou ston

                                    Dallas/Ft Worth

                                     San Francisco

                                           Maryland

                                           Char lotte

                                    Raleigh-Durham

                                       Jackso nville

                                             Denver

                                      Inland Emp ire


     © Copyright Metrostudy 2010
                                              Tamp a

                                            Cent C al

                                        Minneapo lis
                                                                                                                                        National Comparison – 3Q09


                                      Salt Lake City

                                   North ern Virginia

                                          Nashville

                                        San Anto nio
                                                                                                                                Total Finished Vacant Inventory - # of Units


                                              Aust in

                                              MD - C
                                                                                            Austin


                                             NoVa-C


30

Weitere ähnliche Inhalte

Kürzlich hochgeladen

Magarpatta Nova Elegance Mundhwa Pune E-Brochure.pdf
Magarpatta Nova Elegance Mundhwa Pune  E-Brochure.pdfMagarpatta Nova Elegance Mundhwa Pune  E-Brochure.pdf
Magarpatta Nova Elegance Mundhwa Pune E-Brochure.pdfManishSaxena95
 
How to Build Multifamily and Laneway Suites in Toronto!! (feat. Expert Archi...
How to Build Multifamily and Laneway Suites  in Toronto!! (feat. Expert Archi...How to Build Multifamily and Laneway Suites  in Toronto!! (feat. Expert Archi...
How to Build Multifamily and Laneway Suites in Toronto!! (feat. Expert Archi...Volition Properties
 
FULL ENJOY - 8264348440 Call Girls in DLf Phase 4 | Gurgaon
FULL ENJOY - 8264348440 Call Girls in DLf Phase 4 | GurgaonFULL ENJOY - 8264348440 Call Girls in DLf Phase 4 | Gurgaon
FULL ENJOY - 8264348440 Call Girls in DLf Phase 4 | Gurgaonsoniya singh
 
Premium Villa Projects in Sarjapur Road Bengaluru
Premium Villa Projects in Sarjapur Road BengaluruPremium Villa Projects in Sarjapur Road Bengaluru
Premium Villa Projects in Sarjapur Road BengaluruShivaSeo3
 
Maha Mauka Squarefeet Brochure |Maha Mauka Squarefeet PDF Brochure|
Maha Mauka Squarefeet Brochure |Maha Mauka Squarefeet PDF Brochure|Maha Mauka Squarefeet Brochure |Maha Mauka Squarefeet PDF Brochure|
Maha Mauka Squarefeet Brochure |Maha Mauka Squarefeet PDF Brochure|AkshayJoshi575980
 
Model Call Girl in Shastri Nagar Delhi reach out to us at 🔝8264348440🔝
Model Call Girl in Shastri Nagar Delhi reach out to us at 🔝8264348440🔝Model Call Girl in Shastri Nagar Delhi reach out to us at 🔝8264348440🔝
Model Call Girl in Shastri Nagar Delhi reach out to us at 🔝8264348440🔝soniya singh
 
:/Call Girls In Saidulajab Delhi ➥9990211544 High profile Riya Escorts In 24/...
:/Call Girls In Saidulajab Delhi ➥9990211544 High profile Riya Escorts In 24/...:/Call Girls In Saidulajab Delhi ➥9990211544 High profile Riya Escorts In 24/...
:/Call Girls In Saidulajab Delhi ➥9990211544 High profile Riya Escorts In 24/...lizamodels9
 
Call Girls in Adarsh Nagar Delhi 💯Call Us 🔝 9582086666🔝 South Delhi Escorts S...
Call Girls in Adarsh Nagar Delhi 💯Call Us 🔝 9582086666🔝 South Delhi Escorts S...Call Girls in Adarsh Nagar Delhi 💯Call Us 🔝 9582086666🔝 South Delhi Escorts S...
Call Girls in Adarsh Nagar Delhi 💯Call Us 🔝 9582086666🔝 South Delhi Escorts S...delhimodel235
 
Nanke Area Estate commercial ( Dir. Kat Kuo)
Nanke Area Estate commercial ( Dir. Kat Kuo)Nanke Area Estate commercial ( Dir. Kat Kuo)
Nanke Area Estate commercial ( Dir. Kat Kuo)jessica288382
 
Call Girls in Noida Sector 13 Noida 💯Call Us 🔝 9582086666 🔝 South Delhi Escor...
Call Girls in Noida Sector 13 Noida 💯Call Us 🔝 9582086666 🔝 South Delhi Escor...Call Girls in Noida Sector 13 Noida 💯Call Us 🔝 9582086666 🔝 South Delhi Escor...
Call Girls in Noida Sector 13 Noida 💯Call Us 🔝 9582086666 🔝 South Delhi Escor...delhimodel235
 
call girls in lajapat nagar 9811711561/..
call girls in lajapat nagar 9811711561/..call girls in lajapat nagar 9811711561/..
call girls in lajapat nagar 9811711561/..vikas rana
 
Call Girls In Hari Nagar Dadb Block {8447779280}Hari Nagar {West Delhi Escort...
Call Girls In Hari Nagar Dadb Block {8447779280}Hari Nagar {West Delhi Escort...Call Girls In Hari Nagar Dadb Block {8447779280}Hari Nagar {West Delhi Escort...
Call Girls In Hari Nagar Dadb Block {8447779280}Hari Nagar {West Delhi Escort...asmaqueen5
 
9711199012 Call {Girls Delhi} Very Low rate Vaishali DownLoad PDF
9711199012 Call {Girls Delhi} Very Low rate Vaishali DownLoad PDF9711199012 Call {Girls Delhi} Very Low rate Vaishali DownLoad PDF
9711199012 Call {Girls Delhi} Very Low rate Vaishali DownLoad PDFMs Riya
 
Call Girls In Mayur Vihar Delhi ☆↫8447779280 ❤Escorts Service In Delhi
Call Girls In Mayur Vihar Delhi ☆↫8447779280 ❤Escorts Service In DelhiCall Girls In Mayur Vihar Delhi ☆↫8447779280 ❤Escorts Service In Delhi
Call Girls In Mayur Vihar Delhi ☆↫8447779280 ❤Escorts Service In Delhiasmaqueen5
 
Call Girls In Chand Nagar (Delhi)+918447779280 Welcome To Vip Women Seeking M...
Call Girls In Chand Nagar (Delhi)+918447779280 Welcome To Vip Women Seeking M...Call Girls In Chand Nagar (Delhi)+918447779280 Welcome To Vip Women Seeking M...
Call Girls In Chand Nagar (Delhi)+918447779280 Welcome To Vip Women Seeking M...asmaqueen5
 
Call Girls in Noida Sector 77 Noida 💯Call Us 🔝 9582086666 🔝 South Delhi Escor...
Call Girls in Noida Sector 77 Noida 💯Call Us 🔝 9582086666 🔝 South Delhi Escor...Call Girls in Noida Sector 77 Noida 💯Call Us 🔝 9582086666 🔝 South Delhi Escor...
Call Girls in Noida Sector 77 Noida 💯Call Us 🔝 9582086666 🔝 South Delhi Escor...delhimodel235
 
Puravankara Mundhwa Pune E-Brochure.pdf
Puravankara Mundhwa Pune  E-Brochure.pdfPuravankara Mundhwa Pune  E-Brochure.pdf
Puravankara Mundhwa Pune E-Brochure.pdfManishSaxena95
 
2k Shot Call girls Karol Bagh Delhi 9205541914
2k Shot Call girls Karol Bagh Delhi 92055419142k Shot Call girls Karol Bagh Delhi 9205541914
2k Shot Call girls Karol Bagh Delhi 9205541914Delhi Call girls
 
3D Architectural Rendering Company by Panoram CGI
3D Architectural Rendering Company by Panoram CGI3D Architectural Rendering Company by Panoram CGI
3D Architectural Rendering Company by Panoram CGIPanoram CGI
 
Listing Turkey Sylvana Istanbul - Bahcesehir
Listing Turkey Sylvana Istanbul - BahcesehirListing Turkey Sylvana Istanbul - Bahcesehir
Listing Turkey Sylvana Istanbul - BahcesehirListing Turkey
 

Kürzlich hochgeladen (20)

Magarpatta Nova Elegance Mundhwa Pune E-Brochure.pdf
Magarpatta Nova Elegance Mundhwa Pune  E-Brochure.pdfMagarpatta Nova Elegance Mundhwa Pune  E-Brochure.pdf
Magarpatta Nova Elegance Mundhwa Pune E-Brochure.pdf
 
How to Build Multifamily and Laneway Suites in Toronto!! (feat. Expert Archi...
How to Build Multifamily and Laneway Suites  in Toronto!! (feat. Expert Archi...How to Build Multifamily and Laneway Suites  in Toronto!! (feat. Expert Archi...
How to Build Multifamily and Laneway Suites in Toronto!! (feat. Expert Archi...
 
FULL ENJOY - 8264348440 Call Girls in DLf Phase 4 | Gurgaon
FULL ENJOY - 8264348440 Call Girls in DLf Phase 4 | GurgaonFULL ENJOY - 8264348440 Call Girls in DLf Phase 4 | Gurgaon
FULL ENJOY - 8264348440 Call Girls in DLf Phase 4 | Gurgaon
 
Premium Villa Projects in Sarjapur Road Bengaluru
Premium Villa Projects in Sarjapur Road BengaluruPremium Villa Projects in Sarjapur Road Bengaluru
Premium Villa Projects in Sarjapur Road Bengaluru
 
Maha Mauka Squarefeet Brochure |Maha Mauka Squarefeet PDF Brochure|
Maha Mauka Squarefeet Brochure |Maha Mauka Squarefeet PDF Brochure|Maha Mauka Squarefeet Brochure |Maha Mauka Squarefeet PDF Brochure|
Maha Mauka Squarefeet Brochure |Maha Mauka Squarefeet PDF Brochure|
 
Model Call Girl in Shastri Nagar Delhi reach out to us at 🔝8264348440🔝
Model Call Girl in Shastri Nagar Delhi reach out to us at 🔝8264348440🔝Model Call Girl in Shastri Nagar Delhi reach out to us at 🔝8264348440🔝
Model Call Girl in Shastri Nagar Delhi reach out to us at 🔝8264348440🔝
 
:/Call Girls In Saidulajab Delhi ➥9990211544 High profile Riya Escorts In 24/...
:/Call Girls In Saidulajab Delhi ➥9990211544 High profile Riya Escorts In 24/...:/Call Girls In Saidulajab Delhi ➥9990211544 High profile Riya Escorts In 24/...
:/Call Girls In Saidulajab Delhi ➥9990211544 High profile Riya Escorts In 24/...
 
Call Girls in Adarsh Nagar Delhi 💯Call Us 🔝 9582086666🔝 South Delhi Escorts S...
Call Girls in Adarsh Nagar Delhi 💯Call Us 🔝 9582086666🔝 South Delhi Escorts S...Call Girls in Adarsh Nagar Delhi 💯Call Us 🔝 9582086666🔝 South Delhi Escorts S...
Call Girls in Adarsh Nagar Delhi 💯Call Us 🔝 9582086666🔝 South Delhi Escorts S...
 
Nanke Area Estate commercial ( Dir. Kat Kuo)
Nanke Area Estate commercial ( Dir. Kat Kuo)Nanke Area Estate commercial ( Dir. Kat Kuo)
Nanke Area Estate commercial ( Dir. Kat Kuo)
 
Call Girls in Noida Sector 13 Noida 💯Call Us 🔝 9582086666 🔝 South Delhi Escor...
Call Girls in Noida Sector 13 Noida 💯Call Us 🔝 9582086666 🔝 South Delhi Escor...Call Girls in Noida Sector 13 Noida 💯Call Us 🔝 9582086666 🔝 South Delhi Escor...
Call Girls in Noida Sector 13 Noida 💯Call Us 🔝 9582086666 🔝 South Delhi Escor...
 
call girls in lajapat nagar 9811711561/..
call girls in lajapat nagar 9811711561/..call girls in lajapat nagar 9811711561/..
call girls in lajapat nagar 9811711561/..
 
Call Girls In Hari Nagar Dadb Block {8447779280}Hari Nagar {West Delhi Escort...
Call Girls In Hari Nagar Dadb Block {8447779280}Hari Nagar {West Delhi Escort...Call Girls In Hari Nagar Dadb Block {8447779280}Hari Nagar {West Delhi Escort...
Call Girls In Hari Nagar Dadb Block {8447779280}Hari Nagar {West Delhi Escort...
 
9711199012 Call {Girls Delhi} Very Low rate Vaishali DownLoad PDF
9711199012 Call {Girls Delhi} Very Low rate Vaishali DownLoad PDF9711199012 Call {Girls Delhi} Very Low rate Vaishali DownLoad PDF
9711199012 Call {Girls Delhi} Very Low rate Vaishali DownLoad PDF
 
Call Girls In Mayur Vihar Delhi ☆↫8447779280 ❤Escorts Service In Delhi
Call Girls In Mayur Vihar Delhi ☆↫8447779280 ❤Escorts Service In DelhiCall Girls In Mayur Vihar Delhi ☆↫8447779280 ❤Escorts Service In Delhi
Call Girls In Mayur Vihar Delhi ☆↫8447779280 ❤Escorts Service In Delhi
 
Call Girls In Chand Nagar (Delhi)+918447779280 Welcome To Vip Women Seeking M...
Call Girls In Chand Nagar (Delhi)+918447779280 Welcome To Vip Women Seeking M...Call Girls In Chand Nagar (Delhi)+918447779280 Welcome To Vip Women Seeking M...
Call Girls In Chand Nagar (Delhi)+918447779280 Welcome To Vip Women Seeking M...
 
Call Girls in Noida Sector 77 Noida 💯Call Us 🔝 9582086666 🔝 South Delhi Escor...
Call Girls in Noida Sector 77 Noida 💯Call Us 🔝 9582086666 🔝 South Delhi Escor...Call Girls in Noida Sector 77 Noida 💯Call Us 🔝 9582086666 🔝 South Delhi Escor...
Call Girls in Noida Sector 77 Noida 💯Call Us 🔝 9582086666 🔝 South Delhi Escor...
 
Puravankara Mundhwa Pune E-Brochure.pdf
Puravankara Mundhwa Pune  E-Brochure.pdfPuravankara Mundhwa Pune  E-Brochure.pdf
Puravankara Mundhwa Pune E-Brochure.pdf
 
2k Shot Call girls Karol Bagh Delhi 9205541914
2k Shot Call girls Karol Bagh Delhi 92055419142k Shot Call girls Karol Bagh Delhi 9205541914
2k Shot Call girls Karol Bagh Delhi 9205541914
 
3D Architectural Rendering Company by Panoram CGI
3D Architectural Rendering Company by Panoram CGI3D Architectural Rendering Company by Panoram CGI
3D Architectural Rendering Company by Panoram CGI
 
Listing Turkey Sylvana Istanbul - Bahcesehir
Listing Turkey Sylvana Istanbul - BahcesehirListing Turkey Sylvana Istanbul - Bahcesehir
Listing Turkey Sylvana Istanbul - Bahcesehir
 

Empfohlen

2024 State of Marketing Report – by Hubspot
2024 State of Marketing Report – by Hubspot2024 State of Marketing Report – by Hubspot
2024 State of Marketing Report – by HubspotMarius Sescu
 
Everything You Need To Know About ChatGPT
Everything You Need To Know About ChatGPTEverything You Need To Know About ChatGPT
Everything You Need To Know About ChatGPTExpeed Software
 
Product Design Trends in 2024 | Teenage Engineerings
Product Design Trends in 2024 | Teenage EngineeringsProduct Design Trends in 2024 | Teenage Engineerings
Product Design Trends in 2024 | Teenage EngineeringsPixeldarts
 
How Race, Age and Gender Shape Attitudes Towards Mental Health
How Race, Age and Gender Shape Attitudes Towards Mental HealthHow Race, Age and Gender Shape Attitudes Towards Mental Health
How Race, Age and Gender Shape Attitudes Towards Mental HealthThinkNow
 
AI Trends in Creative Operations 2024 by Artwork Flow.pdf
AI Trends in Creative Operations 2024 by Artwork Flow.pdfAI Trends in Creative Operations 2024 by Artwork Flow.pdf
AI Trends in Creative Operations 2024 by Artwork Flow.pdfmarketingartwork
 
PEPSICO Presentation to CAGNY Conference Feb 2024
PEPSICO Presentation to CAGNY Conference Feb 2024PEPSICO Presentation to CAGNY Conference Feb 2024
PEPSICO Presentation to CAGNY Conference Feb 2024Neil Kimberley
 
Content Methodology: A Best Practices Report (Webinar)
Content Methodology: A Best Practices Report (Webinar)Content Methodology: A Best Practices Report (Webinar)
Content Methodology: A Best Practices Report (Webinar)contently
 
How to Prepare For a Successful Job Search for 2024
How to Prepare For a Successful Job Search for 2024How to Prepare For a Successful Job Search for 2024
How to Prepare For a Successful Job Search for 2024Albert Qian
 
Social Media Marketing Trends 2024 // The Global Indie Insights
Social Media Marketing Trends 2024 // The Global Indie InsightsSocial Media Marketing Trends 2024 // The Global Indie Insights
Social Media Marketing Trends 2024 // The Global Indie InsightsKurio // The Social Media Age(ncy)
 
Trends In Paid Search: Navigating The Digital Landscape In 2024
Trends In Paid Search: Navigating The Digital Landscape In 2024Trends In Paid Search: Navigating The Digital Landscape In 2024
Trends In Paid Search: Navigating The Digital Landscape In 2024Search Engine Journal
 
5 Public speaking tips from TED - Visualized summary
5 Public speaking tips from TED - Visualized summary5 Public speaking tips from TED - Visualized summary
5 Public speaking tips from TED - Visualized summarySpeakerHub
 
ChatGPT and the Future of Work - Clark Boyd
ChatGPT and the Future of Work - Clark Boyd ChatGPT and the Future of Work - Clark Boyd
ChatGPT and the Future of Work - Clark Boyd Clark Boyd
 
Getting into the tech field. what next
Getting into the tech field. what next Getting into the tech field. what next
Getting into the tech field. what next Tessa Mero
 
Google's Just Not That Into You: Understanding Core Updates & Search Intent
Google's Just Not That Into You: Understanding Core Updates & Search IntentGoogle's Just Not That Into You: Understanding Core Updates & Search Intent
Google's Just Not That Into You: Understanding Core Updates & Search IntentLily Ray
 
Time Management & Productivity - Best Practices
Time Management & Productivity -  Best PracticesTime Management & Productivity -  Best Practices
Time Management & Productivity - Best PracticesVit Horky
 
The six step guide to practical project management
The six step guide to practical project managementThe six step guide to practical project management
The six step guide to practical project managementMindGenius
 
Beginners Guide to TikTok for Search - Rachel Pearson - We are Tilt __ Bright...
Beginners Guide to TikTok for Search - Rachel Pearson - We are Tilt __ Bright...Beginners Guide to TikTok for Search - Rachel Pearson - We are Tilt __ Bright...
Beginners Guide to TikTok for Search - Rachel Pearson - We are Tilt __ Bright...RachelPearson36
 

Empfohlen (20)

2024 State of Marketing Report – by Hubspot
2024 State of Marketing Report – by Hubspot2024 State of Marketing Report – by Hubspot
2024 State of Marketing Report – by Hubspot
 
Everything You Need To Know About ChatGPT
Everything You Need To Know About ChatGPTEverything You Need To Know About ChatGPT
Everything You Need To Know About ChatGPT
 
Product Design Trends in 2024 | Teenage Engineerings
Product Design Trends in 2024 | Teenage EngineeringsProduct Design Trends in 2024 | Teenage Engineerings
Product Design Trends in 2024 | Teenage Engineerings
 
How Race, Age and Gender Shape Attitudes Towards Mental Health
How Race, Age and Gender Shape Attitudes Towards Mental HealthHow Race, Age and Gender Shape Attitudes Towards Mental Health
How Race, Age and Gender Shape Attitudes Towards Mental Health
 
AI Trends in Creative Operations 2024 by Artwork Flow.pdf
AI Trends in Creative Operations 2024 by Artwork Flow.pdfAI Trends in Creative Operations 2024 by Artwork Flow.pdf
AI Trends in Creative Operations 2024 by Artwork Flow.pdf
 
Skeleton Culture Code
Skeleton Culture CodeSkeleton Culture Code
Skeleton Culture Code
 
PEPSICO Presentation to CAGNY Conference Feb 2024
PEPSICO Presentation to CAGNY Conference Feb 2024PEPSICO Presentation to CAGNY Conference Feb 2024
PEPSICO Presentation to CAGNY Conference Feb 2024
 
Content Methodology: A Best Practices Report (Webinar)
Content Methodology: A Best Practices Report (Webinar)Content Methodology: A Best Practices Report (Webinar)
Content Methodology: A Best Practices Report (Webinar)
 
How to Prepare For a Successful Job Search for 2024
How to Prepare For a Successful Job Search for 2024How to Prepare For a Successful Job Search for 2024
How to Prepare For a Successful Job Search for 2024
 
Social Media Marketing Trends 2024 // The Global Indie Insights
Social Media Marketing Trends 2024 // The Global Indie InsightsSocial Media Marketing Trends 2024 // The Global Indie Insights
Social Media Marketing Trends 2024 // The Global Indie Insights
 
Trends In Paid Search: Navigating The Digital Landscape In 2024
Trends In Paid Search: Navigating The Digital Landscape In 2024Trends In Paid Search: Navigating The Digital Landscape In 2024
Trends In Paid Search: Navigating The Digital Landscape In 2024
 
5 Public speaking tips from TED - Visualized summary
5 Public speaking tips from TED - Visualized summary5 Public speaking tips from TED - Visualized summary
5 Public speaking tips from TED - Visualized summary
 
ChatGPT and the Future of Work - Clark Boyd
ChatGPT and the Future of Work - Clark Boyd ChatGPT and the Future of Work - Clark Boyd
ChatGPT and the Future of Work - Clark Boyd
 
Getting into the tech field. what next
Getting into the tech field. what next Getting into the tech field. what next
Getting into the tech field. what next
 
Google's Just Not That Into You: Understanding Core Updates & Search Intent
Google's Just Not That Into You: Understanding Core Updates & Search IntentGoogle's Just Not That Into You: Understanding Core Updates & Search Intent
Google's Just Not That Into You: Understanding Core Updates & Search Intent
 
How to have difficult conversations
How to have difficult conversations How to have difficult conversations
How to have difficult conversations
 
Introduction to Data Science
Introduction to Data ScienceIntroduction to Data Science
Introduction to Data Science
 
Time Management & Productivity - Best Practices
Time Management & Productivity -  Best PracticesTime Management & Productivity -  Best Practices
Time Management & Productivity - Best Practices
 
The six step guide to practical project management
The six step guide to practical project managementThe six step guide to practical project management
The six step guide to practical project management
 
Beginners Guide to TikTok for Search - Rachel Pearson - We are Tilt __ Bright...
Beginners Guide to TikTok for Search - Rachel Pearson - We are Tilt __ Bright...Beginners Guide to TikTok for Search - Rachel Pearson - We are Tilt __ Bright...
Beginners Guide to TikTok for Search - Rachel Pearson - We are Tilt __ Bright...
 

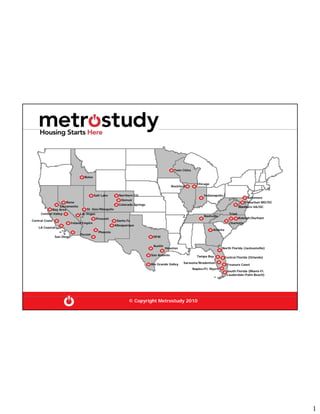
Metrostudy 2010 Housing Forecast For Distribution 1 13 10

  • 1. Twin Cities Boise Chicago Rockford Salt Lake Northern CO Indianapolis Baltimore Denver Reno Suburban MD/DC Colorado Springs Sacramento Northern VA/DC Bay Area St. Geo/Mesquite Central Valley Las Vegas Triad Nashville Prescott Raleigh/Durham Central Coast Santa Fe Inland Empire Charlotte Albuquerque LA Coastal Atlanta Phoenix Tucson San Diego DFW Austin Houston North Florida (Jacksonville) San Antonio Tampa Bay Central Florida (Orlando) Rio Grande Valley Sarasota/Bradenton Treasure Coast Naples/Ft. Myers South Florida (Miami-Ft. Lauderdale-Palm Beach) © Copyright Metrostudy 2010 1
  • 2. NATIONAL ECONOMIC OVERVIEW Overall Consumer Confidence Index-Monthly 120 Dec. 2009 = 52.9 100 80 60 40 20 0 Dec-01 Dec-02 Dec-03 Dec-04 Dec-05 Dec-06 Dec-07 Dec-08 Dec-09 Source: Conference Board © Copyright Metrostudy 2010 2
  • 3. NATIONAL ECONOMIC OVERVIEW Annual U.S. Non-Ag Job Growth 5,000,000 12 Months Ending 3,000,000 Nov. 2009: <4,659,000> Jobs 1,000,000 -1,000,000 -3,000,000 Nov. 2009 Unemployment -5,000,000 Rate = 10% -7,000,000 Nov-99 Nov-00 Nov-01 Nov-02 Nov-03 Nov-04 Nov-05 Nov-06 Nov-07 Nov-08 Nov-09 Source: BLS © Copyright Metrostudy 2010 3
  • 4. THE U.S. HOUSING MARKET ANNUAL RATE OF SINGLE FAMILY HOUSING STARTS Thousands 2,000 1,800 1,600 1,400 1,200 1,000 800 Nov. 2009 Annual Starts= 482,000 600 (+5.7% from Nov. 2008) (-74% from Peak in January 2006) 400 200 Nov-89 Nov-90 Nov-91 Nov-92 Nov-93 Nov-94 Nov-95 Nov-96 Nov-97 Nov-98 Nov-99 Nov-00 Nov-01 Nov-02 Nov-03 Nov-04 Nov-05 Nov-06 Nov-07 Nov-08 Nov-09 Source: Census Bureau © Copyright Metrostudy 2010 4
  • 5. TOP 15 STATES RANKED BY SF PERMITS – (Nov ’09) Rank State SF Annual Permit SF Annual Change 1 Texas 63,222 -20,425 2 Florida 26,574 -16,802 3 North Carolina 24,859 -18,941 4 California 23,305 -11,714 5 Virginia 15,933 -5,350 6 Pennsylvania 13,899 -5,678 7 Georgia 13,673 -14,030 8 South Carolina 13,203 -7,998 9 Washington 12,282 -5,519 10 Arizona 12,049 -7,241 11 Tennessee 11,174 -5,858 12 Louisiana 10,574 -1,515 13 Ohio 10,554 -6,959 14 Indiana 9,521 -3,321 15 New York 9,481 -3,611 Source: Metrostudy - MetroUSA 270,303 -134,962 © Copyright Metrostudy 2010 5
  • 6. THE U.S. HOUSING MARKET Months MONTHS OF SUPPLY OF NEW HOMES 15 14 Nov. 2009 MOS = 7.9 MOS 13 12 11 10 9 8 7 6 5 4 3 2 1 Nov-89 Nov-90 Nov-91 Nov-92 Nov-93 Nov-94 Nov-95 Nov-96 Nov-97 Nov-98 Nov-99 Nov-00 Nov-01 Nov-02 Nov-03 Nov-04 Nov-05 Nov-06 Nov-07 Nov-08 Source: Census Bureau Nov-09 © Copyright Metrostudy 2010 6
  • 7. THE U.S. HOUSING MARKET ANNUAL % CHANGE IN HOME PRICES BY QUARTER S&P CASE SHILLER and FHFA FIGURES 20.0% FHFA 3Q09 <3.8%> 15.0% 10.0% 5.0% 0.0% -5.0% S&P Case Shiller FHFA -10.0% -15.0% Case Shiller 3Q09 <8.9>% -20.0% 3Q94 3Q95 3Q96 3Q97 3Q98 3Q99 3Q00 3Q01 3Q02 3Q03 3Q04 3Q05 3Q06 3Q07 3Q08 SOURCE: S&P/Case Shiller & FHFA 3Q09 © Copyright Metrostudy 2010 7
  • 8. THE TEXAS HOUSING MARKETS AVERAGE ANNUAL % CHANGE IN HOME PRICES San Antonio Austin Dallas Ft. Worth Houston Texas 16 14 3Q09 Austin = -0.6% 12 10 8 6 4 2 0 -2 -4 3Q99 3Q00 3Q01 3Q02 3Q03 3Q04 3Q05 3Q06 3Q07 3Q08 3Q09 SOURCE: FHFA © Copyright Metrostudy 2010 8
  • 9. JOB GROWTH-MAJOR TEXAS MARKETS Annual Rate 2007, 2008 & Nov. 2009 120,000 87,000 76,000 2007 2008 Nov-09 70,000 22,500 26,100 24,800 9,900 20,000 4,800 -2,500 -6,200 -4,300 -30,000 -50,700 -80,000 -88,900 -130,000 HOUSTON DALLAS/FT. WORTH SAN ANTONIO AUSTIN SOURCE: Texas Workforce Commission © Copyright Metrostudy 2010 9
  • 10. AUSTIN ECONOMIC OVERVIEW Non-Ag Job Growth: Annual Totals 50,000 Net Job Losses Nov. ’08 to Nov. ’09 = 4,300 40,000 30,000 20,000 10,000 0 -10,000 Total Non-Ag -20,000 Employment 780,900 -30,000 1987 1989 1991 1993 1995 1997 1999 2001 2003 2005 2007 Nov- 09 Source: Texas Workforce Commission © Copyright Metrostudy 2010 10
  • 11. AUSTIN APARTMENT MARKET Occupancy/Rents 100% $1.25 OCCUPANCY 3Q09 $1.20 RENT RATE Avg. Rent = $.93/SF Avg. Occ. = 89% $1.15 95% $1.10 $1.05 90% $1.00 $0.95 85% $0.90 $0.85 80% $0.80 $0.75 75% $0.70 3Q99 3Q00 3Q01 3Q02 3Q03 3Q04 3Q05 3Q06 3Q07 3Q08 3Q09 Source: Austin Investor Interests © Copyright Metrostudy 2010 11
  • 12. AUSTIN RESALE MARKET-MLS STATISTICS Annual Closings History Closings 35,000 32,500 Nov. ‘09 Annual Closings = 20,758 30,000 27,500 25,000 22,500 20,000 17,500 15,000 12,500 10,000 Nov-99 Nov-00 Nov-01 Nov-02 Nov-03 Nov-04 Nov-05 Nov-06 Nov-07 Nov-08 Nov-09 Source: Real Estate Center © Copyright Metrostudy 2010 12
  • 13. AUSTIN RESALE MARKET - MLS STATISTICS Active Listings & Months of Supply Listings Nov. ’09 Months of Listings 9,836 Listings Supply 14,000 Months Supply 9 5.7 MOS 8 12,000 7 10,000 6 5 8,000 4 6,000 3 2 4,000 1 2,000 0 Nov-99 Nov-00 Nov-01 Nov-02 Nov-03 Nov-04 Nov-05 Nov-06 Nov-07 Nov-08 Nov-09 Source: Real Estate Center © Copyright Metrostudy 2010 13
  • 14. AUSTIN RESALE MARKET – MLS DATA Single Family MOS By Price Range-November 2009 MOS Previously Owned & New Construction 30 26.4 Prev. Owned New Const. 25.9 24 18 13.4 12 9.6 8.7 6.8 5.9 6.4 6.0 6.7 4.5 6.1 6 0 <$ 12 5 K $ 12 5 K- $ 17 5 K $ 17 5 K- $ 2 5 0 K $ 2 5 0 K- $ 4 0 0 K $ 4 0 0 K- $ 7 5 0 K >$ 7 5 0 K Source: ABOR © Copyright Metrostudy 2010 14
  • 15. AUSTIN RESALE MARKET-MLS STATISTICS Average & Median Price Trend $290,000 Nov. 2008 Avg. =$236,041 $265,000 (Single Family/TH/Condo) $240,000 Average Price $215,000 Median Price $190,000 $165,000 $140,000 Nov. 2008 Median= $115,000 $176,300 (Single Family) $90,000 1995 1996 1997 1998 1999 2000 2001 2002 2003 2004 2005 2006 2007 2008 Nov- 09 Source: Real Estate Center © Copyright Metrostudy 2010 15
  • 16. AUSTIN MLS CLOSED SALES Distributed by Sales Price YTD Sept. 2008 vs. YTD Sept. 2009 30% 25% 2008 2009 20% 15% 10% 5% 0% <$100K $100K-$150k $150K-$200K $200K-$300K $300K-$500K +$500K SOURCE: Austin Board of Realtors © Copyright Metrostudy 2010 16
  • 17. THE AUSTIN NEW HOME MARKET ANNUAL STARTS TREND: 2001 to 2009 Detached Housing 18,000 17,000 15,940 16,000 14,638 15,000 14,000 12,190 12,436 13,000 11,225 12,000 10,260 10,450 11,000 10,000 9,000 8,012 8,000 6,490 7,000 6,000 5,000 2001 2002 2003 2004 2005 2006 2007 2008 2009 © Copyright Metrostudy 2010 17
  • 18. THE AUSTIN NEW HOME MARKET ANNUAL STARTS TREND: 3Q06 to 4Q09 Detached Housing 18,000 16,502 17,000 15,940 16,000 14,540 15,000 14,009 14,000 13,152 12,436 13,000 11,543 12,000 10,399 11,000 10,000 9,315 9,000 8,012 8,000 7,301 6,587 6,511 6,490 7,000 6,000 5,000 3Q06 4Q06 1Q07 2Q07 3Q07 4Q07 1Q08 2Q08 3Q08 4Q08 1Q09 2Q09 3Q09 4Q09 © Copyright Metrostudy 2010 18
  • 19. THE AUSTIN NEW HOME MARKET ANNUAL STARTS & CLOSINGS 20,000 DETACHED HOUSING 18,000 Annual Closings 16,000 Annual Starts 14,000 12,000 10,000 8,000 6,000 6,490 Annual Starts 4,000 7,487 Annual Closings 2,000 0 4Q95 4Q96 4Q97 4Q98 4Q99 4Q00 4Q01 4Q02 4Q03 4Q04 4Q05 4Q06 4Q07 4Q08 4Q09 © Copyright Metrostudy 2010 19
  • 20. THE AUSTIN NEW HOME MARKET 2009 ANNUAL STARTS BY SUB-MARKET Detached Housing 1,400 1,264 1,200 1,000 833 800 734 608 600 536 433 368 400 308 300 203 166 172 200 0 C P / Le a n. R R oc k K y l e / B uda S W A us. P f l ug. G. Town M a nor D . Va l l e H ut t o S E A ust i n Dr . L. Tr a v i s S pr i ngs © Copyright Metrostudy 2010 20
  • 21. THE AUSTIN NEW HOME MARKET Annual Starts by Price Range The Detached Market 2006 2007 2008 2009 5,000 4,500 4,000 3,500 3,000 2,500 2,000 1,500 1,000 500 0 <$150 $150- $200- $300- $500- >$750 $200 $300 $500 $750 © Copyright Metrostudy 2010 21
  • 22. TOTAL NEW HOME INVENTORY TREND (Under Construction & Finished Vacant Units) Detached Housing 10,000 9,000 Under. Const. Inv. = 1,420 Units 8,000 Fin. Vac. Inv. = 1,703 Units Total Inv. = 3,494 Units 7,000 6,000 5,000 4,000 3,000 2,000 1,000 0 4Q89 4Q91 4Q93 4Q95 4Q97 4Q99 4Q01 4Q03 4Q05 4Q07 4Q09 © Copyright Metrostudy 2010 22
  • 23. THE AUSTIN NEW HOME MARKET Annual Starts/ Vacant Developed Lot Trend Lot Inventory MOS 30,000 The Detached Market 48 Annual Starts Vacant Developed Lots Months of Supply 42 25,000 36 20,000 30 24 15,000 18 12 10,000 6 5,000 0 4Q99 4Q00 4Q01 4Q02 4Q03 4Q04 4Q05 4Q06 4Q07 4Q08 4Q09 © Copyright Metrostudy 2010 23
  • 24. FORECLOSURE POSTING & SALES TREND Travis & Williamson Counties Annual Rate 13,000 12,000 Annual Postings 11,000 10,000 Annual Foreclosure Sales 9,000 8,000 7,000 6,000 5,000 Annual Postings + 61% from Jan. ’09 to Jan. ‘10 4,000 3,000 2,000 1,000 Annual Sales +24% from Dec. ’08 to Dec. ‘09 0 Jan-07 May-07 Sep-07 Jan-08 May-08 Sep-09 Jan-09 May-09 Sep-09 Jan-10 SOURCE: Real Estate Foreclosures © Copyright Metrostudy 2010 24
  • 25. Top 20 MSAs-Highest Rates of Home Appreciation Annual Change as of 3Q09 Wichita Falls, TX 6.0% Corpus Christi, 5.5% San Angelo, TX 5.4% Hinesville, GA 5.2% Texarkana, TX 4.7% Jonesboro, AR 4.5% Brownsville, TX 4.4% St. Joseph, MO- 3.7% Dubuque, IA 3.6% Midland, TX 3.5% Tyler, TX 3.4% Amarillo, TX 3.3% Wichita, KS 3.3% Abilene, TX 3.3% Lawton, OK 3.3% Sioux City, IA- 3.1% State College, PA 3.1% Pittsfield, MA 3.0% Burlington, NC 3.0% Elmira, NY 2.9% SOURCE: FHFA 0.0% 1.0% 2.0% 3.0% 4.0% 5.0% 6.0% 7.0% © Copyright Metrostudy 2010 25
  • 26. Bottom 20 MSAs-Lowest Rates of Home Appreciation Annual Change as of 3Q09 El Centro, CA -24.5% Las Vegas-Paradise, NV -22.5% Miami, FL -20.5% Bend, OR -19.4% Merced, CA -18.6% Reno-Sparks, NV -17.5% Phoenix-Mesa-Scottsdale, AZ -16.9% Lakeland-Winter Haven, FL -16.2% Port St. Lucie, FL -15.8% Ft. Lauderdale, FL -15.4% Visalia-Porterville, CA -14.9% Ocala, FL -14.9% Orlando-Kissimmee, FL -14.7% St. George, UT -14.0% Modesto, CA -13.9% Fresno, CA -13.8% Madera-Chowchilla, CA -13.6% Vallejo-Fairfield, CA -13.5% Prescott, AZ -13.4% Lake Havasu City-Kingman, AZ -13.4% -35% -30% -25% -20% -15% -10% -5% 0% SOURCE: FHFA © Copyright Metrostudy 2010 26
  • 27. STATES WITH HIGHEST SHARE OF NEGATIVE EQUITY AS OF THIRD QUARTER 2009 Oklahoma 6.0% TEXAS 11.0% New Mexico 11.0% Idaho 20.0% Ohio 20.0% Maryland 22.0% Virginia 24.0% Georgia 24.0% California 35.0% Michigan 37.0% Florida 45.0% Arizona 48.0% Nevada 65.0% 0% 10% 20% 30% 40% 50% 60% 70% SOURCE: First American Core Logic © Copyright Metrostudy 2010 27
  • 28. 0 5,000 10,000 15,000 20,000 25,000 Houston Dall as/Ft Wort h Orl ando Phoe ni x Mary land Aust in Austin San Antonio MD - C Northern Vi rginia Charlotte Cent Cal Inland Empir e Rale igh-Durha m NoVa-C Chicago © Copyright Metrostudy 2010 Atl anta Salt Lake City So Cal Coast Annual Starts Comparison Las Vegas National Comparison – 3Q09 Tampa San Francisc o Jack sonvi lle Nashvill e Minneapol is Denver 28
  • 29. 0 5,000 10,000 15,000 20,000 25,000 Chicago Orland o Atlanta Hou ston Phoenix Las Vegas San Francisco Dallas/Ft Worth So Cal Coast Maryland Inland Emp ire Char lotte Raleigh-Durham Denver Salt Lake City © Copyright Metrostudy 2010 North ern Virginia Cent C al Tamp a Jackso nville National Comparison – 3Q09 San Anto nio Minneapo lis Aust in Total New Housing Inventory - # of Units MD - C Austin NoVa-C Nashville 29
  • 30. 0 2,000 4,000 6,000 8,000 10,000 12,000 14,000 16,000 Orland o Atlanta Chicago Las Vegas Phoenix So Cal Coast Hou ston Dallas/Ft Worth San Francisco Maryland Char lotte Raleigh-Durham Jackso nville Denver Inland Emp ire © Copyright Metrostudy 2010 Tamp a Cent C al Minneapo lis National Comparison – 3Q09 Salt Lake City North ern Virginia Nashville San Anto nio Total Finished Vacant Inventory - # of Units Aust in MD - C Austin NoVa-C 30