
Empfohlen
Empfohlen
Weitere ähnliche Inhalte
Ähnlich wie Yelp q4 2014 earnings slides
Ähnlich wie Yelp q4 2014 earnings slides (20)
Kürzlich hochgeladen
Kürzlich hochgeladen (20)
Yelp q4 2014 earnings slides
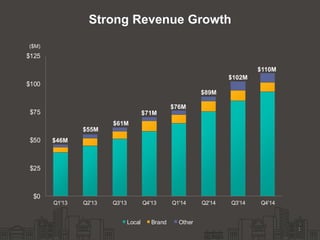
- 1. $0 $25 $50 $75 $100 $125 Q1'13 Q2'13 Q3'13 Q4'13 Q1'14 Q2'14 Q3'14 Q4'14 Local Brand Other Strong Revenue Growth 1 ($M) $46M $55M $61M $71M $76M $89M $102M $110M
- 2. 2Note: See Appendix for reconciliation to GAAP Net Income (Loss) for the periods presented Adj.EBITDA($M) Significant Operating Leverage $25M $20M $17M $9M $10M $8M$8M $3M
- 3. Compelling Metrics 3 Q4'13 Q4'14 Active Local Biz Accts1 12/31/13 12/31/14 71M 135M 94K Cumulative Reviews Unique Visitors* 53M 120M 67K 35% y/y 13% y/y 39% y/y * Per Google Analytics, average number of monthly “users” over a given three-month period 1 Number of active local business accounts from which we recognized revenue in the period Note: Cumulative number of reviews since inception, including reviews that have been removed or not recommended
- 4. Cohort Analysis – Local Revenue U.S. Market Cohort Number of Yelp Markets (1) Average Cumulative Reviews As of December 31, 2014 (2) Year-Over-Year Growth in Average Cumulative Reviews (3) Average Local Advertising Revenue Q4 2014 (4) Year-Over-Year Growth in Average Local Advertising Revenue (5) 2005 – 2006 Cohort 6 4,728 31% $6,523 52% 2007 – 2008 Cohort 14 1,026 34% $1,802 63% 2009 – 2010 Cohort 18 344 43% $470 78% (1) A Yelp market is defined as a city or region in which we have hired a Community Manager. (2) Average cumulative reviews is defined as the total cumulative reviews of the cohort as of December 31, 2014 (in thousands) divided by the number of markets in the cohort. (3) Year-over-year growth in average cumulative reviews compares the average cumulative reviews as of December 31, 2014 with that of December 31, 2013. (4) Average local advertising revenue is defined as the total local advertising revenue from businesses in the cohort over the three-month period ended December 31, 2014 (in thousands) divided by the number of markets in the cohort. (5) Year-over-year growth in average local advertising revenue compares the local advertising revenue in the three-month period ended December 31, 2014 with that of the same period in 2013. 4
- 5. High Engagement on Mobile 5 * Monthly average number of mobile unique visitors for the period indicated, calculated as number of “users” measured by Google Analytics accessing Yelp via mobile web plus unique devices accessing the app, each on a monthly average basis ** Clicks to calls and directions from the app and mobile web. Metrics for the current quarter. Q4'13 Q4'14 72M Mobile Unique Visitors* 53M ~45% new reviews from mobile** ~34M clicks for directions**~48M clicks to call** 37% y/y
- 6. GAAP vs. Non-GAAP EPS 6 ($) -$0.10 $0.00 $0.10 $0.20 $0.30 $0.40 $0.50 Q1'14 Q2'14 Q3'14 Q4'14 GAAP EPS Non-GAAP EPS Note: See Appendix for reconciliation to GAAP Net Income (Loss) for the periods presented $0.24 $0.20 $0.42 $0.17 $0.08 $0.05 $(0.04) $0.04
- 7. Adjusted EBITDA Reconciliation 7 ($M) Q1'13 Q2'13 Q3'13 Q4'13 2013 Q1'14 Q2'14 Q3'14 Q4'14 2014 Adjusted EBITDA Bridge Net Income / (Loss) ($4.8) ($0.9) ($2.3) ($2.1) ($10.1) ($2.6) $2.7 $3.6 $32.7 $36.5 + Tax & Other Expenses 0.2 0.3 0.5 0.2 1.2 (2.0) 0.4 0.9 (24.7) (25.4) + Depreciation & Amortization 2.5 2.6 2.8 3.5 11.5 3.7 4.0 4.6 5.3 17.6 + Stock Based Compensation* 4.6 5.7 7.0 8.8 26.1 9.5 10.1 10.9 11.8 42.3 + Restructuring & Integration 0.7 0.0 0.0 0.0 0.7 0.0 0.0 0.0 0.0 0.0 Adjusted EBITDA $3.2 $7.8 $8.1 $10.4 $29.4 $8.5 $17.2 $20.1 $25.1 $70.9 * Stock-based compensation for the twelve months ended December 31, 2013 excludes approximately $0.6 million of stock-based compensation already included in restructuring and integration costs.
- 8. Non-GAAP Net Income Reconciliation 8 ($M) Q1’14 Q2'14 Q3'14 Q4'14 2014 Non-GAAP Net Income Reconciliation Net Income / (Loss) ($2.6) $2.7 $3.6 $32.7 $36.5 + Stock Based Compensation 9.5 10.1 10.9 11.8 42.3 + Amortization of Intangible Assets 0.6 0.6 0.6 0.6 2.4 + Valuation Allowance Release (2.0) 0.0 0.0 (26.2) (28.2) Non-GAAP Net Income $5.5 $13.4 $15.1 $18.9 $53.0 GAAP diluted shares 71.2 77.1 77.3 77.2 76.7 Non-GAAP Net Income Per Share $0.08 $0.17 $0.20 $0.24 $0.69