
Empfohlen
Empfohlen
Weitere ähnliche Inhalte
Was ist angesagt?
Was ist angesagt? (17)
Andere mochten auch
Andere mochten auch (8)
Ähnlich wie Developments in the monetary policy arena
Ähnlich wie Developments in the monetary policy arena (20)
Mehr von videoaakash15
Mehr von videoaakash15 (20)
Kürzlich hochgeladen
Kürzlich hochgeladen (20)
Developments in the monetary policy arena
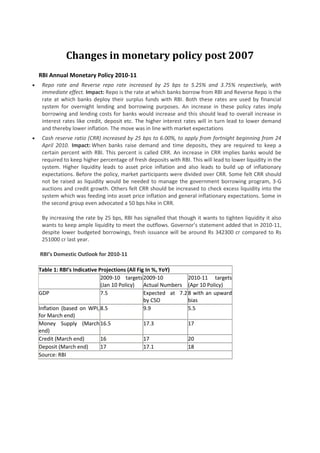
- 1. Changes in monetary policy post 2007 RBI Annual Monetary Policy 2010-11 Repo rate and Reverse repo rate increased by 25 bps to 5.25% and 3.75% respectively, with immediate effect. Impact: Repo is the rate at which banks borrow from RBI and Reverse Repo is the rate at which banks deploy their surplus funds with RBI. Both these rates are used by financial system for overnight lending and borrowing purposes. An increase in these policy rates imply borrowing and lending costs for banks would increase and this should lead to overall increase in interest rates like credit, deposit etc. The higher interest rates will in turn lead to lower demand and thereby lower inflation. The move was in line with market expectations Cash reserve ratio (CRR) increased by 25 bps to 6.00%, to apply from fortnight beginning from 24 April 2010. Impact: When banks raise demand and time deposits, they are required to keep a certain percent with RBI. This percent is called CRR. An increase in CRR implies banks would be required to keep higher percentage of fresh deposits with RBI. This will lead to lower liquidity in the system. Higher liquidity leads to asset price inflation and also leads to build up of inflationary expectations. Before the policy, market participants were divided over CRR. Some felt CRR should not be raised as liquidity would be needed to manage the government borrowing program, 3-G auctions and credit growth. Others felt CRR should be increased to check excess liquidity into the system which was feeding into asset price inflation and general inflationary expectations. Some in the second group even advocated a 50 bps hike in CRR. By increasing the rate by 25 bps, RBI has signalled that though it wants to tighten liquidity it also wants to keep ample liquidity to meet the outflows. Governor’s statement added that in 2010-11, despite lower budgeted borrowings, fresh issuance will be around Rs 342300 cr compared to Rs 251000 cr last year. RBI’s Domestic Outlook for 2010-11 Table 1: RBI’s Indicative Projections (All Fig In %, YoY) 2009-10 targets 2009-10 2010-11 targets (Jan 10 Policy) Actual Numbers (Apr 10 Policy) GDP 7.5 Expected at 7.2 8 with an upward by CSO bias Inflation (based on WPI, 8.5 9.9 5.5 for March end) Money Supply (March 16.5 17.3 17 end) Credit (March end) 16 17 20 Deposit (March end) 17 17.1 18 Source: RBI
- 2. Growth: RBI revised its growth forecast upwards for 2010-11 at 8% with an upward bias compared to 2009-10 figure of 7.5%. It said “Indian economy is firmly on the recovery path.” RBI’s business outlook survey shows corporate are optimistic over the business environment. Growth in industrial sector and services has picked up in second half of 2009-10 and is expected to continue. The exports and import sector has also registered a strong growth. It is important to note that RBI has placed the growth under the assumption of a normal monsoon. India could have achieved a near 8% growth in 2009-10 itself, if monsoons were better. Table 2 looks at growth forecasts of Indian economy for 2010-11 by various agencies. Table 2:Projections of GDP Growth by various agencies for 2010-11 (in %, YoY) 2009-10 2010-11 RBI 7.5 with an upward 8 with an upward bias bias PM’s Economic Advisory Council 7.2 8.2 Ministry of Finance 7.2 8.5 (+/- 0.25) IMF 6.7 8 Asian Development Bank 7.2 8.2 OECD 6.1 7.3 RBI’s Survey of Professional 7.2 8.5 Forecasters Inflation: RBI’s inflation projection for March – 11 is at 5.5% compared to FY March-10 estimate of 8.5% with an upward bias (the final figure was at 9.9%). RBI said inflation is no longer driven by supply side factors alone. First WPI non-food manufactured products (weight: 52.2 per cent) inflation, increased sharply from (-) 0.4%in November 2009, to 4.7% in March 2010. Fuel price inflation also surged from (-) 0.7 per cent in November 2009 to 12.7% in March 2010. Further, contribution of non-food items to overall WPI inflation, which was negative at (-) 0.4% in November 2009 rose sharply to 53.3% by March 2010. So, overall demand pressures on inflation are also beginning to show signs. These movements were visible in March 2010 itself, pushing RBI to increase rates before the official policy in April 2010. Monetary Aggregates: RBI has increased the projections of all three monetary aggregates for 2010-11. These projections have been made consistent with higher expected growth in 2010-11. Higher growth will lead to more demand for credit. Then management of government borrowing program will remain a challenge as well. High growth coupled with the borrowing program will need higher financial resources. Therefore, projections for money supply, credit and deposit are raised to 17%, 20% and 18% respectively. However, higher growth in money supply would also lead to build up of higher inflation and inflationary expectations. There are various measures to calculate money supply. Each measure can be classified by placing it along a spectrum between narrow and broad monetary aggregates. Narrow money includes most acceptable and liquid forms of payment like currency and bank demand deposits. Broad money includes narrow money and other kinds of bank deposits like time deposits, post office savings account etc.
- 3. These different types of money are typically classified as Ms. The number of Ms usually range from M0 (narrowest) to M3 (broadest) but which Ms are actually used depends on the system. There are four Ms in India: o M1: Currency with the public + Demand Deposits + Other deposits with the RBI. o M2: M1 + Savings deposits with Post office savings banks. o M3: M1+ Time deposits with the banking system o M4: M3 + All deposits with post office savings banks (excluding National Savings Certificates). Growth in M3 is higher than M1 between April-November 2009. From Dec-2009 onwards, the growth rate in M1 is higher than M3. The difference in M1 and M3 comes from the growth rate in time and demand deposits. Growth in Time deposits is higher than demand deposits between April-November 2009. From December 2009, onwards growth in demand deposits picks up. This in turn reflects in differences in growth rate of M1 and M3. The growth rate in currency is volatile. It declines 15% in August 2009 and then again increases to 17.9% in December 2009. It then declines to 15.6% in March 2010. Hence, the difference between M1 and M3 comes from surge in growth of demand deposits and decline in growth of time deposits. This could be interpreted in two ways. First, spending on consumption and production is increasing as economy has recovered from recession. Second, it could be people are spending now as they expect higher inflation in future. Higher inflation in future could also lead to higher returns on assets and property in future; therefore people prefer to spend now. It will be interesting to watch trends in M1 and M3 from now on as well. RBI also outlined downside risks with its projections: First, there is still substantial uncertainty about the pace and shape of global recovery Second, if the global recovery does gain momentum, commodity and energy prices, which have been on the rise during the last one year, may harden further. This could put upwards pressure on inflation Third, monsoon will continue to play a vital role both from domestic demand and inflation perspective. Fourth, policies in advanced economies are likely to remain highly expansionary. High liquidity in global markets coupled with higher growth in emerging economies foreign capital flows are expected to remain higher. This will put pressure on exchange rate policy. RBI usually does not comment on its exchange rate policy. As the economic situation is exceptional, RBI also commented on India’s exchange rate policy. Our exchange rate policy is not guided by a fixed or pre-announced target or band. Our policy has been to retain the flexibility to intervene in the market to manage excessive volatility and disruptions to the macroeconomic situation. Recent experience has underscored the issue of large and often volatile capital flows influencing exchange rate movements against the grain of economic fundamentals and current account balances. There is, therefore, a need to be vigilant against the build-up of sharp and volatile exchange rate movements and its potentially harmful impact on the real economy.
- 4. Policy Stance The policy stance remains unchanged from January 2010 policy. Table 3: Comparing RBI’s Policy Stance October 2009 Policy January 2010 Policy April 2010 Policy Watch inflation trend and be Anchor inflation expectations, prepared to respond swiftly while being prepared to respond appropriately, swiftly and effectively Monitor liquidity to meet and effectively to further of inflationary credit demands of productive build-up sectors while securing price pressures. Anchor inflation expectations, while being prepared to respond appropriately, swiftly and effectively to further build-up of inflationary pressures. Actively manage liquidity to ensure that the growth in demand for credit by both the private and public sectors is satisfied in a non-disruptive way. Actively manage liquidity to ensure that the growth in demand for credit by both the private and public sectors is satisfied in a non-disruptive way. and financial stability Maintain monetary and interest rate regime consistent with price and financial stability, and supportive of the growth process Maintain an interest rate Maintain an interest rate regime consistent with price, regime consistent with price, output and financial stability. output and financial stability. Source: RBI Summary: Given the economic outlook, policy ahead is going to remain challenging. There are many trade-offs RBI has to manage. It needs to manage high inflation without impacting the growth process. The recent inflation numbers show rising demand side pressures on inflation. The market participants are already looking at an increase of around 100-150 bps by March 2011 end. The higher interest rates would make it difficult to manage the government borrowing program and also invite more capital flows. High interest rates could also lead to higher lending costs for the corporate sector. The challenges are not limited to domestic factors alone. The concerns remain on future outlook of advanced economies which complicates the policy process further. Other Development and Regulatory Policies In its Annual (in April) and Mid-term review (in October) of monetary policy, RBI also covers developments and proposed policy changes in financial system. Some of the developments announced in this policy are: New Products/Changes in guidelines Currently, Interest rate futures contract is for 10 year security. RBI has proposed to introduce Interest rate futures for 2 year and 5 year maturities as well. RBI has permitted recognised stock exchanges to introduce plain vanilla currency options on spot US Dollar/Rupee exchange rate for residents Final guidelines for regulation of non- convertible debentures of maturity less than one year by end-June 2010
- 5. RBI had proposed to introduce plain vanilla Credit Default Swaps in October 2009 policy. RBI would place a draft report on the same by end- July 2010 Earlier, banks could hold infrastructure bonds in either held for trading or available for sale category. This was subject to mark to market requirements. However, most banks hold these bonds for a long period and are not traded. From now on, banks can classify such investments having a minimum maturity of seven years under held to maturity category. This should lead banks to buy higher amount of infrastructure bonds and push infrastructure activity. The activity in Commercial Papers and Certificates of deposit market is high but there is little transparency. FIMMDA has been asked to develop a reporting platform for Commercial Papers and Certificates of deposit. Setting up New Banks Finance Minister, in his budget speech on February 26, 2010 announced that RBI was considering giving some additional banking licenses to private sector players. NBFCs could also be considered, if they meet the Reserve Bank’s eligibility criteria. In line with the above announcement, RBI has decided to prepare a discussion paper on the issues by end-July 2010 for wider comments and feedback. In 2004 seeing the financial health of urban cooperative banks, it was decided not to set up any new UCBs. Since then the performance of these banks has improved. It has been decided to set up a committee to study whether licences for opening new UCBS can be done. In February 2005, the Reserve Bank had released the ‘roadmap for presence of foreign banks in India’. The roadmap laid out a two-phase, gradualist approach to increase presence of foreign banks in India. The first phase was between the period March 2005 – March 2009, and the second phase after a review of the experience gained in the first phase. In the first phase, foreign banks wishing to establish presence in India for the first time could either choose to operate through branch presence or set up a 100% wholly-owned subsidiary (WOS), following the one-mode presence criterion. Foreign banks already operating in India were also allowed to convert their existing branches to WOS while following the one-mode presence criterion. However, because of the global crisis the second phase which was due in April 2009, could not be started. The global financial crisis has also thrown some lessons for policymakers. Drawing these lessons RBI would put up a discussion paper on the mode of presence of foreign banks through branch or WOS by September 2010. DEVELOPMENTS IN THE MONETARY POLICY ARENA: The outflow of foreign exchange, as a fall out of the crisis, also meant tightening of liquidity situation in the economy. To deal with the liquidity crunch and the virtual freezing of international credit, the monetary stance underwent an abrupt change in the second half of 2008/09. The RBI responded to the emergent situation by facilitating monetary expansion through decreases in the CRR, RR and RRR rates, and the statutory liquidity ratio (SLR). The RR was reduced by 400 basis points in five tranches from 9.0 in August 2008 to 5.0 percent beginning March 5, 2009. The R-RR was lowered by 250 basis points in three tranches from 6.0 (as was prevalent in November 2008) to 3.5 percent from March 5, 2009. The R-RR and RRs were again reduced by 25 basis points each with effect from April, 2009. SLR was lowered by 100 basis points from 25 percent of net demand and time liabilities (NDTL) to 24 percent with effect from the fortnight beginning November 2008. The CRR was lowered by 400 basis points in four tranches from 9.0 to 5.0 percent with effect from January 2009.
- 6. 10.00 9.00 8.00 7.00 6.00 5.00 4.00 3.00 2.00 1.00 0.00 Repo rate Reverse repo rate Dec-06 Apr-07 Aug-07 Dec-07 Apr-08 Aug-08 Dec-08 Apr-09 Aug-09 Mar-10 Jul-10 Nov-10 Cash-reserve ratio It decided to retain the repo rate at 6.25 per cent and the reverse repo rate at 5.25 per cent under its Liquidity Adjustment Facility (LAF). It also retained the Cash Reserve Ratio (CRR) at 6 per cent of net demand and time liabilities (NDTL) of scheduled banks as per 2010 annual report. The credit policy measures by the RBI broadly aimed at providing adequate liquidity to compensate for the squeeze emanating from foreign financial markets and improving foreign exchange liquidity. At the same time, it was necessary to ensure that the financial contagion arising from the global financial crisis did not permeate the Indian banking system. These measures were therefore supplemented by sector- specific credit measures for exports, housing, micro and small enterprises and infrastructure. The monetary measures had a salutatory effect on the liquidity situation. The weighted average call money market rate, which had crossed the LAF corridor at several instances during the first half of 2008-09, remained within the LAF corridor after October 2008. Since mid2008-09, the growth in reserve money decelerated after September 2008. The deceleration in M0 was largely on account of the decline in net foreign exchange assets of RBI (a major determinant of reserve money growth) due to reduced capital inflows. On the other hand, the net domestic credit of the RBI expanded due to an increase in net RBI credit to the Central Government in the second half of the year. Taking the year as whole, broad money (M3) recorded an increase of 18.4 percent during 2008-09, as against 21.2 percent in 2007-08. The money multiplier, which is the ratio of M3 to M0 was 4.3 in end-March 2008 and increased to 5.0 in December 2008.The credit situation seems to be recovering. The credit off-take in the economy that collapsed due to the financial crisis reached its lowest level during the month of December 2008 when the non-food credit tanked to 0.7 percent on a seasonally adjusted m-o-m basis. But some signs of recovery can be seen in the credit off take during June and July 2009 on the seasonally adjusted m-o-m basis when the non food credit grew above 20 percent. However on a y-o-y basis, the non-food credit growth has come down to 17 percent (2009) after the October freeze of the credit markets as compared to the 25 percent average growth seen in the full year 2008.In the first quarter review of monetary policy 2009-10, the RBI maintained a GDP growth forecast of 6 percent for 2009-10. It raised the WPI inflation forecast to 5 percent at the end of March 2010 from 4 percent it did in April 2009. The RBI kept all policy rates (repo rate, reverse repo rate and cash reserve ratio) unchanged. The reason for a pause in monetary easing was that the central bank now considered inflation to be a cause of worry. In India, year-on-year change in wholesale price index is used as the measure of inflation. It has been pointed out that month-on-month changes captures the recent trends whereas year on-year changes capture the cumulated changes over a longer period. But month-on-month changes suffer from seasonality and, therefore, it is argued that a deseasonlized price series would better represent
- 7. the recent inflation. The wholesale price index has long been discarded by countries for measuring inflation. The Economic Survey 2008-09 notes that 157 countries out of 181 countries in the IMF statistics use consumer price index (CPI) for tracking inflation. India does not have an aggregate CPI, but computes sectional CPIs for the four different consumer categories (agricultural labour, rural labor, industrial worker and urban non-manual employee).The month-to-month annualized seasonally-adjusted CPI indicates that India had a double digit inflation phase during FebruarySeptember 2008 and inflation is remaining high at about 8 percent in recent months. On a year-onyear basis, the CPI inflation remained at about 10 percent since August 2008. Another consideration for monetary policy is the level of real interest rate. If the real interest rate is high then there is a case for lowering policy rates by the central bank. The average prime lending rate (PLR) of banks adjusted for year-on-year CPI inflation is a good measure of the emerging real interest rate in the economy. Real interest rate has fallen from above 7.5 percent in December 2007 to 2-3 percent in recent months. The WPI inflation which is the headline inflation for India has plummeted to the negative territory on the basis of year-on-year (y-o-y) growth as of July 2009 (-1.6%). However, this negative rate is a high base effect phenomenon mainly concentrated in items like iron & steel and fuel group which due to the upward commodity price shock last year have been registering negative double digit growth this year. In the WPI basket during April-July 2009, iron & steel prices contracted by 20 percent whereas the fuel group shrank by 10 percent thus pushing the aggregate WPI inflation in the negative territory. However, prices have been rising for items like fruits & vegetables (15.2%, July 2009) with prices of primary articles in general growing around 5 percent (July 2009). The inflationary scenario becomes much clearer once we take seasonally adjusted month on month WPI inflation rates. The seasonally adjusted month on month WPI inflation had seen a sudden spurt in the month of July 2009 to 8.3 percent. This compares with the CPI (IW) situation where m-om seasonally adjusted rate was around 11.4 percent (June 2009) and the y-o-y rate is also hovering around 9.3 percent. High food inflation has been the main factor driving the overall inflation rate. Food constraint has not only driven up prices, but also threatens to limit India’s overall growth potential. In the 2010/11 budget presented to the parliament on February 26, the finance minister acknowledged this challenge and outlined a four-pronged strategy to boost agricultural growth. However, most of the measures announced in the budget are likely to help only in the medium to long run. Here are some of the measures announced: • Credit support to farmers: Banks have been consistently meeting the targets set for agriculture credit flow in the past few years. For the year 2010-11, the target has been set at Rs.375, 000 crore (US$ 81 billion). • Rs. 200 crore (US$ 43 million) provided for sustaining the gains already made in the green revolution areas through conservation farming, which involves concurrent attention to soil health, water conservation and preservation of biodiversity. • Concessional customs duty of 5 percent to specified agricultural machinery not manufactured in India. • Government to address the issue of opening up of retail trade. It will help in bringing down the considerable difference between farm gate, wholesale and retail prices. • In addition to the ten mega food park projects already being set up, the Government has decided to set up five more such parks. Besides, the measures announced do not make for an agricultural reforms agenda that tackle the problems caused by government control over inputs, production and marketing – an agenda that is critical to ease the food constraint. There is also little in the budget to indicate an effective short-
- 8. term food inflation management strategy. Reforms are needed in the agriculture sector to address structural constraints inhibiting productivity and income gains. However, in the immediate future food prices can be controlled only through large imports, especially in the case of rice where stocks are inadequate. Economic Recovery: From all accounts, except for the agricultural sector as noted above, economic recovery seems to be well underway. Economic growth stood at 7 percent during the first half of the current fiscal year and the advance estimates for GDP growth for 2009-10 is 7.2 percent. The recovery in GDP growth for 2009-10, as indicated in the advance estimates, is broad based. Seven out of eight sectors/subsectors show a growth rate of 6.5 percent or higher. The exception, as of April 2010 9 anticipated, is agriculture and allied sectors where the growth rate is estimated to be minus 0.2 percent over 2008 09. Sectors including mining and quarrying; manufacturing; and electricity, gas and water supply have significantly improved their growth rates at over 8 percent in comparison with 2008-09. When compared to countries across the world, India stands out as one of the best performing economies. Although there is a clear moderation in growth from 9 percent levels to 7+ percent, the pace still makes India the fastest growing major economy after the People’s Republic of China. In order for India’s growth to be much more inclusive than what it has been, much higher level of public spending is needed in sectors, such as health and education along with the implementation of sectarian reforms so as to ensure timely and efficient service delivery. Plan allocations for 2010-11 for the social sectors have been stepped up, as can be seen from the figures below, this process however needs to be strengthened and sustained over time. Inclusive Development: • The spending on social sector has been increased to Rs.137,674 crore (US$ 30 billion) in 2010-11, which is 37 percent of the total plan outlay in 2010-11. • Another 25 percent of the plan allocations are devoted to the development of rural infrastructure. Education • Plan allocation for school education increased by 16 percent from Rs.26,800 (US$ 6 billion) in 2009-10 to Rs.31,036 crore (US$ 7 billion) in 2010-11. • In addition, States will have access to Rs.3,675 crore (US$ 792 million) for elementary education under the Thirteenth Finance Commission grants for 2010-11. Health • Plan allocation to Ministry of Health & Family Welfare increased from Rs 19,534 crore (US$ 4 billion) in 2009-10 to Rs 22,300 crore (US$ 5 billion) for 2010-11. As expected, the measures undertaken by government of India to counter the effects of the global meltdown on the Indian economy have resulted in shortfall in revenues and substantial increases in government expenditures, leading to deviation from the fiscal consolidation path mandated under the Fiscal Responsibility and Budget Management (FRBM) Act. The gross tax to GDP ratio which increased to an all time high of 12 percent in 2007-08, thanks to the economy riding on a high growth trajectory, has steadily declined to 10.9 percent in 2008-09 and 10.3 per cent in 2009-10 due to moderation in growth and reduction in tax/duty rates. At the same time, total expenditure as percentage of GDP has increased from 14.4 percent in 2007-08 to 15.9 percent in 2008-09 and 16.6 percent in 2009-10. The fiscal expansion in the last 2 years has resulted in higher fiscal deficit of 6 percent of GDP in 2008-09 and 6.7 percent in 2009-10. Moreover, the
- 9. revenue deficit as percentage of GDP has worsened to 4.5 percent and 5.3 percent in 2008-09 and 2009-10 respectively. The revenue deficit and fiscal deficit in 2009-2010 are higher than the targets set under the FRBM Act and Rules. Of course, the deviation from the mandate under FRBM Act and Rules was resorted to with the objective of keeping the economy on a high growth trajectory amidst global slowdown by creating demand through increased public expenditures in identified sectors. While the intent of the government, it says is to bring the fiscal deficit under control with institutional reform measures encompassing all aspects of fiscal management such as of April 2010 10 subsidies, taxes, disinvestment and other expenditures as indicated in the Budget 2009-10, there is unfortunately no movement on any of these fronts, Considering the current inflationary strains, the as yet excessive pre-emption of the community’s savings by the government, the potential for crowding out the requirements of the enterprise sector, and rising interest payments on government debt, it is extremely essential to reduce the fiscal deficit, and more aggressively, mainly by lowering the revenue deficit. Correction of these deficits would, inter alia, require considerable refocusing and reduction of large hidden subsidies associated with under-pricing in crucial areas, such as power, irrigation, and urban transport. Food and fertilizer subsidies are other major areas of expenditure control. Be that as it may, the process of fiscal consolidation needs to be accelerated through more qualitative adjustments to reduce government dissavings and ameliorate price pressures. The step-up in India's growth rate over much of the last two decades was primarily due to the structural changes in industrial, trade and financial areas, among others, over the 1990s as the reforms in these sectors were wide and deep and hence contributed significantly to higher productivity of the economy. Indeed, there is potential for still higher growth on a sustained basis of 9+ percent in the years ahead, but among other things, this would require the following: (I) Revival and a vigorous pursuit of economic reforms at the centre and in the states; (II) A major effort at raising the rate of domestic savings, especially by reducing government dissavings at the central and state levels through cuts in, and refocusing of, explicit and implicit subsidies, stricter control over non-developmental expenditures, improvements in the tax ratio through stronger tax enforcement, and strengthening incentives for savings; (III) Larger investments in, and better performance of, infrastructural services, both in the public and private sectors; and (IV) Greater attention to, and larger resources for, agriculture, social sectors and rural development programs to increase employment, reduce poverty and for creating a mass base in support of economic reforms. In conclusion, if India does attain and sustain growth rates of around 9+ percent that it had achieved prior to the crisis, this itself is likely to push up its domestic savings in the next few years. Besides, stronger growth should attract more foreign savings, especially foreign direct investment, and thus raise the investment rate.
- 10. 8.0 7.0 6.0 5.0 Off-budget 4.0 Budget 3.0 2.0 1.0 0.0 2005 2006 2007 2008 2009 2010 2011 Central government deficit INDUSTRY IN LINE WITH RBI MONETARY POLICY CHANGES Industry today widely welcomed the changes introduced in the credit policy review, commending it for pausing on rate hikes and injecting liquidity into the banking system by lowering the Statutory Liquidity Ratio (SLR) by one percentage point. It said this will help short-term rates to cool down and help maintain stability in the macroeconomic environment. The Reserve Bank of India (RBI) in its policy review earlier in the day kept key interest rates on hold, but said inflation was significantly above its comfort level. However, the RBI brought down the SLR, or the minimum mandated amount of bonds that banks need to keep as a percentage of deposits, to 24 per cent from 25 per cent. It decided to retain the repo rate at 6.25 per cent and the reverse repo rate at 5.25 per cent under its Liquidity Adjustment Facility (LAF). It also retained the Cash Reserve Ratio (CRR) at 6 per cent of net demand and time liabilities (NDTL) of scheduled banks.