![[object Object],[object Object],[object Object],[object Object],[object Object],[object Object],[object Object],[object Object],[object Object],[object Object],[object Object],[object Object],[object Object],Why LFP Rate of Older Males Declined](data:image/gif;base64,R0lGODlhAQABAIAAAAAAAP///yH5BAEAAAAALAAAAAABAAEAAAIBRAA7)
Empfohlen
Weitere ähnliche Inhalte
Andere mochten auch
Andere mochten auch (20)
Ähnlich wie Family3 Time
Ähnlich wie Family3 Time (18)
Mehr von victoriavernon
Kürzlich hochgeladen
Kürzlich hochgeladen (20)
Family3 Time
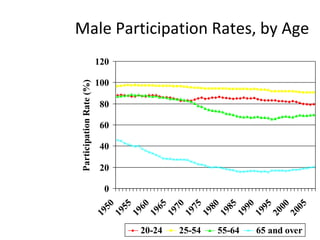
- 1. Male Participation Rates, by Age
- 3. Female Participation Rates, by Age Most of the rise in participation rate is due to a rise in participation among married women . This is a surprising result since the rise in real wages of married men would have tended to decrease participation rates of married women
- 7. Female Participation Rates, by Race
- 8. Male Participation Rates, by Race
- 11. Why Have Hours of Work Remained Stable since 1945
- 19. Budget Constraint Leisure Income/day 24 0 Budget constraint shows the combinations of income and leisure that a worker could get given a wage rate $120 At a wage rate of $5, a worker could get a maximum income of $120 per day ($5/hour * 24 ) At a wage rate of $10, a worker could get a maximum income of $240 per day. At a wage rate of $15, worker could get a maximum income of $360 per day. $240 $360 Slope of budget constraint (rise/run) = wage rate
- 20. Utility Maximization Leisure Income/day 24 0 The optimal or utility maximizing point is where the budget constraint is tangent to the highest attainable indifference curve $240 U 1 U 2 U 3 16 $80 A At a wage rate of $10/hour, the optimal hours of leisure is 16 (8 hours of work) at point A $360
- 21. Utility Maximization Leisure Income/day 24 0 The optimal or utility maximizing point is where the budget constraint is tangent to the highest attainable indifference curve $240 U 2 U 3 16 $80 A If the wage rate rises to $15/hour, the optimal hours of leisure is 15 at point B B At a wage rate of $10/hour, the optimal hours of leisure is 16 (8 hours of work) at point A 15 $360
- 22. Utility Maximization Leisure Income/day 24 0 $240 U 2 U 3 15 16 17 $80 A Income effect is measured through a parallel shift of the old budget constraint, from A to C (from 16 to 17 hours of leisure). Substitution effect is measured by movement along U 3 , from C to B (from 17 to 15 hours of leisure). Net effect is an increase of hours of work by 1 hour. B C Income and substitution effects
Hinweis der Redaktion
- 08/31/09
- 08/31/09
- 08/31/09
- 08/31/09
- 08/31/09
- 08/31/09
- 08/31/09
- 08/31/09
- 08/31/09
- 08/31/09
- 08/31/09
- 08/31/09
- 08/31/09
- 08/31/09
- 08/31/09
- 08/31/09
- 08/31/09