1. J. Phycol. 44, 1335–1339 (2008)
Ó 2008 Phycological Society of America
DOI: 10.1111/j.1529-8817.2008.00564.x
NOTE
INTERCOLONIAL VARIABILITY IN MACROMOLECULAR COMPOSITION IN
P-STARVED AND P-REPLETE SCENEDESMUS POPULATIONS REVEALED BY
INFRARED MICROSPECTROSCOPY 1
Philip Heraud2
Centre for Biospectroscopy and School of Chemistry, Monash University, 3800 Victoria, Australia
School of Biological Sciences, Monash University, 3800 Victoria, Australia
Slobodanka Stojkovic
School of Biological Sciences, Monash University, 3800 Victoria, Australia
John Beardall
Centre for Biospectroscopy and School of Chemistry, Monash University, 3800 Victoria, Australia
School of Biological Sciences, Monash University, 3800 Victoria, Australia
Don McNaughton and Bayden R. Wood
Centre for Biospectroscopy and School of Chemistry, Monash University, 3800 Victoria, Australia
Macromolecular variability in microalgal popula- tion method compared with soft independent model-
tions subject to different nutrient environments was ing by class analogy (SIMCA).
investigated, using the chlorophyte alga Scenedesmus
Key index words: FTIR spectroscopy; macromole-
´
quadricauda (Turpin) Breb. as a model organism.
cular composition; nutrient limitation; population
The large size of the four-cell coenobia in the strain
variability; Scenedesmus
used in this study (35 lm diameter) conveniently
allowed high quality spectra to be obtained from indi- Abbreviations: FTIR, Fourier transform infrared;
vidual coenobia using a laboratory-based Fourier PCA, principal component analysis; PLS-DA,
transform infrared (FTIR) microscope with a con- partial least squares discriminant analysis; SIMCA,
ventional globar source of IR. By drawing sizable soft independent modeling by class analogy
subpopulations of coenobia from two Scenedesmus
cultures grown under either nutrient-replete or
P-starved conditions, the population variability in
macromolecular composition, and the effects of FTIR spectroscopy has recently emerged as a new
nutrient change upon this, could be estimated. On technique to monitor changes in macromolecular
average, P-starved coenobia had higher carbohydrate components, such as lipids, proteins, and carbohy-
and lower protein absorbance compared with drates, in microalgae (see Heraud et al. 2007 for a
P-replete coenobia. These parameters varied between review). We have previously demonstrated, by com-
coenobia with histograms of the ratio of absorbance parison with conventional compositional assays, that
of the largest protein and carbohydrate bands being FTIR spectroscopy can accurately measure relative
Gaussian distributed. Distributions for the P-replete changes in macromolecular composition in microal-
and P-starved subpopulations were nonoverlapping, gae. The rapid, simultaneous measurement from
with the difference in mean ratios for the two popula- very small quantities of algal sample allows frequent
tions being statistically significant. Greater variance monitoring of macromolecular changes in microal-
was observed in the P-starved subpopulation. In gal cultures of small volume, hitherto impossible
addition, multivariate models were developed using using conventional chemical analyses. Macromolecu-
the spectral data, which could accurately predict the lar change in microalgae was shown to be extremely
nutrient status of an independent individual coenobi- labile in response to changes in nutrient status
um, based on its FTIR spectrum. Partial least squares (Giordano et al. 2001).
discriminant analysis (PLS-DA) was a better predic- We extended this work, by using a high bril-
liance synchrotron source of IR light, to the in vivo
1
Received 12 March 2007. Accepted 25 April 2008.
analysis of single algal cells (Heraud et al. 2005).
2
Author for correspondence: e-mail phil.heraud@sci.monash. Significant changes in macromolecular composition
edu.au. were measured in Micrasterias cells that had been
1335
2. 1336 PHILIP HERAUD ET AL.
previously starved of nitrogen and subsequently resuspended in 100 mL of milliQ water. A 100 lL
resupplied with the missing nutrient. The study also aliquot of the P-replete culture and the P-starved
revealed variation in response to changes in nutri- culture was pipetted onto an IR transparent, 2 mm
ent status from cell to cell; however, the large size thick, polished, zinc selenide substrate. The sample
of the Micrasterias cells that were used (300 lm in was then desiccated under vacuum for several hours.
diameter) necessitated multiple measurements The dried cellular deposit on the substrate was
across individual cells, thus restricting the number placed on the FTIR microscope (Perkin-Elmer Life
of cells that were compared. and Analytical Sciences Inc., Waltham, MA, USA)
In this work, we investigated the macromolecular stage for spectral acquisition.
variability in microalgal populations subject to dif- Spectral acquisition. Spectra were collected on a
ferent nutrient environments, using the chlorophyte FTIR microspectrometer (Spectrum 2000 System,
alga S. quadricauda as a model organism. S. quadric- Perkin-Elmer Life and Analytical Sciences Inc.) fitted
auda exists as microcolonies, coenobia, comprised with a liquid-N2-cooled mercury-cadmium-tellurium
of either four or eight cells. The large size of the detector. The Perkin-Elmer system was controlled by
four-cell coenobia in the strain used in this study an IBM-compatible PC running Spectrum version
(35 lm diameter) conveniently allowed high qual- 1.0 software (Perkin-Elmer). The absorbance spectra
ity spectra to be obtained from individual coenobia were acquired between 4,000 and 700 cm)1, at a
using a laboratory-based FTIR microscope with a spectral resolution of 8 cm)1, with 32 scans co-
conventional globar source of IR. By drawing sizable added. The knife-edge aperture on the microscope
subpopulations of coenobia from two Scenedesmus was set with dimensions and orientation such that
cultures grown under either nutrient-replete or only the region of the coenobium was scanned. The
P-starved conditions, the population variability in aperture dimensions were typically 35 · 35 lm.
macromolecular composition, and the effects of Spectra were acquired from 25 coenobia in each of
nutrient change upon this, could be estimated. In the P-starved and nutrient-replete conditions. To
addition, multivariate models were developed using minimize differences between spectra due to base-
these data, which could accurately predict the nutri- line shifts, the spectra were baseline corrected using
ent status of an independent individual coenobium, the ‘‘Rubber Band’’ algorithm within the OPUS 5.5
based on its FTIR spectrum. (Bruker Optics Inc., Ettlinger, Germany) software
Organisms and growth conditions. S. quadricauda was using 16 baseline points and excluding the CO2
isolated from a pond on the Monash University band region. Spectra were vector normalized to
Clayton campus (37°47¢ S, 144°58¢ E). An axenic account for any differences in the sample thickness.
culture was cloned from a single four-cell coenobia Band assignments and data analysis. Band assign-
and maintained in modified Bourrelley medium ments are based on previous studies on algal cells
(Hegewald et al. 1994) at 25°C under continuous (Beardall et al. 2001, Giordano et al. 2001, Heraud
light at a photon flux of 150 lmol quanta Æ et al. 2005). Multivariate data analysis including
m)2 Æ s)1. The P-starved culture was obtained by principal component analysis (PCA) and SIMCA
harvesting coenobia from a midexponential nutri- analysis was performed using Unscrambler version
ent-replete culture by gentle centrifugation and 9.2 software (Camo, Oslo, Norway).
resuspending them in a growth medium lacking P, Figure 1 shows average spectra, each derived
at a density of 2.5 · 105 coenobia Æ mL)1 in a from 25 individual spectra from the two respective
volume of 2 L in a 4 L Erlenmeyer flask. Another nutrient conditions. Standard deviation spectra are
culture, referred to as the P-replete culture, was also shown in Figure 1. The standard deviation spec-
established at the same time and in the same man- tra were calculated from the standard deviation for
ner, except that the harvested coenobia were trans- each measured absorbance value across each sub-
ferred to nutrient-replete medium. The two cultures population of cells. Both P-starved and P-replete
were maintained in the growth conditions described average spectra display bands between 1,800 and
for 4 d, at which time subsamples were removed for 800 cm)1 from lipids, proteins, carbohydrates, and
IR microspectroscopic analysis. Coenobia density phosphorylated molecules and are similar to spectra
was determined using a Neubauer haemocytometer acquired from bulk samples of dried cells from
(Superior, Bad Mergentheim, Germany). other species of chlorophyte algae reported else-
Cell deposition for IR spectroscopy. Duplicate 10 mL where (Beardall et al. 2001, Heraud et al. 2005).
subsamples were withdrawn from each parental cul- The band at 1,730 cm)1 is attributable to the ester
ture (P starved and P replete) and transferred to carbonyl stretching vibration from lipids; the amide
centrifuge tubes. The tubes were centrifuged at I and II bands from protein occur at 1,650 and
600g for 5 min, the supernatants removed, and the 1,540 cm)1, respectively. Bands from the bending
resultant pellets resuspended in milliQ water (Milli- vibrations of methyl and methylene groups in lipids,
pore, Billerica, MA, USA). This process was repeated carbohydrates, and proteins occur at 1,450 and
twice to thoroughly wash the cells of growth 1,370 cm)1. The amide III band from protein
medium, which may otherwise interfere with the occurs at 1,300 cm)1. A band attributable to asym-
spectra. After the final wash, the cellular pellet was metric phosphodiester stretching vibrations occurs
3. I N T E R C O L O N I A L M A C R O MO L E C U L A R V A R I A B I L I T Y 1337
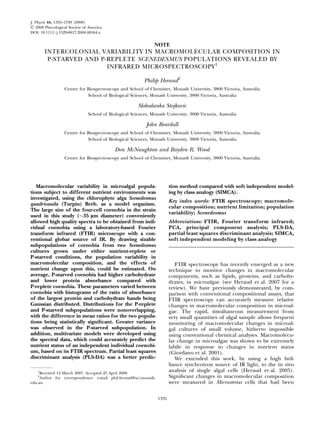
Fig. 2. The distribution of the ratio of absorbances at
1,020 cm)1, from carbohydrate, and at 1,650 cm)1, from protein,
in spectra from individual Scenedesmus coenobia drawn from
Fig. 1. Average spectra for the P-starved and P-replete spectra P-starved or P-replete cultures.
(n = 50) for the wavenumber range 1,800–800 cm)1 together with
the major band assignments (Giordano et al. 2001, Heraud et al.
2005). S.D. refers to spectra constructed from the standard devia- (Beardall et al. 2001, Giordano et al. 2001, Heraud
tion of all absorbance values at each measured wavenumber value et al. 2005, 2007, Liang et al. 2006).
for all cells in each nutrient condition. mas = asymmetric stretch, Figure 2 compares spectral difference between
m = stretch, das = asymmetric deformation (bend), ds = symmetric
deformation (bend).
individual coenobia in the P-replete and P-starved
populations using the ratio of the maximum absor-
bance of the most intense C-O stretching band from
at 1,250 cm)1, whereas the lower wavenumber region carbohydrate at 1,020 cm)1 to the maximum absor-
of the spectrum between 1,200 and 1,000 cm)1 is bance of the amide I band as a measure of the
dominated by a series of intense bands assigned to response to P starvation. The histogram shows that
C-O stretching from carbohydrates. the distribution of this ratio is clearly separated into
On average, the P-starved cells display lower two subdistributions, which appear to be Gaussian
amide I and amide II absorbances, compared with in nature. Indeed, the ratio means for the two nutri-
P-replete cells, whereas C-O stretching bands from ent conditions are significantly different (P starved,
carbohydrates were more intense in the P-starved 1.25 ± 0.04; P replete, 0.65 ± 0.01; P 0.001 t-test),
cells. Lipid ester carbonyl absorbance was similar and the D’Agostino-Pearson K2 test for normality
between P-starved and P-replete cells, as observed in reveals that it is highly probable that both distribu-
previous studies with P-starved and P-replete chloro- tions are Gaussian (P replete: P = 0.61, Kurtosis =
phyte algae (Beardall et al. 2001). Standard devia- )0.59, Skewness = 0.21; P starved: P = 0.31, Kurto-
tion spectra show that the P-starved cells were more sis = )0.27, Skewness = 0.61).
variable in terms of spectral absorbance compared Because spectral data are multivariate by nature,
with the P-replete cells, with the highest variability and hence average spectra or simple band ratios may
in the C-O stretching region of the spectrum. Sur- give an unreliable view of population variability, we
prisingly, given the differences in P availability employed PCA to explore spectral variability
between the two cultures, the asymmetric phospho- between the P-starved and P-replete subpopulations.
diester band appears to have similar absorbance in PC1 and PC2 explained 89% of the variance in the
average spectra from both the P-starved and data set. Figure 3 shows PC1 versus PC 2 score plots
P-replete coenobia. This finding was similar to for all spectra. P-starved and P-replete spectra were
that observed previously in comparisons between clearly separated into two clusters along PC1. The
P-starved and P-replete microalgal cells (Beardall loading plots (Fig. 3) show that the spectral regions
et al. 2001). We presently have no clear explanation accounting for most of the variation along PC1 are
for this result. Working hypotheses are that overall the amide bands and the C-O stretching bands,
intracellular concentrations of P do not change which are oppositely correlated to each other. This
enough under the P starvation to be detectable by finding confirms the observations made above, based
FTIR spectroscopy, or alternatively, P is removed upon the average spectra and the frequency distribu-
during P starvation from molecular pools not tion of band ratios, that differences in protein and
detectable by FTIR spectroscopy. carbohydrate absorbances contrast the FTIR spectra
The pattern of spectral changes observed under of P-starved and P-replete Scenedesmus coenobia.
P starvation—reduced protein and increased carbo- The spectral distinctness of P-starved and P-replete
hydrate—is the same as previously observed in a Scenedesmus coenobia was tested using two PCA-based
range of microalgae and cyanobacteria undergoing discrimination methods: SIMCA (Wold 1976) and
limitation by a major nutrient such as P or N PLS-DA (Geladi 1988). Each of the P-starved and
4. 1338 PHILIP HERAUD ET AL.
with all spectra in both P-starved and P-replete
validation sets correctly and unambiguously
assigned. In a manner similar to the SIMCA classifi-
cation, PLS models for PLS-DA were obtained using
full cross validation and employed four PCs. The
greater accuracy of PLS-DA over SIMCA observed in
this study is the same as reported for the classifica-
tion of nutrient status of algal cells using Raman
spectroscopy (Heraud et al. 2006).
FTIR microspectroscopy enables a new direct
measurement method to predict the nutrient status
of single microalgal coenobia. This method could
also be used for larger single cells (30 lm diame-
ter), and if synchrotron sources of IR are used, then
small individual cells (6 lm diameter; Levenson
et al. 2006) could be targeted. The advantage of sin-
gle coenobia or cell analysis over whole population
analysis is that population variability can be assessed.
This analysis is important because it has been shown
that cell populations respond to the environment in
ways often not predicted by measurement of the
average response (Zhao 1997, Dressel and Gunther
1999, Levsky and Singer 2003).
Apart from the spectroscopic method described
here, and Raman microspectroscopy, which can
measure variability in pigment content in individual
algal cells (Heraud et al. 2007), the only nonspectro-
Fig. 3. PC1 versus PC2 scores and PC1 and PC2 loading plots scopic phenotypic methods presently available that
for spectra from individual coenobia drawn from either P-starved can obtain data on population variability at the lev-
or P-replete growth conditions. All wavenumbers from 1,800 to els of individual coenobia or cells include flow cell
800 cm)1 were used in the principal component analysis (PCA)
analysis.
cytometry, cell morphometrics, and pulse-amplitude-
modulated (PAM) fluorescence microscopy. Fluores-
cence in situ hybridization (FISH; Levsky and Singer
P-replete data sets was randomly divided into train- 2003) and minisequencing employing denaturing
ing and validation sets containing approximately gradient gel electrophoresis (DGGE) (Fiorentino
two-thirds and one-third of the original spectra, et al. 2003) are currently the only genetic methods
respectively. PCA models of the training sets used available to measure population variability in gene
four PCs and were obtained using full cross valida- expression. Single coenobia or cell measurement
tion. Four PCs explained 95% of the variance in allows investigation of fundamental questions about
P-starved and P-replete training sets. The SIMCA intercolonial or intercellular variability and the fac-
model distance of 55.3 indicated that PCA models of tors determining it. For example, is there a ‘‘normal
the P-starved and P-replete spectra were quite dis- response’’ to the environment, with each individual
tinct; a model distance of 3 is usually regarded as the varying statistically about the average response
minimum for reliable classification (Esbensen 2001). (Elowitz et al. 2002), or is intercellular variability due
Validation testing showed that 67% of P-replete and to differences in individual gene expression (Handa
77% of P-starved coenobia were classified unambi- et al. 1983)?
guously using SIMCA with an a level of 5%. All FTIR microspectroscopy provides a new pheno-
but one of the misclassified spectra were assigned typic approach to measuring the variability of
by SIMCA to both classes. Analysis of Cooman’s responses to nutrient change within microalgal pop-
plots (data not shown) indicated that the poor classi- ulations. Using chemometrics approaches such as
fication rates for the SIMCA analysis appeared to PLS-DA, the nutrient status of individual colonies
be due to variation particularly in the spectra from can be predicted based on the FTIR spectrum.
P-starved coenobia, resulting in overlap between the
P-starved and P-replete classes. Accordingly, it was The authors acknowledge financial support from the Austra-
reasoned that a linear classification method such as lian Research Council.
PLS-DA was more appropriate for the classification
Beardall, J., Berman, T., Heraud, P., Kadiri, M., Light, B., Patterson,
task. G., Roberts, S., Sahan, E., Schulzberger, B., Urlinger, U.
Indeed, PLS-DA proved to be more accurate than Wood, B. 2001. A comparison of methods for detection of
SIMCA at predicting nutrient status of coenobia, phosphate limitation in microalgae. Aquat. Sci. 63:107–21.
5. I N T E R C O L O N I A L M A C R O MO L E C U L A R V A R I A B I L I T Y 1339
Dressel, R. Gunther, E. 1999. Heat-induced expression of MHC- Heraud, P., Wood, B., Beardall, J. McNaughton, D. 2006. Effects
linked HSP70 genes in lymphocytes varies at the single cell of pre-processing of Raman spectra on in vivo classification of
level. J. Cell. Biochem. 72:558–69. nutrient status of algal cells. J. Chemometrics 20:1–5.
Elowitz, M., Levine, A., Siggia, E. Swain, P. 2002. Stochastic gene Heraud, P., Wood, B., Beardall, J. McNaughton, D. 2007. Probing
expression in a single cell. Science 297:1183–6. the influence of the environment on microalgae using infrared
Esbensen, K. 2001. Multivariate Data Analysis in Practice. An Intro- and Raman spectroscopy. In Kneipp, K., Aroca, R., Kneipp, H.
duction to Multivariate Data Analysis and Experimental Design, 5th Wentrup-Byrne, E. [Eds.] New Approaches in Biomedical Spec-
ed. Camo, Oslo, Norway, 598 pp. troscopy. ACS Books, Washington, D.C., pp. 85–106.
Fiorentino, F., Magli, M. C., Podini, D., Ferraretti, A. P., Nuccitelli, Heraud, P., Wood, B., Tobin, M., Beardall, J. McNaughton, D.
A., Vitale, N., Baldi, M. Gianaroli, L. 2003. The minise- 2005. Mapping of nutrient-induced biochemical changes in
quencing method: an alternative strategy for preimplantation living algal cells using synchrotron infrared microspectrosco-
genetic diagnosis of single gene disorders. Mol. Hum. Reprod. py. FEMS Microbiol. Lett. 249:219–25.
9:399–410. Levenson, E., Lerch, P. Martin, M. C. 2006. Infrared imaging:
Geladi, P. 1988. Notes on the history and nature of partial least synchrotrons vs. arrays, resolution vs. speed. Infrared Phys.
squares (PLS) modelling. J. Chemometrics 2:231–46. Technol. 49:45–52.
Giordano, M., Kansiz, M., Heraud, P., Beardall, J., Wood, B. Levsky, J. Singer, R. 2003. Gene expression and the myth of the
McNaughton, D. 2001. Fourier transform infrared spectros- average cell. Trends Cell Biol. 13:4–6.
copy as a novel tool to investigate changes in intracellular Liang, Y., Beardall, J. Heraud, P. 2006. Changes in growth,
macromolecular pools in the marine microalga Chaetoceros chlorophyll fluorescence and fatty acid composition with cul-
muellerii (Bacillariophyceae). J. Phycol. 37:271–9. ture age in batch cultures of Phaeodactylum tricornutum and
Handa, A., Bressan, R., Handa, S. Hasegawa, P. 1983. Clonal Chaetoceros muelleri (Bacillariophycaea). Bot. Mar. 49:165–73.
variation for tolerance to polyethylene glycol-induced water Wold, S. 1976. Pattern recognition by means of disjoint principal
stress in cultured tomato cells. Plant Physiol. 72:645–53. component models. Pattern Recognit. 8:127–39.
Hegewald, E., Krienitz, L. Schnepf, E. 1994. Studies on Scene- Zhao, J. 1997. A liability theory of diseases: the foundation of cell
desmus costato granulatus Skuja. Nova Hedwigia 59:97–127. population pathology. Med. Hypotheses 48:341–6.