SlideShare ist ein Scribd-Unternehmen logo
1 von 24
Downloaden Sie, um offline zu lesen
Metallography and
Microstructures of Cast Iron
Janina M. Radzikowska, The Foundry Research Institute, Krakow, Poland
                                                           ´


   CAST IRON is an iron-carbon cast alloy with                            Fe       Fe3C occurs only at the temperature 723      Preparation for Microexamination
other elements that is made by remelting pig                                  2 C (1333         4 F), while equilibrium of
iron, scrap, and other additions. For differentia-                        phases Fec       Fe     Cgr occurs at the tempera-       Preparation of cast iron specimens for micro-
tion from steel and cast steel, cast iron is defined                       ture 738 3 C (1360           5 F). So, in the range   structural examination is difficult due to the need
as a cast alloy with a carbon content (min 2.03%)                         of temperatures 738 to 723 C (1360 to 1333 F),        to properly retain the very soft graphite phase,
that ensures the solidification of the final phase                          the austenite can decompose only into a mixture       when present, that is embedded in a harder ma-
with a eutectic transformation. Depending on                              of ferrite with graphite instead of with cementite    trix. Also, in the case of gray irons with a soft
chemical specifications, cast irons can be non-                            (Ref 2).                                              ferritic matrix, grinding scratches can be difficult
alloyed or alloyed. Table 1 lists the range of                               The previous considerations regard only pure       to remove in the polishing process. When shrink-
compositions for nonalloyed cast irons (Ref 1).                           iron-carbon alloys. In cast iron, which is a mul-     age cavities are present, which is common, the
The range of alloyed irons is much wider, and                             ticomponent alloy, these temperatures can be          cavities must not be enlarged or smeared over.
they contain either higher amounts of common                              changed by different factors: chemical compo-            Retention of graphite in cast iron is a common
components, such as silicon and manganese, or                             sition, ability of cast iron for nucleation, and      polishing problem that has received considerable
special additions, such as nickel, chromium, alu-                         cooling rate. Silicon and phosphorus both
minum, molybdenum, tungsten, copper, vana-                                strongly affect the carbon content of the eutectic.
dium, titanium, plus others.                                              That dependence was defined as a carbon equiv-
   Free graphite is a characteristic constituent of                       alent (Ce) value that is the total carbon content
nonalloyed and low-alloyed cast irons. Precipi-                           plus one-third the sum of the silicon and phos-
tation of graphite directly from the liquid occurs                        phorus content (Ref 2). Cast iron, with a com-
when solidification takes place in the range be-                           position equivalent of approximately 4.3, solid-
tween the temperatures of stable transformation                           ifies as a eutectic. If the Ce is 4.3, it is
(Tst) and metastable transformation (Tmst), which                         hypereutectic; if it is 4.3, cast iron is hypoeu-
are, respectively, 1153 C (2107 F) and 1147 C                             tectic (Ref 3).
(2097 F), according to the iron-carbon diagram.                              Eutectic cells are the elementary units for
In this case, the permissible undercooling degree                         graphite nucleation. The cells solidify from the
is DTmax       Tst   Tmst. In the case of a higher                        separate nuclei, which are basically graphite but
undercooling degree, that is, in the temperatures                         also nonmetallic inclusions such as oxides and
below Tmst, primary solidification and eutectic                            sulfides as well as defects and material discon-
solidification can both take place completely or                           tinuities. Cell size depends on the nucleation rate
partially in the metastable system, with precipi-                         in the cast iron. When the cooling rate and the
tation of primary cementite or ledeburite.                                degree of undercooling increase, the number of
Graphitization can also take place in the range                           eutectic cells also increases, and their micro-
of critical temperatures during solid-state trans-                        structure changes, promoting radial-spherical
formations. The equilibrium of phases Fec                                 shape (Ref 2).


Table 1 Range of chemical compositions for typical nonalloyed and low-alloyed cast
irons
                                                                                   Composition, %
Type of iron                                    C                  Si                Mn                P            S
Gray (FG)                                    2.5–4.0            1.0–3.0             0.2–1.0         0.002–1.0   0.02–0.025
Compacted graphite (CG)                      2.5–4.0            1.0–3.0             0.2–1.0          0.01–0.1   0.01–0.03
Ductile (SG)                                 3.0–4.0            1.8–2.8             0.1–1.0          0.01–0.1   0.01–0.03       Fig. 1  Spheroidal graphite in as-cast ductile iron (Fe-
White                                        1.8–3.6            0.5–1.9            0.25–0.8          0.06–0.2   0.06–0.2                3.7%C-2.4%Si-0.59%Mn-0.025%P-0.01%S-
Malleable (TG)                               2.2–2.9            0.9–1.9            0.15–1.2          0.02–0.2   0.02–0.2        0.095%Mo-1.4%Cu) close to the edge of the specimen,
                                                                                                                                which was 30 mm (1.2 in.) in diameter. The specimen was
FG, flake graphite; SG, spheroidal graphite; TG, tempered graphite. Source: Ref 1
                                                                                                                                embedded. As-polished. 100
566 / Metallography and Microstructures of Ferrous Alloys


attention. Coarse grinding is a critical stage, so,         will be seen as an open or collapsed cavity. Sil-           age. Fresh paper should always be used; never
if the soft graphite is lost during coarse grinding,        icon carbide (SiC) grinding papers are preferred            grind with worn paper. White iron, by contrast,
it cannot be recovered in subsequent steps and              to emery, because SiC cuts efficiently, while em-            contains extremely hard iron carbides that resist
                                                            ery paper does not, and SiC produces less dam-              abrasion and tend to remain in relief above the
                                                                                                                        softer matrix after polishing (Ref 4).
                                                                                                                           Quality-control studies, based on image anal-
                                                                                                                        ysis measurements of the amount of phases and
                                                                                                                        the graphite shape and size, also need perfectly
                                                                                                                        prepared specimens with fully retained graphite
                                                                                                                        phase and with microstructural constituents cor-
                                                                                                                        rectly revealed by etching.
                                                                                                                           Specimen Preparation. The metallographic
                                                                                                                        specimen preparation process for microstructural
                                                                                                                        investigations of cast iron specimens usually
                                                                                                                        consists of five stages: sampling, cold or hot
                                                                                                                        mounting, grinding, polishing, and etching with
                                                                                                                        a suitable etchant to reveal the microstructure.
                                                                                                                        Each stage presents particular problems in the
                                                                                                                        case of cast iron. Of course, the graphite phase
                                                                                                                        is studied after polishing and before etching.
                                                                                                                           Sampling is the first step—selecting the test
                                                                                                                        location or locations to be evaluated metallo-
                                                                                                                        graphically. Usually, cast iron castings have a
                                                                                                                        considerable variation in microstructure between
                                                                                                                        surface and core. Selection of the test location is
                                                                                                                        very important to obtain representative results
                                                                                                                        from the microstructural examination. Samples
                                                                                                                        can be obtained by cutting them out from either
                                                                                                                        a large or small casting or from standard test
                                                                                                                        bars, such as microslugs, ears, or keel bars; how-
                                                                                                                        ever, the microstructure of these pieces may not
                                                                                                                        be representative for the actual casting due to
Fig. 2    Same as-cast ductile iron as in Fig. 1, but the                                                               substantial differences in the solidification rates.
          specimen was not embedded. The arrows show        Fig. 4   Same as in Fig. 3 but close to the center of the   Production saws, such as large, abrasive cutoff
the pulled-out graphite. As-polished. 100                            specimen. As-polished. 100                         saws, band saws, or power hacksaws, can be
                                                                                                                        used for dividing medium-sized casting into
                                                                                                                        smaller samples. In the case of very large cast-
                                                                                                                        ings, flame cutting may be used. Next, the pieces


                                                            Fig. 5    Temper graphite in malleable iron (Fe-2.9%C-
                                                                      1.5%Si-0.53%Mn-0.06%P-0.22%S-0.08%Ni-
                                                            0.1%Cu-0.09%Cr-0.003%Bi) after grinding on P1000 SiC
Fig. 3  Flake graphite in as-cast gray iron (Fe-3.5%C-      waterproof paper. The casting was annealed at 950 C
        2.95%Si-0.40%Mn-0.08%P-0.01%S-0.13%Ni-              (1740 F), held 10 h, furnace cooled to 720 C (1330 F),      Fig. 6   Same as in Fig. 5 but after polishing with 9 lm
0.15%Cu) close to the edge of the unembedded specimen,      held 16 h, and air cooled. The arrows show the pulled-out            diamond suspension. The arrows show the
which was 30 mm (1.2 in.) in diameter. As-polished. 100     graphite. As-polished. 400                                  pulled-out graphite. As-polished. 400
Metallography and Microstructures of Cast Iron / 567


can be reduced to the desired size for metallo-                 sectioned by flame cutting, the specimen must                  nodules were perfectly retained. Figures 3 and 4
graphic specimens by using a laboratory abra-                   be removed well away from the heat-affected                   show that the uniform grinding of nonmounted
sive cutoff saw or a band saw. If the casting was               zone. The pieces cut out for metallographic ex-               specimens is more difficult, and the flake graph-
                                                                amination may be ground prior to mounting (this               ite in gray iron close to the edge of such a spec-
                                                                may be done to round off sharp cut edges or to                imen is not polished perfectly, in comparison to
                                                                reduce the roughness of band-saw-cut surfaces)                well-polished graphite in the mounted specimen.
                                                                and subsequent preparation. Overheating is                       Grinding and Polishing. To ensure proper
                                                                avoided by proper selection of the speed of cut-              graphite retention, the use of an automated
                                                                off saws, the use of the correct wheel, and ade-              grinding-polishing machine is recommended
                                                                quate water cooling. Overheating during grind-                over manual preparation. The automated equip-
                                                                ing is avoided by using fresh abrasive paper and              ment makes it possible, in comparison to manual
                                                                proper cooling. When metallographic specimens                 specimen preparation, to properly control the
                                                                are cut out from the standard cast bars, they are             orientation of the specimen surface relative to
                                                                sometimes prepared using standard machine                     the grinding or polishing surface, to maintain
                                                                shop equipment, such as turning in a lathe or                 constantly the desired load on the specimens, to
                                                                milling. These devices can deform the testpiece               uniformly rotate the specimens relative to the
                                                                surfaces to a considerable depth, so care must be             work surface, and to control the time for each
                                                                exercised to remove any damage from these                     preparation step. Proper control of these factors
                                                                operations before starting specimen preparation.              influences graphite retention, although other fac-
                                                                   Mounting. Specimens can be mounted in a                    tors are also important.
                                                                polymeric material using either cold or hot                      A good, general principle is to minimize the
                                                                mounting procedures. The mounting resin is                    number of grinding and polishing stages. Also,
                                                                chosen depending on the cast iron hardness (soft              the load on each specimen, or on all specimens
                                                                or hard) and the need to enhance edge retention.              in the holder, must be chosen to obtain a cor-
                                                                Use of an incorrect resin, or ignoring the mount-             rectly polished surface in the shortest possible
                                                                ing process, can make it very difficult to obtain              time. This precludes the risk of pulling out the
                                                                properly polished graphite in the area close to               graphite phase and ensures that the graphite pre-
                                                                the specimen edge. Figures 1 and 2 show the                   cipitates will be perfectly flat with sharp bound-
                                                                microstructure of spheroidal graphite in ductile              aries.
                                                                iron close to the edge of the specimens, which                   The recommended procedure for automated
                                                                were cut off from a 30 mm (1.2 in.) diameter bar              preparation of the specimens of nonalloyed and
                                                                and polished with and without embedding in a                  low-alloyed cast iron with graphite specimens is
Fig. 7    Same as in Fig. 6 but after final polishing with       polymer resin, respectively. In the specimen pre-             to grind with a high-quality, waterproof 220- or
          the 1 lm diamond paste applied on a napless
cloth. Graphite is free of any visible pullouts. As-polished.   pared without embedding in a resin, the graphite              240-grit (or equivalent) SiC paper until plane,
400                                                             was pulled out, while in the specimen that was                with a load of 100 N for six specimens mounted
                                                                embedded in a resin and prepared, the graphite                in the sample holder, with central loading. Pol-


                                                                Fig. 9    White high-chromium iron (Fe-3.2%C-4.65%Cr-         Fig. 10      White high-chromium iron (Fe-3.16%C-
                                                                          2.9%Mn-0.51%Si-0.050%P-0.024%S). Eutectic                        8.86%Cr-0.50%Si-3.04%Mn-0.051%P-
                                                                and secondary carbides in the matrix. Specimen was pre-       0.018%S). Eutectic and secondary carbides in the matrix.
Fig. 8    Same as in Fig. 7 but after final polishing with       pared correctly. The casting was austenitized at 1000 C       Specimen was prepared incorrectly. The casting was aus-
          the 1 lm diamond suspension applied on a              (1830 F), held 1 h, furnace cooled to 400 C (750 F) for       tenitized at 1000 C (1830 F), held 1 h, furnace cooled to
napped cloth. The arrows show the pulled-out graphite. As-      2 h, taken to salt bath at 400 C (750 F), held for 4 h, and   700 C (1290 F) for 2 h, taken to salt bath at 700 C (1290
polished. 400                                                   air cooled. Etched with glyceregia. 500                        F), held 4 h, and air cooled. Etched with glyceregia. 500
568 / Metallography and Microstructures of Ferrous Alloys


ishing is carried out in four steps with a different                   P220 SiC paper and then polishing with 9 lm                            better using diamond paste and the preferred lu-
grain size diamond paste:                                              diamond paste according to the procedure given                         bricant than with an aqueous suspension, al-
                                                                       previously. In both cases, there is some pulled-                       though more work needs to be conducted to de-
                                                                       out graphite after these steps. Each specimen was                      termine if this difference is important. Final
        Diamond paste      Load,                 Recommended           prepared further. The specimen ground with                             polishing with an alumina suspension, such as
Step    grain size, lm      N       Duration     polishing cloth       three SiC steps was polished with 3 lm diamond                         Masterprep alumina (Buehler, Ltd.), makes the
1             9            120(a) 5 min(d)     Napless woven           suspension on a napless cloth and then with 1                          graphite boundaries sharper by removing the
2             3            120(a) 3 min(d)     Napless woven           lm diamond suspension on a napped cloth. The                           matrix, which was smeared over the edge of the
3             1            120(a) 2 min(d)     Napless woven
4            (b)            25(c) 45–60 s(e)   Napless synthetic       pulled-out graphite was still visible. However,                        graphite during grinding and was not removed
                                                 polyurethane          the specimen ground with P220 SiC and pol-                             by the diamond polishing steps.
(a) Load per six specimens. (b) Aqueous 0.05 lm alumina suspension.
                                                                       ished with 9 lm diamond paste, when finished                               Alloyed chromium iron is much harder, and a
(c) Load per single specimen (switching to individual force to make    with the recommended practice given previ-                             different preparation procedure must be used.
specimen cleaning easier). (d) Comp direction. (e) Contra              ously, was free of any visible pullouts, as shown                      The grinding process is carried out in three steps,
                                                                       in Fig. 7. By using a napped cloth and an aque-                        and polishing is carried out in three steps, al-
                                                                       ous 1 lm diamond suspension for the final dia-                          though only two polishing steps are needed for
   Figure 5 shows temper graphite in malleable                         mond polishing step, it was impossible to obtain                       most routine work. Grinding of the specimens,
iron after the last step of grinding, which was                        perfectly retained graphite, as shown in Fig. 8.                       mounted in the sample holder, used central load-
carried out in three steps using, consecutively,                       Napped cloths should not be used with diamond                          ing (150 N/six specimens), with high-quality
SiC grit papers P220, P500, and P1000. Figure                          abrasive, either in paste, suspension, or aerosol                      SiC waterproof paper (water cooled) with the
6 shows the same specimen after grinding on                            form. Graphite retention appears to be slightly                        following grit sizes:

Table 2 Etchants
No. of etchant              Name of etchant                             Composition                                                              Comments                                             Ref
 1                 Nital                               96–98 mL ethanol                                   Most common etchant for iron, carbon, alloyed steels, and cast iron. Reveals            4, p 648
                                                       2–4 mL nitric acid (HNO3)                            alpha grain boundaries and constituents. The 2 or 4% solution is commonly
                                                                                                            used. Use by immersion of sample for up to 60 s.
    2              Picral                              4 g picric acid ((NO2)3C6H2OH)                     Recommended for structures consisting of ferrite and carbides. Does not reveal          4, p 648
                                                       100 mL ethanol                                       ferrite grain boundaries and martensite as-quenched. Addition of approximately
                                                                                                            0.5–1% zephiran chloride improves etch rate and uniformity.
    3              Glyceregia (modified)                3 parts glycerine                                  For austenitic stainless steels and cast irons. Reveals grain structure; outlines       4, p 634
                                                       2 parts hydrochloric acid (HCl)                      sigma and carbides. Mix fresh; do not store. Use by swabbing. Heat up to 50
                                                       1 part nitric acid (HNO3)                             C (120 F) when etching time at 20 C (70 F) does not bring results.
    4              Alkaline sodium picrate             2 g picric acid ((NO2)3C6H2OH))                    Immerse sample in solution at 60–70 C (140–160 F) for 1–3 min. Colors                   4, p 646
                     (ASP)                             25 g sodium hydroxide (NaOH)                         cementite (Fe3C) dark brown to black, depending on etching time.
                                                       100 mL distilled water
    5              Klemm I                             50 mL sat. aq. sodium thiosulfate                  Immerse sample for 40–100 s. Reveals phosphorus segregation (white); colors             4, p 642
                                                         (Na2S2O3•5H2O)                                     ferrite blue or red; martensite brown; cementite and austenite are unaffected
                                                       1 g potassium metabisulfite (K2S2O5)
    6              Beraha CdS                          240 g aq. sodium thiosulfate                       Tint etch for iron, steel, cast irons, and ferritic and martensitic stainless steel.    4, p 644
                                                         (Na2S2O3•5H2O)                                     Dissolve in order shown. Allow each to dissolve before adding next. Allow to
                                                       30 g citric acid (C6H8O7•H2O)                        age 24 h at 20 C (70 F) in a dark bottle. Before use, filter 100 mL of solution
                                                       20–25 g cadmium chloride                             to remove precipitates. Preetch with a general-purpose reagent. Etch 20–90 s;
                                                         (CdCl2•2.5H2O)                                     good for 4 h. For steels and cast irons, after 20–40 s only ferrite is colored, red
                                                       100 mL distilled water                               or violet. Longer times color all constituents: ferrite is colored yellow or light
                                                                                                            blue; phosphide, brown; carbide, violet or blue. For stainless steels, immerse
                                                                                                            sample 60–90 s; carbides are colored red or violet-blue; matrix, yellow; colors
                                                                                                            of ferrite vary. Sulfides red-brown after 90 s
    7                              ...                 28 g sodium hydroxide (NaOH)                       Immerse sample in hot solution (close to boiling temperature) for 30–60 min. This       6
                                                       4 g picric acid ((NO2)3C6H2OH))                      reagent reveals silicon segregation in ductile iron. The colors of microstructure
                                                       1 g potassium metabisulfite (K2S2O5)(a)               change themselves from green through red, yellow, blue, and dark brown to
                                                       100 mL distilled water                               light brown as the silicon content is reduced from the graphite nodule to cell
                                                                                                            boundaries. The regions with lowest silicon content at the cell boundaries
                                                                                                            remain colorless. Before etching, ferritization of the specimen is recommended
                                                                                                            to enhance the visibility of the colors.
    8              Murakami reagent                    10 g potassium ferricyanide (K3Fe(CN)6)            Use fresh, cold or hot. Cold, at 20 C (70 F) for up to 1.5 min, tints chromium          4, p 646
                                                       10 g potassium hydroxide (KOH) or                    carbides; Fe3C unattacked or barely attacked. Hot, at 50 C (120 F) for 3 min,
                                                         sodium hydroxide (NaOH)                            tints iron phosphide. The higher temperature or etching time also tints
                                                       100 mL distilled water                               cementite into yellow color.
    9              Beraha reagent with selenic         2 mL hydrochloric acid (HCl)                       For differentiation of the constituents in steadite in cast iron, immerse sample for    4, p 643
                     acid                              0.5 mL selenic acid (H2SeO4)                         7–10 min; iron phosphide colored blue or green, cementite colored red, and
                                                       100 mL ethanol                                       ferrite is bright (unaffected). Preetching with nital is recommended.
10                 Beraha-Martensite (B-M)             2 g ammonium bifluoride (NH4F•HF)                   Immerse sample for 1–3 s. Coarse martensite is blue or yellow; fine martensite           6, p 26
                                                       2 g potassium metabisulfite (K2S2O5)                  and bainite are brown. Use fresh reagent, and wet sample with tap water before
                                                       100 mL stock solution: 1:5, HCl to                   etching.
                                                         distilled water
11                 10% sodium metabisulfite             10 g sodium pyrosulfite (Na2S2O5)                   Tints as-quenched martensite into brown; bainite into blue; carbides, phosphides,       4, p 642
                     (SMB)(b)                          100 mL distilled water                               and residual austenite, unaffected. Immerse sample in etchant solution
                                                                                                            approximately 20 s. Preetching sample with nital is recommended.
12                 Lichtenegger and Bloech I           20 g ammonium bifluoride (NH4F•HF)                  Dissolve in given order. In austenitic Cr-Ni alloys, it tints austenite and reveals     7, p 51
                     (LB I)                            0.5 g potassium metabisulfite (K2S2O5)                dendritic segregation. Ferrite and carbides remain unaffected. Wet-etch for 1–5
                                                       100 mL hot distilled water                           min immediately after polishing.
13                                 ...                 50% aq. hydrochloric acid (HCl)                    Immerse sample for 30–90 min. Every 15–20 min, wash sample with distilled               8, p 97
                                                                                                            water, quickly etch in hydrofluoric acid (conc.), and wash in tap water. When
                                                                                                            the etching process is finished, immerse sample in 5% aq. KOH or NaOH for
                                                                                                            10–20 min, wash with distilled water in an ultrasonic washer, then in ethanol,
                                                                                                            and dry with blowing hot air.
(a) Potassium metabisulfite and potassium pyrosulfite are both synonomous with K2 S2 O5. (b) Sodium metabisulfite and sodium pyrosulfite are synonomous with Na2S2O5.
Metallography and Microstructures of Cast Iron / 569

● First step: P220 grit until plane.                       ● First step: 3 lm diamond, 120 N load/six                polyurethane pad but in a single specimen
● Second step: P500 grit for 3 min.                          specimens for 3 min with a napless cloth.               holder with an individual load of 30 N for 1.5
● Third step: P1000 grit for 3 min                         ● Second step: 1lm diamond, 100 N load/six                min.
                                                             specimens for 3 min with a napless cloth                   Figure 9 shows the microstructure of a heat
Polishing is done in three steps, with different
                                                                                                                     treated chromium iron after this preparation. The
grain size diamond in paste for the first two steps:        The last polishing step is carried out with a col-
                                                                                                                     carbides are perfectly flat, with very sharp edges
                                                           loidal silica suspension on a napless synthetic
                                                                                                                     and boundaries etched uniformly. Figure 10
                                                                                                                     shows the primary eutectic carbides in the mi-
                                                                                                                     crostructure of a high-chromium iron. They ap-
                                                                                                                     pear to be sticking out from the matrix, and their
                                                                                                                     boundaries are not outlined uniformly. This re-
                                                                                                                     sult occurs if the load is too low or the final pol-
                                                                                                                     ishing time on the silica suspension is too long.
                                                                                                                     Both problems will result in too much removal
                                                                                                                     of the softer matrix that was surrounding the pri-
                                                                                                                     mary carbides.
                                                                                                                        During grinding, the paper must be moistened
                                                                                                                     with flowing tap water, and the specimens should
                                                                                                                     be washed with water after each step. Also, dur-
                                                                                                                     ing the first planning step, the sheet of paper
                                                                                                                     should be changed every 1 min. Used grit paper
                                                                                                                     is not effective and will introduce heat and dam-
                                                                                                                     age, impairing specimen flatness. During polish-
                                                                                                                     ing with diamond paste from a tube, the cloth is
                                                                                                                     moistened with the recommended lubricant for
                                                                                                                     the paste. If a water-based diamond suspension
                                                                                                                     is applied on the cloth, the use of an additional
                                                                                                                     lubricant is not required.
                                                                                                                        The speed of the grinding-polishing head was
                                                                                                                     150 rpm, and it was constant. The speed of the
                                                                                                                     platen during grinding was always 300 rpm, and
                                                                                                                     during polishing was always 150 rpm. After each
Fig. 11     Ductile iron (Fe-3.8%C-2.4%Si-0.28%Mn-
                                                                                                                     grinding step, the specimens were washed with
            1.0%Ni-0.05%Mg) after annealing. Ferrite and
approximately 5% pearlite. Etched with 2% nital. 100 .                                                               running tap water and dried with compressed air,
Courtesy of G.F. Vander Voort, Buehler Ltd.                                                                          while after each polishing step, they were
                                                           Fig. 13    Same as in Fig. 12 but after etching with 4%   washed with alcohol and dried with hot air from
                                                                      picral. Pearlite was etched uniformly. 500     a hair dryer.


Fig. 12     As-cast gray iron (Fe-2.8%C-0.8%Si-0.4%Mn-     Fig. 14    As-cast high-chromium white iron (Fe-
            0.1%S-0.35%P-0.3%Cr). Pearlite. Etched with               1.57%C-18.64%Cr-2.86%Mn-0.53%Si-
4% nital. Arrows show the white areas with weakly etched   0.036%P-0.013%S). Eutectic chromium carbides type         Fig. 15   Same as in Fig. 14 but after etching with 4%
or nonetched pearlite. 500                                 M7C3 in austenitic matrix. Etched with glyceregia. 500              nital. 500
570 / Metallography and Microstructures of Ferrous Alloys


Microexamination Methods                                          cation and morphology. One should always be-                    Standard Etchants. To see the microstruc-
                                                                  gin microstructural investigations by examining             tural details, specimens must be etched. Etching
   Chemical Etching. The examination of the                       the as-polished specimen before etching. This is            methods based on chemical corrosive processes
iron microstructure with a light optical micro-                   a necessity, of course, for cast iron specimens, if         have been used by metallographers for many
scope is always the first step for phase identifi-                  one is to properly examine the graphite phase.              years to reveal structures for black-and-white
                                                                                                                              imaging.
                                                                                                                                  Specimens of nonalloyed and low-alloyed
                                                                                                                              irons containing ferrite, pearlite, the phosphorus
                                                                                                                              eutectic (steadite), cementite, martensite, and
                                                                                                                              bainite can be etched successfully with nital at
                                                                                                                              room temperature to reveal all of these micro-
                                                                                                                              structural constituents. Usually, this is a 2 to 4%
                                                                                                                              alcohol solution of nitric acid (HNO3) (Table 2,
                                                                                                                              etch No. 1). Figure 11 shows a nearly ferritic
                                                                                                                              annealed ductile iron with uniformly etched
                                                                                                                              grain boundaries of ferrite and a small amount
                                                                                                                              of pearlite. Nital is very sensitive to the crystal-
                                                                                                                              lographic orientation of pearlite grains, so, in the
                                                                                                                              case of a fully pearlitic structure, it is recom-
                                                                                                                              mended to use picral, which is an alcohol solu-
                                                                                                                              tion of 4% picric acid (Table 2, etch No. 2). Fig-
                                                                                                                              ures 12 and 13 show the differences in revealing
                                                                                                                              the microstructure of pearlite with nital or picral.
                                                                                                                              Picral does not etch the ferrite grain boundaries,
                                                                                                                              or as-quenched martensite, but it etches the pear-
                                                                                                                              litic structure more uniformly, while nital leaves
                                                                                                                              white, unetched areas, especially in the case
                                                                                                                              where pearlite is very fine.
                                                                                                                                  When the austempering heat treatment is very
                                                                                                                              short, the microstructure of austempered ductile
                                                                                                                              iron (ADI) consists of martensite and a small
                                                                                                                              amount of acicular ferrite. After etching in 4%
                                                                                                                              nital, martensite as well as acicular ferrite are
                                                                                                                              both etched intensively, which makes it very dif-
                                                                  Fig. 18     As-cast gray iron (Fe-3.24%C-2.32%Si-
Fig. 16    As-cast ductile iron (Fe-3.07%C-0.06%Mn-                           0.54%Mn-0.71%P-0.1%S). E, phosphorous
           2.89%Si-0.006%P-0.015%S-0.029%Mg). C,                  ternary eutectic. Etched with 4% nital. 100
cementite; L, ledeburite; F, ferrite; and P, pearlite. Etched
with 4% nital. 650 (microscopic magnification 500 )


Fig. 17     Same as in Fig. 16 but after etching with hot                                                                     Fig. 20      Austempered ductile iron (Fe-3.6%C-2.5%Si-
            alkaline sodium picrate. C, eutectic cementite;       Fig. 19   Same as in Fig. 18 but after etching with Klemm                0.06%P-1.5%Ni-0.7%Cu). CB, cell bound-
L, ledeburite; F, ferrite; and P, pearlite with slightly etched             I reagent. E, phosphorous ternary eutectic.       aries; H, ferritic halo around the graphite nodules. Etched
cementite. 650 (microscopic magnification 500 )                    100                                                         with Klemm I reagent. 200
Metallography and Microstructures of Cast Iron / 571


ficult to distinctly see the needles of acicular fer-         which was 2 min, because the martensite was as-                 stored in the lab than nital, which can be an ex-
rite. Picral reveals this phase very well; marten-           quenched. The needles of acicular ferrite are                   plosive mixture under certain conditions when it
site is barely etched due to the very short                  dark and very sharp (Fig. 32, 33). In this case,                is stored in a tightly closed bottle.
austempering heat treatment of the specimen,                 picral is very convenient for estimating the                       Glyceregia (Table 2, etch No. 3), which is a
                                                             amount and morphology of the acicular ferrite in                mixture of glycerine, hydrochloric acid (HCl),
                                                             the ADI microstructure. Picral is safer to be                   and nitric acid (HNO3), is recommended for re-
                                                                                                                             vealing the microstructure of high-chromium
                                                                                                                             and chromium-nickel-molybdenum irons. Fig-
                                                                                                                             ure 14 shows the microstructure of a high-chro-
                                                                                                                             mium cast iron after etching with glyceregia (see
                                                                                                                             also Fig. 43, 49, and 96). Nital can be also used
                                                                                                                             for revealing the carbide morphology in the mi-
                                                                                                                             crostructure of chromium or chromium-nickel
                                                                                                                             irons when the carbon and chromium content
                                                                                                                             promotes solidification of eutectic carbides.
                                                                                                                             When the microstructure of a high-chromium
                                                                                                                             white iron contains columnar primary carbides,
                                                                                                                             glyceregia is recommended.
                                                                                                                                Figure 15 shows the microstructure of the
                                                                                                                             same cast iron as Fig. 14 but after etching with
                                                                                                                             4% nital (see also Fig. 40, 41). Both etchants
                                                                                                                             reveal carbide boundaries sharply and uniformly.
                                                                                                                                Selective Color Etching. If the black-and-
                                                                                                                             white etchants are inadequate for positive iden-
                                                                                                                             tification of the iron microstructures, other pro-
                                                                                                                             cedures must be used, such as selective color
                                                                                                                             etching. The reagents referred to as tint etchants
                                                                                                                             are usually acidic solutions with either water or
                                                                                                                             alcohol as a solvent. They are chemically bal-
                                                                                                                             anced to deposit a thin (40 to 500 nm), trans-
                                                                                                                             parent film of oxide, sulfide, complex molyb-
                                                                                                                             date, elemental selenium, or chromate on the
                                                                                                                             specimen surface. Coloration is developed by in-
Fig. 21    Same as in Fig. 20 but after etching with Ber-    Fig. 23    As-cast gray iron (Fe-3.33%C-1.64%Si-                terference between light rays reflected at the in-
                                                                        0.31%Mn-1.37%P-0.107%S). Ternary phos-
           aha’s CdS reagent. H, ferritic halo; CB, cell     phorus eutectic. Etched with 4% nital. 1300 (micro-
boundaries. 250                                              scopic magnification 1000 )


Fig. 22    Nodular iron (Fe-3.9%C-2.9%Si-0.32%Mn-
           0.06%P-0.037%Mg-1.5%Ni-0.57%Cu). Sili-                                                                            Fig. 25   Same as in Fig. 23 but after etching with Klemm
con microsegregation was revealed. The casting was an-       Fig. 24     Same as in Fig. 23 but after etching with hot                 I reagent. F, ferrite; C, cementite; and C    IP,
nealed. Etched with hot aqueous solution of sodium                       alkaline sodium picrate. C, cementite; F, ferrite   cementite iron phosphide inside the precipitate of phos-
hydroxide, picric acid, and potassium pyrosulfite (Table 2,   (unaffected); IP, iron phosphide ferrite; and TiN, titanium     phorous eutectic. 1300         (microscopic magnification
etchant No. 7). 500                                          nitride. 1300 (microscopic magnification 1000 )                  1000 )
572 / Metallography and Microstructures of Ferrous Alloys


ner and outer film surfaces. Crystallographic ori-             is invaluable for quantitative metallography, a                  eburite, the differentiation of the white structural
entation, local chemical composition, and                     field of growing importance (Ref 5).                              constituents is difficult after etching a specimen
etching time affect film thickness and control                    When ferritic-pearlitic microstructures of cast               with nital. In such cases, hot alkaline sodium pic-
color production. The use of selective etchants               iron contain large amounts of cementite and led-                 rate (ASP) is recommended (Table 2, etch No.
                                                                                                                               4), which reveals cementite, tinted a brown
                                                                                                                               color, while ferrite remains unaffected. This etch
                                                                                                                               is a mixture of sodium hydroxide (NaOH), picric
                                                                                                                               acid, and distilled water. Figure 16 shows the
                                                                                                                               microstructure of a thin-walled, chilled ductile
                                                                                                                               iron casting after etching with nital, while Fig.
                                                                                                                               17 shows the microstructure of the same speci-
                                                                                                                               men after etching with ASP; the brown-colored
                                                                                                                               cementite and ledeburite are clearly visible in the
                                                                                                                               pearlitic-ferritic matrix (the cementite in pearlite
                                                                                                                               was also slightly tinted). It allows one to esti-
                                                                                                                               mate the amount of cementite that should be re-
                                                                                                                               moved from the casting microstructure in the an-
                                                                                                                               nealing process.
                                                                                                                                  Segregation of silicon and phosphorus in iron
                                                                                                                               is very strong and can be revealed with selective
                                                                                                                               color etching methods. Klemm’s I reagent (Table
                                                                                                                               2, etch No. 5), which tints ferrite while austenite
                                                                                                                               and carbides remain colorless, consists of
                                                                                                                               potassium metabisulfite (K2S2O5) and a cold-sat-
                                                                                                                               urated water solution of sodium thiosulfate
                                                                                                                               (Na2S2O3•5H2O) and is one of the etchants that
                                                                                                                               can be used to reveal phosphorus and silicon seg-
                                                                                                                               regation.
                                                                                                                                  Usually, the distribution of the phosphorus eu-
                                                                                                                               tectic, which solidifies in gray iron on the cell
                                                              Fig. 28      Same as in Fig. 25 but after etching with Ber-
                                                                                                                               boundaries, is revealed by etching up to 4 min
                                                                           aha’s reagent with selenic acid. IP, iron phos-
                                                              phide; C, cementite; and F, ferrite. The dark points in pearl-   in 4% nital. Figure 18 shows the microstructure
Fig. 26     Same as in Fig. 23 but after etching with hot     ite, which look like artifacts, can be iron phosphide            of as-cast gray iron with the ternary phosphorous
            Murakami’s reagent. IP, iron phosphide; C F,      precipitates or fine, nonmetallic inclusions. 1300 (micro-        eutectic. The cell boundaries, filled with steadite,
cementite     ferrite inside the precipitate of phosphorous   scopic magnification 1000 )
eutectic. 1300 (microscopic magnification 1000 )


                                                              Fig. 29      As-cast gray iron (Fe-3.62%C-2.03%Si-
Fig. 27    Same as in Fig. 26 but after overetching with                   1.13%P-0.61%Mn-0.137%S-0.113%Cr-                    Fig. 30     Same as in Fig. 29 but after etching with hot
           hot Murakami’s reagent. IP, iron phosphide; C,     0.478%Ni-0.004%Al). E, binary phosphorous eutectic; F,                       alkaline sodium picrate and 4% nital. Pearlitic
cementite; and F, ferrite. 1300 (microscopic magnifica-        ferrite at the graphite precipitate; and P, pearlite. Etched     matrix is revealed; phosphorous eutectic is unaffected.
tion 1000 )                                                   with 4% nital. 500                                               500
Metallography and Microstructures of Cast Iron / 573


are white, while their interiors are almost black             areas with the ternary eutectic, situated at the               phosphide in steadite are not etched, and the net-
due to overetching the pearlitic-ferritic matrix.             boundaries of the eutectic cells, are almost col-              work is clearly visible.
Figure 19 shows the same microstructure after                 orless. In both cases, the cementite and iron                     Figure 20 shows silicon segregation in an ADI
etching with Klemm’s I reagent. The microre-                                                                                 microstructure after etching with Klemm’s I re-
gions inside the eutectic cells with a lower phos-                                                                           agent. The regions outlining the cell boundaries,
phorus content are tinted a blue color, while the                                                                            low in silicon, are tinted a blue color, while the
                                                                                                                             very thin halos around the graphite nodules,
                                                                                                                             where the silicon content is highest, remain col-
                                                                                                                             orless. Acicular ferrite is orange, and austenite is
                                                                                                                             not tinted. Figure 21 shows the same microstruc-
                                                                                                                             ture after etching with Beraha’s CdS reagent (Ta-
                                                                                                                             ble 2, etch No. 6), an aqueous solution of sodium
                                                                                                                             thiosulfate (Na2S2O3•5H2O), citric acid
                                                                                                                             (C6H8O7•H2O),        and      cadmium      chloride
                                                                                                                             (CdCl2•2.5H2O). The silicon segregation is re-
                                                                                                                             vealed the same way as after using Klemm’s I
                                                                                                                             reagent.
                                                                                                                                To reveal silicon segregation in nonalloyed
                                                                                                                             ductile cast iron inside eutectic cells, the hot
                                                                                                                             aqueous solution of sodium hydroxide, picric
                                                                                                                             acid, and potassium pyrosulfite (K2S2O5) can be
                                                                                                                             used (Table 2, etch No. 7). Figure 22 shows the
                                                                                                                             different colors of the microstructure, which
                                                                                                                             change from green through red, yellow, blue, and
                                                                                                                             dark brown to light brown as the silicon content
                                                                                                                             is changing from the graphite nodule to the cell
                                                                                                                             boundaries. The regions with the lowest silicon
                                                                                                                             content at the cell boundaries remain colorless.
                                                                                                                             Before etching, ferritization of the specimen was
                                                                                                                             carried out to enhance the visibility of the mi-
                                                                                                                             crostructural colors.
                                                                                                                                The revealing and differentiation of all con-
                                                              Fig. 33      Same as in Fig. 32 but after etching with 4%
                                                                                                                             stituents in steadite is invaluable for the deter-
                                                                           picral. AF, acicular ferrite; PM, plate marten-
Fig. 31   Same as in Fig. 29 but after etching with hot
                                                              site. 1000                                                     mination of the type of eutectic as well as the
          Murakami reagent. Only brown-tinted iron
phosphide was revealed. 500


Fig. 32    Austempered ductile iron (Fe-3.6%C-2.5%Si-         Fig. 34     Same as in Fig. 32 but after etching with Ber-
           0.056%P-0.052%Mg-0.7%Cu).             Martensite               aha-Martensite reagent. PM, blue-yellow plate      Fig. 35     Same as in Fig. 32 but after etching with 10%
and acicular ferrite. The casting was austempered at 900      martensite; FM, brown fine martensite; and AF      A, dark                  sodium metabisulfite. PM, plate martensite;
 C (1650 F), held 2 h, taken to salt bath at 360 C (680 F),   needles of acicular ferrite surrounded with colorless aus-     FM, fine martensite; and AF     A, acicular ferrite and aus-
held 2 min, and air cooled. Etched with 4% nital. 1000        tenite. 1000                                                   tenite. 1000
574 / Metallography and Microstructures of Ferrous Alloys


amount of each constituent. In the case of the                 stituents, nor does it provide enough information           ing in 4% nital. The white areas that surround
ternary phosphorous eutectic, which consists of                about distribution of the eutectic constituents.            the ternary eutectic and are also visible inside
ferrite, cementite, and iron phosphide (Fe3P), ni-             Figure 23 shows the microstructure of the ter-              the eutectic can be either ferrite or cementite.
tal does not help in the identification of the con-             nary phosphorous eutectic in gray iron after etch-          Figure 24 shows the microstructure of the same
                                                                                                                           specimen after selective color etching with hot
                                                                                                                           ASP (Table 2, etchant No. 4). Cementite in the
                                                                                                                           eutectic is tinted brown and blue colors (also in
                                                                                                                           pearlite), while ferrite and iron phosphide are not
                                                                                                                           tinted. To reveal the ferrite, the same specimen
                                                                                                                           was etched with Klemm’s I reagent. Figure 25
                                                                                                                           shows the eutectic regions with precipitates of
                                                                                                                           brown ferrite (also in pearlite), while cementite
                                                                                                                           and iron phosphide are not tinted.
                                                                                                                              Murakami’s reagent (Table 2, etch No. 8),
                                                                                                                           used at 50 C (120 F) for 3 min and containing
                                                                                                                           potassium hydroxide (KOH), potassium ferri-
                                                                                                                           cyanide (K3Fe(CN)6), and distilled water, can be
                                                                                                                           used for revealing and estimating the amount of
                                                                                                                           iron phosphide in steadite. Figure 26 shows this
                                                                                                                           constituent of the ternary phosphorous eutectic
                                                                                                                           microstructure, which was tinted a light-brown
                                                                                                                           color, while cementite and ferrite remained col-
                                                                                                                           orless. The microstructure of the same specimen
                                                                                                                           after overetching (5 min) with the same reagent
                                                                                                                           is shown in Fig. 27. This time, cementite was
                                                                                                                           also revealed and was tinted a yellow color,
                                                                                                                           while ferrite remained white. The color of the
                                                                                                                           iron phosphide changed to a dark-brown and
                                                                                                                           gray-blue color. Nevertheless, extending the
                                                                                                                           etching time beyond 3 min is not recommended,
                                                                                                                           because this can falsify the true results of the
Fig. 36     Austempered ductile iron (Fe-3.6%C-2.5%Si-
                                                                                                                           microstructural examination.
            0.052%Mg-0.7%Cu). AF, acicular ferrite; A,
austenite; and M, martensite. The casting was austempered                                                                     Good differentiation of all constituents in the
at 900 C (1650 F), held 2 h, taken to salt bath at 360 C
                                                               Fig. 38     Same as in Fig. 36 but after etching with 10%
                                                                                                                           ternary phosphorus eutectic can be obtained with
                                                                           sodium metabisulfite. AF, acicular ferrite; A,
(680 F), held 30 min, and air cooled. Etched with 4% nital.    austenite; and M, martensite. 1000                          Beraha’s reagent (Table 2, etch No. 9), a mixture
1000
                                                                                                                           of hydrochloric acid (HCl), selenic acid


                                                               Fig. 39     White alloyed cast iron (Fe-3.4%C-0.92%Mn-
                                                                           1.89%Si-9.52%Cr-6.27%Ni). Etched with Ber-
                                                               aha-Martensite. PM, plate martensite; FM, fine martensite;
                                                               EC, eutectic carbides type M7C3; SC, secondary carbides;
                                                               and MS, manganese sulfite. The casting was heat treated:     Fig. 40    Same white iron as in Fig. 39 but after etching
Fig. 37     Same as in Fig. 36 but after etching with Ber-     austenitized at 750 C (1380 F), held 2 h, and air cooled;              with 4% nital. M, martensite; EC, eutectic car-
            aha-Martensite reagent. AF, acicular ferrite; A,   tempered at 250 C (480 F), held 4 h, and air cooled.        bides; and SC, secondary carbides. 1300 (microscopic
austenite; and M, martensite. 1000                             1300 (microscopic magnification 1000 )                       magnification 1000 )
Metallography and Microstructures of Cast Iron / 575


(H2SeO4), and ethanol. According to Beraha,                   ture of the ternary eutectic, with cementite tinted             Figure 29 shows the microstructure of the
this etchant tints iron phosphide a dark-blue                 a light-pink color, while the rest of the constit-           pseudobinary phosphorous eutectic, which con-
color, cementite a violet or dark red, and ferrite            uents were colored properly.                                 sists of iron phosphide and ferrite, after etching
remains white. Figure 28 shows the microstruc-                                                                             with 4% nital. The same specimen was etched
                                                                                                                           with hot ASP (Table 2, etchant No. 4). This did
                                                                                                                           not tint the iron phosphide or the ferrite. Because
                                                                                                                           cementite is not present in the eutectic, the only
                                                                                                                           etching was of cementite in the pearlite, which
                                                                                                                           showed up very lightly. To reveal the microstruc-
                                                                                                                           ture of the eutectic, the specimen was next
                                                                                                                           etched with 4% nital. Figure 30 shows the results
                                                                                                                           after using hot ASP and then nital. Hot Murak-
                                                                                                                           ami’s reagent perfectly tinted the iron phosphide
                                                                                                                           in the binary phosphorous eutectic a brown
                                                                                                                           color, while pearlite was colorless, as shown in
                                                                                                                           Fig. 31.
                                                                                                                              Beraha-Martensite (B-M) (Table 2, etch No.
                                                                                                                           10) and aqueous 10% sodium metabisulfite
                                                                                                                           (SMB) (Table 2, etch No. 11) reagents for selec-
                                                                                                                           tive color etching are very useful in cases where
                                                                                                                           microstructural details are very fine and barely
                                                                                                                           visible after etching with nital. They reveal all
                                                                                                                           of the constituents, tinting them to expected col-
                                                                                                                           ors that are useful for verifying that the heat
                                                                                                                           treatment process was carried out correctly.
                                                                                                                              The B-M etchant is a mixture of stock solution
                                                                                                                           (1:5, HCl to water), potassium metabisulfite
                                                                                                                           (K2S2O5), and ammonium acid fluoride
                                                                                                                           (NH4F•HF). According to Ref 6, B-M tints mar-
                                                                                                                           tensite a blue color and bainite a brown color,
                                                                                                                           while the residual austenite and carbides remain
                                                                                                                           unaffected.
                                                              Fig. 43    As-cast high-chromium white iron (Fe-
                                                                                                                              The B-M etchant can be used for identification
Fig. 41    Same white iron as in Fig. 39 and 40 but as-                  4.52%C-0.4%Si-2.86%Mn-35.0%Cr-0.06%P-
                                                                                                                           of the constituents after heat treatment of cast
           cast. Eutectic carbides in austenitic matrix.      0.012%S). PC, primary carbides; EC, eutectic carbides,
Etched with glyceregia. 500                                   both M7C3 type. Etched with glyceregia. 500                  iron by tinting phases to different colors. It also


Fig. 42     Same as in Fig. 41 but after etching with Lich-   Fig. 44    Same as in Fig. 43 but after etching with Mu-     Fig. 45     Same as in Fig. 43 but as-polished and exam-
            tenegger and Bloech I. Austenite is dark brown,              rakami’s reagent (at room temperature). PC, or-               ined in differential interference contrast. Pri-
and dendritic segregation is visible around unaffected car-   ange primary carbides; EC, orange and gray eutectic car-     mary and eutectic carbides are sticking up from the softer
bides. 1000                                                   bides. 400                                                   austenitic matrix. 400
576 / Metallography and Microstructures of Ferrous Alloys


improves microstructural contrast, enhancing                crostructure of ADI after etching with 4% nital,              show the microstructure of the same specimen
visibility and permitting estimation of even                while Fig. 33 shows the same microstructure af-               after color etching, respectively, with B-M and
small amounts of the residual austenite (although           ter etching with 4% picral. Figures 34 and 35                 with aqueous 10% SMB etchants. The SMB tints
x-ray diffraction results are always more than                                                                            martensite a brown color and bainite a blue color,
10% greater than by light microscopy) and fine                                                                             while austenite and carbides are colorless. Both
carbides. Figure 32 shows the black-white mi-                                                                             etching time in B-M and the different crystallo-
                                                                                                                          graphic orientations affected the color of the
                                                                                                                          coarse, high-carbon martensitic plates, which
                                                                                                                          vary from blue to yellow. The brown areas in the
                                                                                                                          microstructure (Fig. 34) are the patches of fine
                                                                                                                          martensite. This color differentiation of micro-
                                                                                                                          structure occurs due to the change in size of the
                                                                                                                          plate martensite as transformation progresses.
                                                                                                                          However, this is not the only factor, because
                                                                                                                          some of the larger plates are also brown. There
                                                                                                                          is only a very small amount of austenite, which
                                                                                                                          surrounds the acicular ferrite at the graphite nod-
                                                                                                                          ules and in the matrix. The SMB etchant is even
                                                                                                                          more useful than the B-M etchant in the case
                                                                                                                          where the dominating phase in the ADI micro-
                                                                                                                          structure is martensite, and acicular ferrite is
                                                                                                                          weakly visible. In ADI, the martensite of both
                                                                                                                          types is tinted a brown color, the acicular ferrite
                                                                                                                          is colored the same as bainite, that is, blue color,
                                                                                                                          while austenite is colorless, which was shown in
                                                                                                                          Fig. 35 (see the section “Ductile Iron” in this
                                                                                                                          article).
                                                                                                                             Figure 36 shows the microstructure of ADI
                                                                                                                          after etching with 4% nital, while Fig. 37 and 38
                                                            Fig. 48    Same as Fig. 46 but examined in differential       show the same microstructure after etching with
                                                                       interference contrast. EC, eutectic carbides;      B-M and 10% SMB, respectively. Nital etched
                                                            SC, secondary carbides; and M, martensite. 1000               the acicular ferrite, while the austenite is white.
                                                                                                                          Some areas that were darkened may be marten-
                                                                                                                          site, but there is no clear distinction between
Fig. 46    Same white iron as in Fig. 39 but after slight
                                                                                                                          martensite and acicular ferrite with nital. Selec-
           etching with 4% nital and examined in bright-
field illumination. EC, eutectic carbides type M7C3; SC,
secondary carbides; and M, martensite. 1000


                                                            Fig. 49     Same white iron as in Fig. 14 and 15 but cast-
                                                                        ing was heat treated at 1000 C (1830 F), held
                                                            1 h, furnace cooled to 400 C (750 F) for 2 h, taken to salt
                                                            bath at 400 C (750 F), held 4 h, and air cooled. Examined
Fig. 47    Same as in Fig. 46 but examined in dark-field     in bright-field illumination. EC, eutectic carbides type       Fig. 50    Same as in Fig. 49 but examined in dark-field
           illumination. EC, eutectic carbides; SC, sec-    M7C3; SC, secondary carbides. Etched with glyceregia.                    illumination. EC, eutectic carbides; SC, sec-
ondary carbides; and M, martensite. 1000                    1000                                                          ondary carbides. 1000
Metallography and Microstructures of Cast Iron / 577


tive color etching with the two previously men-           B-M than with SMB), and austenite remained                          alloyed cast iron after heat treatment. The mi-
tioned reagents clearly revealed small patches of         colorless.                                                          crostructure, which is shown in Fig. 39, consists
martensite, which were blue after etching with              The same results were achieved with the use                       of brown patches of fine martensite (which may
B-M and brown after etching with 10% SMB;                 of B-M reagent to reveal the microstructure of                      have transformed from austenite during or after
acicular ferrite was colored blue (darker with                                                                                tempering), while the blue needles are high-car-
                                                                                                                              bon plate martensite. Figure 40 shows the mi-
                                                                                                                              crostructure of the same specimen after etching
                                                                                                                              with 4% nital; in this case, the recognition of
                                                                                                                              martensite is not straightforward.
                                                                                                                                 Figures 41 and 42 show the microstructure of
                                                                                                                              the same iron but in the as-cast condition after
                                                                                                                              etching with glyceregia and with Lichtenegger
                                                                                                                              and Bloech I (LBI), respectively (Table 2, etch-
                                                                                                                              ant No. 3 and 12). The LBI is an aqueous solu-
                                                                                                                              tion of ammonium bifluoride (NH4F•HF) and
                                                                                                                              potassium metabisulfite (K2S2O5) (Table 2, etch
                                                                                                                              No. 12). In chromium-nickel alloys, LB I tints
                                                                                                                              austenite, while carbides and ferrite (if present)
                                                                                                                              remain unaffected (white). Glyceregia outlines
                                                                                                                              only the eutectic carbides, while the LB I etchant
                                                                                                                              also reveals microsegregation. The microstruc-
                                                                                                                              ture shown in Fig. 42 consists of austenite, tinted
                                                                                                                              brown and blue color, and white (noncolored)
                                                                                                                              carbides. The blue austenitic areas surrounding


                                                          Fig. 53      Flake graphite in as-cast gray iron examined in
                                                                       crossed polarized light. As-polished. 200
Fig. 51   Graphite nodule examined in bright-field illu-
          mination. As-polished. 1000


                                                                                                                              Fig. 55   Flake graphite in as-cast gray iron examined
                                                                                                                                        with SEM. Sample was deeply etched with
                                                                                                                              50% HCl. 500


                                                          Fig. 54       Same as in Fig. 33 but microstructure was ex-
                                                                        amined in crossed polarized light. Acicular fer-      Fig. 56   Nodular graphite in as-cast ductile iron exam-
Fig. 52   Same as in Fig. 51, but graphite nodule was     rite is shining brightly; plate martensite is slightly gray-blue.             ined with SEM. Sample was deeply etched with
          examined in crossed polarized light. 1000       1000                                                                50% HCl. 1000
Vol92
Vol92
Vol92
Vol92
Vol92
Vol92
Vol92
Vol92
Vol92
Vol92
Vol92

Weitere ähnliche Inhalte

Was ist angesagt?

Paper on alluminizing
Paper on alluminizingPaper on alluminizing
Paper on alluminizinghrana287
 
TALAT Lecture 1205: Introduction to Mechanical Properties, Casting, Forming, ...
TALAT Lecture 1205: Introduction to Mechanical Properties, Casting, Forming, ...TALAT Lecture 1205: Introduction to Mechanical Properties, Casting, Forming, ...
TALAT Lecture 1205: Introduction to Mechanical Properties, Casting, Forming, ...CORE-Materials
 
Dr.R.Narayanasamy, Dr.S.Sivasankaran and Dr.K.Siva Prasad on Mechanical Alloying
Dr.R.Narayanasamy, Dr.S.Sivasankaran and Dr.K.Siva Prasad on Mechanical AlloyingDr.R.Narayanasamy, Dr.S.Sivasankaran and Dr.K.Siva Prasad on Mechanical Alloying
Dr.R.Narayanasamy, Dr.S.Sivasankaran and Dr.K.Siva Prasad on Mechanical AlloyingDr.Ramaswamy Narayanasamy
 
Study on hardening mechanisms in aluminium alloys
Study on hardening mechanisms in aluminium alloysStudy on hardening mechanisms in aluminium alloys
Study on hardening mechanisms in aluminium alloysIJERA Editor
 
Investigate Temperature Preheating on the Chill Plate to Identify Surface Cha...
Investigate Temperature Preheating on the Chill Plate to Identify Surface Cha...Investigate Temperature Preheating on the Chill Plate to Identify Surface Cha...
Investigate Temperature Preheating on the Chill Plate to Identify Surface Cha...Natalino Fonseca
 
A Study on Mechanical and Tribological Properties of Magnesium Alloy AZ31 Rei...
A Study on Mechanical and Tribological Properties of Magnesium Alloy AZ31 Rei...A Study on Mechanical and Tribological Properties of Magnesium Alloy AZ31 Rei...
A Study on Mechanical and Tribological Properties of Magnesium Alloy AZ31 Rei...ijsrd.com
 
CORROSION RESISTANCE OF Al-12Si-1Ti ALLOY REINFORCED WITH IN-SITU Mg2Si PARTI...
CORROSION RESISTANCE OF Al-12Si-1Ti ALLOY REINFORCED WITH IN-SITU Mg2Si PARTI...CORROSION RESISTANCE OF Al-12Si-1Ti ALLOY REINFORCED WITH IN-SITU Mg2Si PARTI...
CORROSION RESISTANCE OF Al-12Si-1Ti ALLOY REINFORCED WITH IN-SITU Mg2Si PARTI...FKK Güney Oto Takoz San. ve Tic. A.Ş
 
nanostructured high strength Mo alloy with unprecented tensile ductility..pptx
nanostructured high strength Mo alloy with unprecented tensile ductility..pptxnanostructured high strength Mo alloy with unprecented tensile ductility..pptx
nanostructured high strength Mo alloy with unprecented tensile ductility..pptxRishikeshrishi7
 
Du31580586
Du31580586Du31580586
Du31580586IJMER
 
2. 2009 oxid 20 cr pm 800 900c 100hr
2. 2009 oxid 20 cr pm 800 900c 100hr2. 2009 oxid 20 cr pm 800 900c 100hr
2. 2009 oxid 20 cr pm 800 900c 100hrLamiaaZaky1
 
IJERD (www.ijerd.com) International Journal of Engineering Research and Devel...
IJERD (www.ijerd.com) International Journal of Engineering Research and Devel...IJERD (www.ijerd.com) International Journal of Engineering Research and Devel...
IJERD (www.ijerd.com) International Journal of Engineering Research and Devel...IJERD Editor
 
Characteristics of Hypoeutectic Cu-Zr Alloy Rods Manufactured by Vertical Upw...
Characteristics of Hypoeutectic Cu-Zr Alloy Rods Manufactured by Vertical Upw...Characteristics of Hypoeutectic Cu-Zr Alloy Rods Manufactured by Vertical Upw...
Characteristics of Hypoeutectic Cu-Zr Alloy Rods Manufactured by Vertical Upw...Rautomead Limited
 

Was ist angesagt? (15)

Paper on alluminizing
Paper on alluminizingPaper on alluminizing
Paper on alluminizing
 
TALAT Lecture 1205: Introduction to Mechanical Properties, Casting, Forming, ...
TALAT Lecture 1205: Introduction to Mechanical Properties, Casting, Forming, ...TALAT Lecture 1205: Introduction to Mechanical Properties, Casting, Forming, ...
TALAT Lecture 1205: Introduction to Mechanical Properties, Casting, Forming, ...
 
Dr.R.Narayanasamy, Dr.S.Sivasankaran and Dr.K.Siva Prasad on Mechanical Alloying
Dr.R.Narayanasamy, Dr.S.Sivasankaran and Dr.K.Siva Prasad on Mechanical AlloyingDr.R.Narayanasamy, Dr.S.Sivasankaran and Dr.K.Siva Prasad on Mechanical Alloying
Dr.R.Narayanasamy, Dr.S.Sivasankaran and Dr.K.Siva Prasad on Mechanical Alloying
 
Study on hardening mechanisms in aluminium alloys
Study on hardening mechanisms in aluminium alloysStudy on hardening mechanisms in aluminium alloys
Study on hardening mechanisms in aluminium alloys
 
Icommet 2020
Icommet 2020Icommet 2020
Icommet 2020
 
Investigate Temperature Preheating on the Chill Plate to Identify Surface Cha...
Investigate Temperature Preheating on the Chill Plate to Identify Surface Cha...Investigate Temperature Preheating on the Chill Plate to Identify Surface Cha...
Investigate Temperature Preheating on the Chill Plate to Identify Surface Cha...
 
A Study on Mechanical and Tribological Properties of Magnesium Alloy AZ31 Rei...
A Study on Mechanical and Tribological Properties of Magnesium Alloy AZ31 Rei...A Study on Mechanical and Tribological Properties of Magnesium Alloy AZ31 Rei...
A Study on Mechanical and Tribological Properties of Magnesium Alloy AZ31 Rei...
 
V6 62
V6 62V6 62
V6 62
 
CORROSION RESISTANCE OF Al-12Si-1Ti ALLOY REINFORCED WITH IN-SITU Mg2Si PARTI...
CORROSION RESISTANCE OF Al-12Si-1Ti ALLOY REINFORCED WITH IN-SITU Mg2Si PARTI...CORROSION RESISTANCE OF Al-12Si-1Ti ALLOY REINFORCED WITH IN-SITU Mg2Si PARTI...
CORROSION RESISTANCE OF Al-12Si-1Ti ALLOY REINFORCED WITH IN-SITU Mg2Si PARTI...
 
nanostructured high strength Mo alloy with unprecented tensile ductility..pptx
nanostructured high strength Mo alloy with unprecented tensile ductility..pptxnanostructured high strength Mo alloy with unprecented tensile ductility..pptx
nanostructured high strength Mo alloy with unprecented tensile ductility..pptx
 
Du31580586
Du31580586Du31580586
Du31580586
 
2. 2009 oxid 20 cr pm 800 900c 100hr
2. 2009 oxid 20 cr pm 800 900c 100hr2. 2009 oxid 20 cr pm 800 900c 100hr
2. 2009 oxid 20 cr pm 800 900c 100hr
 
IJERD (www.ijerd.com) International Journal of Engineering Research and Devel...
IJERD (www.ijerd.com) International Journal of Engineering Research and Devel...IJERD (www.ijerd.com) International Journal of Engineering Research and Devel...
IJERD (www.ijerd.com) International Journal of Engineering Research and Devel...
 
Characteristics of Hypoeutectic Cu-Zr Alloy Rods Manufactured by Vertical Upw...
Characteristics of Hypoeutectic Cu-Zr Alloy Rods Manufactured by Vertical Upw...Characteristics of Hypoeutectic Cu-Zr Alloy Rods Manufactured by Vertical Upw...
Characteristics of Hypoeutectic Cu-Zr Alloy Rods Manufactured by Vertical Upw...
 
IJET-V2I5P25.pdf
IJET-V2I5P25.pdfIJET-V2I5P25.pdf
IJET-V2I5P25.pdf
 

Ähnlich wie Vol92

Cast Iron Metallurgy MP Sept_2009
Cast Iron Metallurgy MP Sept_2009Cast Iron Metallurgy MP Sept_2009
Cast Iron Metallurgy MP Sept_2009Ramesh Singh
 
Austempered ductile iron production properties applications
Austempered ductile iron production properties applicationsAustempered ductile iron production properties applications
Austempered ductile iron production properties applicationsSAIFoundry
 
Met 45 4_287_290_bockus
Met 45 4_287_290_bockusMet 45 4_287_290_bockus
Met 45 4_287_290_bockusUsman
 
WARM ROLLING OF PURE IRON.pptx
WARM ROLLING OF PURE IRON.pptxWARM ROLLING OF PURE IRON.pptx
WARM ROLLING OF PURE IRON.pptxsudhakargeruganti
 
introduction to Cast Iron
introduction to Cast Ironintroduction to Cast Iron
introduction to Cast Ironpulkit bajaj
 
Effect of dilution on microstructure and hardness of a nickel-base hardfacing...
Effect of dilution on microstructure and hardness of a nickel-base hardfacing...Effect of dilution on microstructure and hardness of a nickel-base hardfacing...
Effect of dilution on microstructure and hardness of a nickel-base hardfacing...RAMASUBBU VELAYUTHAM
 
Microstructural characterization and elastoplastic behaviour of high strengt
Microstructural characterization and elastoplastic behaviour of high strengtMicrostructural characterization and elastoplastic behaviour of high strengt
Microstructural characterization and elastoplastic behaviour of high strengtIAEME Publication
 
Oxide dispersion strengthened steels
Oxide dispersion strengthened steelsOxide dispersion strengthened steels
Oxide dispersion strengthened steelsJuliana Fortunato
 
detalied analysis of warm rolled steels.docx
detalied analysis of warm rolled steels.docxdetalied analysis of warm rolled steels.docx
detalied analysis of warm rolled steels.docxsudhakargeruganti
 
V5I9-IJERTV5IS090571
V5I9-IJERTV5IS090571V5I9-IJERTV5IS090571
V5I9-IJERTV5IS090571Teja Kunta
 
Metallurgical properties of cast irons
Metallurgical properties of cast irons Metallurgical properties of cast irons
Metallurgical properties of cast irons Yanie Hadzir
 

Ähnlich wie Vol92 (20)

Cast Iron Metallurgy MP Sept_2009
Cast Iron Metallurgy MP Sept_2009Cast Iron Metallurgy MP Sept_2009
Cast Iron Metallurgy MP Sept_2009
 
Part1.ppt
Part1.pptPart1.ppt
Part1.ppt
 
Austempered ductile iron production properties applications
Austempered ductile iron production properties applicationsAustempered ductile iron production properties applications
Austempered ductile iron production properties applications
 
Cast iron
Cast iron Cast iron
Cast iron
 
10251432.ppt
10251432.ppt10251432.ppt
10251432.ppt
 
Cast iron its types , properties and its applications....
Cast iron its types , properties and its applications....Cast iron its types , properties and its applications....
Cast iron its types , properties and its applications....
 
Met 45 4_287_290_bockus
Met 45 4_287_290_bockusMet 45 4_287_290_bockus
Met 45 4_287_290_bockus
 
WARM ROLLING OF PURE IRON.pptx
WARM ROLLING OF PURE IRON.pptxWARM ROLLING OF PURE IRON.pptx
WARM ROLLING OF PURE IRON.pptx
 
introduction to Cast Iron
introduction to Cast Ironintroduction to Cast Iron
introduction to Cast Iron
 
B012260510
B012260510B012260510
B012260510
 
Effect of dilution on microstructure and hardness of a nickel-base hardfacing...
Effect of dilution on microstructure and hardness of a nickel-base hardfacing...Effect of dilution on microstructure and hardness of a nickel-base hardfacing...
Effect of dilution on microstructure and hardness of a nickel-base hardfacing...
 
Micro
MicroMicro
Micro
 
Microstructural characterization and elastoplastic behaviour of high strengt
Microstructural characterization and elastoplastic behaviour of high strengtMicrostructural characterization and elastoplastic behaviour of high strengt
Microstructural characterization and elastoplastic behaviour of high strengt
 
Nickel base superalloys
Nickel base superalloysNickel base superalloys
Nickel base superalloys
 
Oxide dispersion strengthened steels
Oxide dispersion strengthened steelsOxide dispersion strengthened steels
Oxide dispersion strengthened steels
 
Heat Treatment: Lecture Q&P, M3 concept
Heat Treatment: Lecture Q&P, M3 conceptHeat Treatment: Lecture Q&P, M3 concept
Heat Treatment: Lecture Q&P, M3 concept
 
detalied analysis of warm rolled steels.docx
detalied analysis of warm rolled steels.docxdetalied analysis of warm rolled steels.docx
detalied analysis of warm rolled steels.docx
 
V5I9-IJERTV5IS090571
V5I9-IJERTV5IS090571V5I9-IJERTV5IS090571
V5I9-IJERTV5IS090571
 
Metallurgical properties of cast irons
Metallurgical properties of cast irons Metallurgical properties of cast irons
Metallurgical properties of cast irons
 
Cast iron
Cast ironCast iron
Cast iron
 

Mehr von Usman

Brinell hardness new
Brinell hardness newBrinell hardness new
Brinell hardness newUsman
 
Stress at a point
Stress at a point Stress at a point
Stress at a point Usman
 
Micro hardness testing
Micro hardness testingMicro hardness testing
Micro hardness testingUsman
 
Rockwell hardnes testing
Rockwell hardnes testingRockwell hardnes testing
Rockwell hardnes testingUsman
 
Auto cad commands-1
Auto cad commands-1Auto cad commands-1
Auto cad commands-1Usman
 
Vol92
Vol92Vol92
Vol92Usman
 
Tutorial ihm
Tutorial ihmTutorial ihm
Tutorial ihmUsman
 
Metallography of cast iron
Metallography of cast ironMetallography of cast iron
Metallography of cast ironUsman
 
Metallography of cast iron
Metallography of cast ironMetallography of cast iron
Metallography of cast ironUsman
 
Howto2 two piece mold
Howto2 two piece moldHowto2 two piece mold
Howto2 two piece moldUsman
 
Castdefect
CastdefectCastdefect
CastdefectUsman
 
Energy engineering
Energy engineeringEnergy engineering
Energy engineeringUsman
 

Mehr von Usman (12)

Brinell hardness new
Brinell hardness newBrinell hardness new
Brinell hardness new
 
Stress at a point
Stress at a point Stress at a point
Stress at a point
 
Micro hardness testing
Micro hardness testingMicro hardness testing
Micro hardness testing
 
Rockwell hardnes testing
Rockwell hardnes testingRockwell hardnes testing
Rockwell hardnes testing
 
Auto cad commands-1
Auto cad commands-1Auto cad commands-1
Auto cad commands-1
 
Vol92
Vol92Vol92
Vol92
 
Tutorial ihm
Tutorial ihmTutorial ihm
Tutorial ihm
 
Metallography of cast iron
Metallography of cast ironMetallography of cast iron
Metallography of cast iron
 
Metallography of cast iron
Metallography of cast ironMetallography of cast iron
Metallography of cast iron
 
Howto2 two piece mold
Howto2 two piece moldHowto2 two piece mold
Howto2 two piece mold
 
Castdefect
CastdefectCastdefect
Castdefect
 
Energy engineering
Energy engineeringEnergy engineering
Energy engineering
 

Vol92

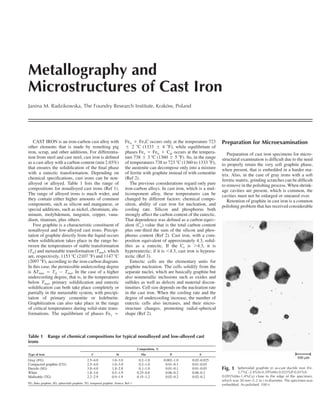
  • 1. Metallography and Microstructures of Cast Iron Janina M. Radzikowska, The Foundry Research Institute, Krakow, Poland ´ CAST IRON is an iron-carbon cast alloy with Fe Fe3C occurs only at the temperature 723 Preparation for Microexamination other elements that is made by remelting pig 2 C (1333 4 F), while equilibrium of iron, scrap, and other additions. For differentia- phases Fec Fe Cgr occurs at the tempera- Preparation of cast iron specimens for micro- tion from steel and cast steel, cast iron is defined ture 738 3 C (1360 5 F). So, in the range structural examination is difficult due to the need as a cast alloy with a carbon content (min 2.03%) of temperatures 738 to 723 C (1360 to 1333 F), to properly retain the very soft graphite phase, that ensures the solidification of the final phase the austenite can decompose only into a mixture when present, that is embedded in a harder ma- with a eutectic transformation. Depending on of ferrite with graphite instead of with cementite trix. Also, in the case of gray irons with a soft chemical specifications, cast irons can be non- (Ref 2). ferritic matrix, grinding scratches can be difficult alloyed or alloyed. Table 1 lists the range of The previous considerations regard only pure to remove in the polishing process. When shrink- compositions for nonalloyed cast irons (Ref 1). iron-carbon alloys. In cast iron, which is a mul- age cavities are present, which is common, the The range of alloyed irons is much wider, and ticomponent alloy, these temperatures can be cavities must not be enlarged or smeared over. they contain either higher amounts of common changed by different factors: chemical compo- Retention of graphite in cast iron is a common components, such as silicon and manganese, or sition, ability of cast iron for nucleation, and polishing problem that has received considerable special additions, such as nickel, chromium, alu- cooling rate. Silicon and phosphorus both minum, molybdenum, tungsten, copper, vana- strongly affect the carbon content of the eutectic. dium, titanium, plus others. That dependence was defined as a carbon equiv- Free graphite is a characteristic constituent of alent (Ce) value that is the total carbon content nonalloyed and low-alloyed cast irons. Precipi- plus one-third the sum of the silicon and phos- tation of graphite directly from the liquid occurs phorus content (Ref 2). Cast iron, with a com- when solidification takes place in the range be- position equivalent of approximately 4.3, solid- tween the temperatures of stable transformation ifies as a eutectic. If the Ce is 4.3, it is (Tst) and metastable transformation (Tmst), which hypereutectic; if it is 4.3, cast iron is hypoeu- are, respectively, 1153 C (2107 F) and 1147 C tectic (Ref 3). (2097 F), according to the iron-carbon diagram. Eutectic cells are the elementary units for In this case, the permissible undercooling degree graphite nucleation. The cells solidify from the is DTmax Tst Tmst. In the case of a higher separate nuclei, which are basically graphite but undercooling degree, that is, in the temperatures also nonmetallic inclusions such as oxides and below Tmst, primary solidification and eutectic sulfides as well as defects and material discon- solidification can both take place completely or tinuities. Cell size depends on the nucleation rate partially in the metastable system, with precipi- in the cast iron. When the cooling rate and the tation of primary cementite or ledeburite. degree of undercooling increase, the number of Graphitization can also take place in the range eutectic cells also increases, and their micro- of critical temperatures during solid-state trans- structure changes, promoting radial-spherical formations. The equilibrium of phases Fec shape (Ref 2). Table 1 Range of chemical compositions for typical nonalloyed and low-alloyed cast irons Composition, % Type of iron C Si Mn P S Gray (FG) 2.5–4.0 1.0–3.0 0.2–1.0 0.002–1.0 0.02–0.025 Compacted graphite (CG) 2.5–4.0 1.0–3.0 0.2–1.0 0.01–0.1 0.01–0.03 Ductile (SG) 3.0–4.0 1.8–2.8 0.1–1.0 0.01–0.1 0.01–0.03 Fig. 1 Spheroidal graphite in as-cast ductile iron (Fe- White 1.8–3.6 0.5–1.9 0.25–0.8 0.06–0.2 0.06–0.2 3.7%C-2.4%Si-0.59%Mn-0.025%P-0.01%S- Malleable (TG) 2.2–2.9 0.9–1.9 0.15–1.2 0.02–0.2 0.02–0.2 0.095%Mo-1.4%Cu) close to the edge of the specimen, which was 30 mm (1.2 in.) in diameter. The specimen was FG, flake graphite; SG, spheroidal graphite; TG, tempered graphite. Source: Ref 1 embedded. As-polished. 100
  • 2. 566 / Metallography and Microstructures of Ferrous Alloys attention. Coarse grinding is a critical stage, so, will be seen as an open or collapsed cavity. Sil- age. Fresh paper should always be used; never if the soft graphite is lost during coarse grinding, icon carbide (SiC) grinding papers are preferred grind with worn paper. White iron, by contrast, it cannot be recovered in subsequent steps and to emery, because SiC cuts efficiently, while em- contains extremely hard iron carbides that resist ery paper does not, and SiC produces less dam- abrasion and tend to remain in relief above the softer matrix after polishing (Ref 4). Quality-control studies, based on image anal- ysis measurements of the amount of phases and the graphite shape and size, also need perfectly prepared specimens with fully retained graphite phase and with microstructural constituents cor- rectly revealed by etching. Specimen Preparation. The metallographic specimen preparation process for microstructural investigations of cast iron specimens usually consists of five stages: sampling, cold or hot mounting, grinding, polishing, and etching with a suitable etchant to reveal the microstructure. Each stage presents particular problems in the case of cast iron. Of course, the graphite phase is studied after polishing and before etching. Sampling is the first step—selecting the test location or locations to be evaluated metallo- graphically. Usually, cast iron castings have a considerable variation in microstructure between surface and core. Selection of the test location is very important to obtain representative results from the microstructural examination. Samples can be obtained by cutting them out from either a large or small casting or from standard test bars, such as microslugs, ears, or keel bars; how- ever, the microstructure of these pieces may not be representative for the actual casting due to Fig. 2 Same as-cast ductile iron as in Fig. 1, but the substantial differences in the solidification rates. specimen was not embedded. The arrows show Fig. 4 Same as in Fig. 3 but close to the center of the Production saws, such as large, abrasive cutoff the pulled-out graphite. As-polished. 100 specimen. As-polished. 100 saws, band saws, or power hacksaws, can be used for dividing medium-sized casting into smaller samples. In the case of very large cast- ings, flame cutting may be used. Next, the pieces Fig. 5 Temper graphite in malleable iron (Fe-2.9%C- 1.5%Si-0.53%Mn-0.06%P-0.22%S-0.08%Ni- 0.1%Cu-0.09%Cr-0.003%Bi) after grinding on P1000 SiC Fig. 3 Flake graphite in as-cast gray iron (Fe-3.5%C- waterproof paper. The casting was annealed at 950 C 2.95%Si-0.40%Mn-0.08%P-0.01%S-0.13%Ni- (1740 F), held 10 h, furnace cooled to 720 C (1330 F), Fig. 6 Same as in Fig. 5 but after polishing with 9 lm 0.15%Cu) close to the edge of the unembedded specimen, held 16 h, and air cooled. The arrows show the pulled-out diamond suspension. The arrows show the which was 30 mm (1.2 in.) in diameter. As-polished. 100 graphite. As-polished. 400 pulled-out graphite. As-polished. 400
  • 3. Metallography and Microstructures of Cast Iron / 567 can be reduced to the desired size for metallo- sectioned by flame cutting, the specimen must nodules were perfectly retained. Figures 3 and 4 graphic specimens by using a laboratory abra- be removed well away from the heat-affected show that the uniform grinding of nonmounted sive cutoff saw or a band saw. If the casting was zone. The pieces cut out for metallographic ex- specimens is more difficult, and the flake graph- amination may be ground prior to mounting (this ite in gray iron close to the edge of such a spec- may be done to round off sharp cut edges or to imen is not polished perfectly, in comparison to reduce the roughness of band-saw-cut surfaces) well-polished graphite in the mounted specimen. and subsequent preparation. Overheating is Grinding and Polishing. To ensure proper avoided by proper selection of the speed of cut- graphite retention, the use of an automated off saws, the use of the correct wheel, and ade- grinding-polishing machine is recommended quate water cooling. Overheating during grind- over manual preparation. The automated equip- ing is avoided by using fresh abrasive paper and ment makes it possible, in comparison to manual proper cooling. When metallographic specimens specimen preparation, to properly control the are cut out from the standard cast bars, they are orientation of the specimen surface relative to sometimes prepared using standard machine the grinding or polishing surface, to maintain shop equipment, such as turning in a lathe or constantly the desired load on the specimens, to milling. These devices can deform the testpiece uniformly rotate the specimens relative to the surfaces to a considerable depth, so care must be work surface, and to control the time for each exercised to remove any damage from these preparation step. Proper control of these factors operations before starting specimen preparation. influences graphite retention, although other fac- Mounting. Specimens can be mounted in a tors are also important. polymeric material using either cold or hot A good, general principle is to minimize the mounting procedures. The mounting resin is number of grinding and polishing stages. Also, chosen depending on the cast iron hardness (soft the load on each specimen, or on all specimens or hard) and the need to enhance edge retention. in the holder, must be chosen to obtain a cor- Use of an incorrect resin, or ignoring the mount- rectly polished surface in the shortest possible ing process, can make it very difficult to obtain time. This precludes the risk of pulling out the properly polished graphite in the area close to graphite phase and ensures that the graphite pre- the specimen edge. Figures 1 and 2 show the cipitates will be perfectly flat with sharp bound- microstructure of spheroidal graphite in ductile aries. iron close to the edge of the specimens, which The recommended procedure for automated were cut off from a 30 mm (1.2 in.) diameter bar preparation of the specimens of nonalloyed and and polished with and without embedding in a low-alloyed cast iron with graphite specimens is Fig. 7 Same as in Fig. 6 but after final polishing with polymer resin, respectively. In the specimen pre- to grind with a high-quality, waterproof 220- or the 1 lm diamond paste applied on a napless cloth. Graphite is free of any visible pullouts. As-polished. pared without embedding in a resin, the graphite 240-grit (or equivalent) SiC paper until plane, 400 was pulled out, while in the specimen that was with a load of 100 N for six specimens mounted embedded in a resin and prepared, the graphite in the sample holder, with central loading. Pol- Fig. 9 White high-chromium iron (Fe-3.2%C-4.65%Cr- Fig. 10 White high-chromium iron (Fe-3.16%C- 2.9%Mn-0.51%Si-0.050%P-0.024%S). Eutectic 8.86%Cr-0.50%Si-3.04%Mn-0.051%P- and secondary carbides in the matrix. Specimen was pre- 0.018%S). Eutectic and secondary carbides in the matrix. Fig. 8 Same as in Fig. 7 but after final polishing with pared correctly. The casting was austenitized at 1000 C Specimen was prepared incorrectly. The casting was aus- the 1 lm diamond suspension applied on a (1830 F), held 1 h, furnace cooled to 400 C (750 F) for tenitized at 1000 C (1830 F), held 1 h, furnace cooled to napped cloth. The arrows show the pulled-out graphite. As- 2 h, taken to salt bath at 400 C (750 F), held for 4 h, and 700 C (1290 F) for 2 h, taken to salt bath at 700 C (1290 polished. 400 air cooled. Etched with glyceregia. 500 F), held 4 h, and air cooled. Etched with glyceregia. 500
  • 4. 568 / Metallography and Microstructures of Ferrous Alloys ishing is carried out in four steps with a different P220 SiC paper and then polishing with 9 lm better using diamond paste and the preferred lu- grain size diamond paste: diamond paste according to the procedure given bricant than with an aqueous suspension, al- previously. In both cases, there is some pulled- though more work needs to be conducted to de- out graphite after these steps. Each specimen was termine if this difference is important. Final Diamond paste Load, Recommended prepared further. The specimen ground with polishing with an alumina suspension, such as Step grain size, lm N Duration polishing cloth three SiC steps was polished with 3 lm diamond Masterprep alumina (Buehler, Ltd.), makes the 1 9 120(a) 5 min(d) Napless woven suspension on a napless cloth and then with 1 graphite boundaries sharper by removing the 2 3 120(a) 3 min(d) Napless woven lm diamond suspension on a napped cloth. The matrix, which was smeared over the edge of the 3 1 120(a) 2 min(d) Napless woven 4 (b) 25(c) 45–60 s(e) Napless synthetic pulled-out graphite was still visible. However, graphite during grinding and was not removed polyurethane the specimen ground with P220 SiC and pol- by the diamond polishing steps. (a) Load per six specimens. (b) Aqueous 0.05 lm alumina suspension. ished with 9 lm diamond paste, when finished Alloyed chromium iron is much harder, and a (c) Load per single specimen (switching to individual force to make with the recommended practice given previ- different preparation procedure must be used. specimen cleaning easier). (d) Comp direction. (e) Contra ously, was free of any visible pullouts, as shown The grinding process is carried out in three steps, in Fig. 7. By using a napped cloth and an aque- and polishing is carried out in three steps, al- ous 1 lm diamond suspension for the final dia- though only two polishing steps are needed for Figure 5 shows temper graphite in malleable mond polishing step, it was impossible to obtain most routine work. Grinding of the specimens, iron after the last step of grinding, which was perfectly retained graphite, as shown in Fig. 8. mounted in the sample holder, used central load- carried out in three steps using, consecutively, Napped cloths should not be used with diamond ing (150 N/six specimens), with high-quality SiC grit papers P220, P500, and P1000. Figure abrasive, either in paste, suspension, or aerosol SiC waterproof paper (water cooled) with the 6 shows the same specimen after grinding on form. Graphite retention appears to be slightly following grit sizes: Table 2 Etchants No. of etchant Name of etchant Composition Comments Ref 1 Nital 96–98 mL ethanol Most common etchant for iron, carbon, alloyed steels, and cast iron. Reveals 4, p 648 2–4 mL nitric acid (HNO3) alpha grain boundaries and constituents. The 2 or 4% solution is commonly used. Use by immersion of sample for up to 60 s. 2 Picral 4 g picric acid ((NO2)3C6H2OH) Recommended for structures consisting of ferrite and carbides. Does not reveal 4, p 648 100 mL ethanol ferrite grain boundaries and martensite as-quenched. Addition of approximately 0.5–1% zephiran chloride improves etch rate and uniformity. 3 Glyceregia (modified) 3 parts glycerine For austenitic stainless steels and cast irons. Reveals grain structure; outlines 4, p 634 2 parts hydrochloric acid (HCl) sigma and carbides. Mix fresh; do not store. Use by swabbing. Heat up to 50 1 part nitric acid (HNO3) C (120 F) when etching time at 20 C (70 F) does not bring results. 4 Alkaline sodium picrate 2 g picric acid ((NO2)3C6H2OH)) Immerse sample in solution at 60–70 C (140–160 F) for 1–3 min. Colors 4, p 646 (ASP) 25 g sodium hydroxide (NaOH) cementite (Fe3C) dark brown to black, depending on etching time. 100 mL distilled water 5 Klemm I 50 mL sat. aq. sodium thiosulfate Immerse sample for 40–100 s. Reveals phosphorus segregation (white); colors 4, p 642 (Na2S2O3•5H2O) ferrite blue or red; martensite brown; cementite and austenite are unaffected 1 g potassium metabisulfite (K2S2O5) 6 Beraha CdS 240 g aq. sodium thiosulfate Tint etch for iron, steel, cast irons, and ferritic and martensitic stainless steel. 4, p 644 (Na2S2O3•5H2O) Dissolve in order shown. Allow each to dissolve before adding next. Allow to 30 g citric acid (C6H8O7•H2O) age 24 h at 20 C (70 F) in a dark bottle. Before use, filter 100 mL of solution 20–25 g cadmium chloride to remove precipitates. Preetch with a general-purpose reagent. Etch 20–90 s; (CdCl2•2.5H2O) good for 4 h. For steels and cast irons, after 20–40 s only ferrite is colored, red 100 mL distilled water or violet. Longer times color all constituents: ferrite is colored yellow or light blue; phosphide, brown; carbide, violet or blue. For stainless steels, immerse sample 60–90 s; carbides are colored red or violet-blue; matrix, yellow; colors of ferrite vary. Sulfides red-brown after 90 s 7 ... 28 g sodium hydroxide (NaOH) Immerse sample in hot solution (close to boiling temperature) for 30–60 min. This 6 4 g picric acid ((NO2)3C6H2OH)) reagent reveals silicon segregation in ductile iron. The colors of microstructure 1 g potassium metabisulfite (K2S2O5)(a) change themselves from green through red, yellow, blue, and dark brown to 100 mL distilled water light brown as the silicon content is reduced from the graphite nodule to cell boundaries. The regions with lowest silicon content at the cell boundaries remain colorless. Before etching, ferritization of the specimen is recommended to enhance the visibility of the colors. 8 Murakami reagent 10 g potassium ferricyanide (K3Fe(CN)6) Use fresh, cold or hot. Cold, at 20 C (70 F) for up to 1.5 min, tints chromium 4, p 646 10 g potassium hydroxide (KOH) or carbides; Fe3C unattacked or barely attacked. Hot, at 50 C (120 F) for 3 min, sodium hydroxide (NaOH) tints iron phosphide. The higher temperature or etching time also tints 100 mL distilled water cementite into yellow color. 9 Beraha reagent with selenic 2 mL hydrochloric acid (HCl) For differentiation of the constituents in steadite in cast iron, immerse sample for 4, p 643 acid 0.5 mL selenic acid (H2SeO4) 7–10 min; iron phosphide colored blue or green, cementite colored red, and 100 mL ethanol ferrite is bright (unaffected). Preetching with nital is recommended. 10 Beraha-Martensite (B-M) 2 g ammonium bifluoride (NH4F•HF) Immerse sample for 1–3 s. Coarse martensite is blue or yellow; fine martensite 6, p 26 2 g potassium metabisulfite (K2S2O5) and bainite are brown. Use fresh reagent, and wet sample with tap water before 100 mL stock solution: 1:5, HCl to etching. distilled water 11 10% sodium metabisulfite 10 g sodium pyrosulfite (Na2S2O5) Tints as-quenched martensite into brown; bainite into blue; carbides, phosphides, 4, p 642 (SMB)(b) 100 mL distilled water and residual austenite, unaffected. Immerse sample in etchant solution approximately 20 s. Preetching sample with nital is recommended. 12 Lichtenegger and Bloech I 20 g ammonium bifluoride (NH4F•HF) Dissolve in given order. In austenitic Cr-Ni alloys, it tints austenite and reveals 7, p 51 (LB I) 0.5 g potassium metabisulfite (K2S2O5) dendritic segregation. Ferrite and carbides remain unaffected. Wet-etch for 1–5 100 mL hot distilled water min immediately after polishing. 13 ... 50% aq. hydrochloric acid (HCl) Immerse sample for 30–90 min. Every 15–20 min, wash sample with distilled 8, p 97 water, quickly etch in hydrofluoric acid (conc.), and wash in tap water. When the etching process is finished, immerse sample in 5% aq. KOH or NaOH for 10–20 min, wash with distilled water in an ultrasonic washer, then in ethanol, and dry with blowing hot air. (a) Potassium metabisulfite and potassium pyrosulfite are both synonomous with K2 S2 O5. (b) Sodium metabisulfite and sodium pyrosulfite are synonomous with Na2S2O5.
  • 5. Metallography and Microstructures of Cast Iron / 569 ● First step: P220 grit until plane. ● First step: 3 lm diamond, 120 N load/six polyurethane pad but in a single specimen ● Second step: P500 grit for 3 min. specimens for 3 min with a napless cloth. holder with an individual load of 30 N for 1.5 ● Third step: P1000 grit for 3 min ● Second step: 1lm diamond, 100 N load/six min. specimens for 3 min with a napless cloth Figure 9 shows the microstructure of a heat Polishing is done in three steps, with different treated chromium iron after this preparation. The grain size diamond in paste for the first two steps: The last polishing step is carried out with a col- carbides are perfectly flat, with very sharp edges loidal silica suspension on a napless synthetic and boundaries etched uniformly. Figure 10 shows the primary eutectic carbides in the mi- crostructure of a high-chromium iron. They ap- pear to be sticking out from the matrix, and their boundaries are not outlined uniformly. This re- sult occurs if the load is too low or the final pol- ishing time on the silica suspension is too long. Both problems will result in too much removal of the softer matrix that was surrounding the pri- mary carbides. During grinding, the paper must be moistened with flowing tap water, and the specimens should be washed with water after each step. Also, dur- ing the first planning step, the sheet of paper should be changed every 1 min. Used grit paper is not effective and will introduce heat and dam- age, impairing specimen flatness. During polish- ing with diamond paste from a tube, the cloth is moistened with the recommended lubricant for the paste. If a water-based diamond suspension is applied on the cloth, the use of an additional lubricant is not required. The speed of the grinding-polishing head was 150 rpm, and it was constant. The speed of the platen during grinding was always 300 rpm, and during polishing was always 150 rpm. After each Fig. 11 Ductile iron (Fe-3.8%C-2.4%Si-0.28%Mn- grinding step, the specimens were washed with 1.0%Ni-0.05%Mg) after annealing. Ferrite and approximately 5% pearlite. Etched with 2% nital. 100 . running tap water and dried with compressed air, Courtesy of G.F. Vander Voort, Buehler Ltd. while after each polishing step, they were Fig. 13 Same as in Fig. 12 but after etching with 4% washed with alcohol and dried with hot air from picral. Pearlite was etched uniformly. 500 a hair dryer. Fig. 12 As-cast gray iron (Fe-2.8%C-0.8%Si-0.4%Mn- Fig. 14 As-cast high-chromium white iron (Fe- 0.1%S-0.35%P-0.3%Cr). Pearlite. Etched with 1.57%C-18.64%Cr-2.86%Mn-0.53%Si- 4% nital. Arrows show the white areas with weakly etched 0.036%P-0.013%S). Eutectic chromium carbides type Fig. 15 Same as in Fig. 14 but after etching with 4% or nonetched pearlite. 500 M7C3 in austenitic matrix. Etched with glyceregia. 500 nital. 500
  • 6. 570 / Metallography and Microstructures of Ferrous Alloys Microexamination Methods cation and morphology. One should always be- Standard Etchants. To see the microstruc- gin microstructural investigations by examining tural details, specimens must be etched. Etching Chemical Etching. The examination of the the as-polished specimen before etching. This is methods based on chemical corrosive processes iron microstructure with a light optical micro- a necessity, of course, for cast iron specimens, if have been used by metallographers for many scope is always the first step for phase identifi- one is to properly examine the graphite phase. years to reveal structures for black-and-white imaging. Specimens of nonalloyed and low-alloyed irons containing ferrite, pearlite, the phosphorus eutectic (steadite), cementite, martensite, and bainite can be etched successfully with nital at room temperature to reveal all of these micro- structural constituents. Usually, this is a 2 to 4% alcohol solution of nitric acid (HNO3) (Table 2, etch No. 1). Figure 11 shows a nearly ferritic annealed ductile iron with uniformly etched grain boundaries of ferrite and a small amount of pearlite. Nital is very sensitive to the crystal- lographic orientation of pearlite grains, so, in the case of a fully pearlitic structure, it is recom- mended to use picral, which is an alcohol solu- tion of 4% picric acid (Table 2, etch No. 2). Fig- ures 12 and 13 show the differences in revealing the microstructure of pearlite with nital or picral. Picral does not etch the ferrite grain boundaries, or as-quenched martensite, but it etches the pear- litic structure more uniformly, while nital leaves white, unetched areas, especially in the case where pearlite is very fine. When the austempering heat treatment is very short, the microstructure of austempered ductile iron (ADI) consists of martensite and a small amount of acicular ferrite. After etching in 4% nital, martensite as well as acicular ferrite are both etched intensively, which makes it very dif- Fig. 18 As-cast gray iron (Fe-3.24%C-2.32%Si- Fig. 16 As-cast ductile iron (Fe-3.07%C-0.06%Mn- 0.54%Mn-0.71%P-0.1%S). E, phosphorous 2.89%Si-0.006%P-0.015%S-0.029%Mg). C, ternary eutectic. Etched with 4% nital. 100 cementite; L, ledeburite; F, ferrite; and P, pearlite. Etched with 4% nital. 650 (microscopic magnification 500 ) Fig. 17 Same as in Fig. 16 but after etching with hot Fig. 20 Austempered ductile iron (Fe-3.6%C-2.5%Si- alkaline sodium picrate. C, eutectic cementite; Fig. 19 Same as in Fig. 18 but after etching with Klemm 0.06%P-1.5%Ni-0.7%Cu). CB, cell bound- L, ledeburite; F, ferrite; and P, pearlite with slightly etched I reagent. E, phosphorous ternary eutectic. aries; H, ferritic halo around the graphite nodules. Etched cementite. 650 (microscopic magnification 500 ) 100 with Klemm I reagent. 200
  • 7. Metallography and Microstructures of Cast Iron / 571 ficult to distinctly see the needles of acicular fer- which was 2 min, because the martensite was as- stored in the lab than nital, which can be an ex- rite. Picral reveals this phase very well; marten- quenched. The needles of acicular ferrite are plosive mixture under certain conditions when it site is barely etched due to the very short dark and very sharp (Fig. 32, 33). In this case, is stored in a tightly closed bottle. austempering heat treatment of the specimen, picral is very convenient for estimating the Glyceregia (Table 2, etch No. 3), which is a amount and morphology of the acicular ferrite in mixture of glycerine, hydrochloric acid (HCl), the ADI microstructure. Picral is safer to be and nitric acid (HNO3), is recommended for re- vealing the microstructure of high-chromium and chromium-nickel-molybdenum irons. Fig- ure 14 shows the microstructure of a high-chro- mium cast iron after etching with glyceregia (see also Fig. 43, 49, and 96). Nital can be also used for revealing the carbide morphology in the mi- crostructure of chromium or chromium-nickel irons when the carbon and chromium content promotes solidification of eutectic carbides. When the microstructure of a high-chromium white iron contains columnar primary carbides, glyceregia is recommended. Figure 15 shows the microstructure of the same cast iron as Fig. 14 but after etching with 4% nital (see also Fig. 40, 41). Both etchants reveal carbide boundaries sharply and uniformly. Selective Color Etching. If the black-and- white etchants are inadequate for positive iden- tification of the iron microstructures, other pro- cedures must be used, such as selective color etching. The reagents referred to as tint etchants are usually acidic solutions with either water or alcohol as a solvent. They are chemically bal- anced to deposit a thin (40 to 500 nm), trans- parent film of oxide, sulfide, complex molyb- date, elemental selenium, or chromate on the specimen surface. Coloration is developed by in- Fig. 21 Same as in Fig. 20 but after etching with Ber- Fig. 23 As-cast gray iron (Fe-3.33%C-1.64%Si- terference between light rays reflected at the in- 0.31%Mn-1.37%P-0.107%S). Ternary phos- aha’s CdS reagent. H, ferritic halo; CB, cell phorus eutectic. Etched with 4% nital. 1300 (micro- boundaries. 250 scopic magnification 1000 ) Fig. 22 Nodular iron (Fe-3.9%C-2.9%Si-0.32%Mn- 0.06%P-0.037%Mg-1.5%Ni-0.57%Cu). Sili- Fig. 25 Same as in Fig. 23 but after etching with Klemm con microsegregation was revealed. The casting was an- Fig. 24 Same as in Fig. 23 but after etching with hot I reagent. F, ferrite; C, cementite; and C IP, nealed. Etched with hot aqueous solution of sodium alkaline sodium picrate. C, cementite; F, ferrite cementite iron phosphide inside the precipitate of phos- hydroxide, picric acid, and potassium pyrosulfite (Table 2, (unaffected); IP, iron phosphide ferrite; and TiN, titanium phorous eutectic. 1300 (microscopic magnification etchant No. 7). 500 nitride. 1300 (microscopic magnification 1000 ) 1000 )
  • 8. 572 / Metallography and Microstructures of Ferrous Alloys ner and outer film surfaces. Crystallographic ori- is invaluable for quantitative metallography, a eburite, the differentiation of the white structural entation, local chemical composition, and field of growing importance (Ref 5). constituents is difficult after etching a specimen etching time affect film thickness and control When ferritic-pearlitic microstructures of cast with nital. In such cases, hot alkaline sodium pic- color production. The use of selective etchants iron contain large amounts of cementite and led- rate (ASP) is recommended (Table 2, etch No. 4), which reveals cementite, tinted a brown color, while ferrite remains unaffected. This etch is a mixture of sodium hydroxide (NaOH), picric acid, and distilled water. Figure 16 shows the microstructure of a thin-walled, chilled ductile iron casting after etching with nital, while Fig. 17 shows the microstructure of the same speci- men after etching with ASP; the brown-colored cementite and ledeburite are clearly visible in the pearlitic-ferritic matrix (the cementite in pearlite was also slightly tinted). It allows one to esti- mate the amount of cementite that should be re- moved from the casting microstructure in the an- nealing process. Segregation of silicon and phosphorus in iron is very strong and can be revealed with selective color etching methods. Klemm’s I reagent (Table 2, etch No. 5), which tints ferrite while austenite and carbides remain colorless, consists of potassium metabisulfite (K2S2O5) and a cold-sat- urated water solution of sodium thiosulfate (Na2S2O3•5H2O) and is one of the etchants that can be used to reveal phosphorus and silicon seg- regation. Usually, the distribution of the phosphorus eu- tectic, which solidifies in gray iron on the cell Fig. 28 Same as in Fig. 25 but after etching with Ber- boundaries, is revealed by etching up to 4 min aha’s reagent with selenic acid. IP, iron phos- phide; C, cementite; and F, ferrite. The dark points in pearl- in 4% nital. Figure 18 shows the microstructure Fig. 26 Same as in Fig. 23 but after etching with hot ite, which look like artifacts, can be iron phosphide of as-cast gray iron with the ternary phosphorous Murakami’s reagent. IP, iron phosphide; C F, precipitates or fine, nonmetallic inclusions. 1300 (micro- eutectic. The cell boundaries, filled with steadite, cementite ferrite inside the precipitate of phosphorous scopic magnification 1000 ) eutectic. 1300 (microscopic magnification 1000 ) Fig. 29 As-cast gray iron (Fe-3.62%C-2.03%Si- Fig. 27 Same as in Fig. 26 but after overetching with 1.13%P-0.61%Mn-0.137%S-0.113%Cr- Fig. 30 Same as in Fig. 29 but after etching with hot hot Murakami’s reagent. IP, iron phosphide; C, 0.478%Ni-0.004%Al). E, binary phosphorous eutectic; F, alkaline sodium picrate and 4% nital. Pearlitic cementite; and F, ferrite. 1300 (microscopic magnifica- ferrite at the graphite precipitate; and P, pearlite. Etched matrix is revealed; phosphorous eutectic is unaffected. tion 1000 ) with 4% nital. 500 500
  • 9. Metallography and Microstructures of Cast Iron / 573 are white, while their interiors are almost black areas with the ternary eutectic, situated at the phosphide in steadite are not etched, and the net- due to overetching the pearlitic-ferritic matrix. boundaries of the eutectic cells, are almost col- work is clearly visible. Figure 19 shows the same microstructure after orless. In both cases, the cementite and iron Figure 20 shows silicon segregation in an ADI etching with Klemm’s I reagent. The microre- microstructure after etching with Klemm’s I re- gions inside the eutectic cells with a lower phos- agent. The regions outlining the cell boundaries, phorus content are tinted a blue color, while the low in silicon, are tinted a blue color, while the very thin halos around the graphite nodules, where the silicon content is highest, remain col- orless. Acicular ferrite is orange, and austenite is not tinted. Figure 21 shows the same microstruc- ture after etching with Beraha’s CdS reagent (Ta- ble 2, etch No. 6), an aqueous solution of sodium thiosulfate (Na2S2O3•5H2O), citric acid (C6H8O7•H2O), and cadmium chloride (CdCl2•2.5H2O). The silicon segregation is re- vealed the same way as after using Klemm’s I reagent. To reveal silicon segregation in nonalloyed ductile cast iron inside eutectic cells, the hot aqueous solution of sodium hydroxide, picric acid, and potassium pyrosulfite (K2S2O5) can be used (Table 2, etch No. 7). Figure 22 shows the different colors of the microstructure, which change from green through red, yellow, blue, and dark brown to light brown as the silicon content is changing from the graphite nodule to the cell boundaries. The regions with the lowest silicon content at the cell boundaries remain colorless. Before etching, ferritization of the specimen was carried out to enhance the visibility of the mi- crostructural colors. The revealing and differentiation of all con- Fig. 33 Same as in Fig. 32 but after etching with 4% stituents in steadite is invaluable for the deter- picral. AF, acicular ferrite; PM, plate marten- Fig. 31 Same as in Fig. 29 but after etching with hot site. 1000 mination of the type of eutectic as well as the Murakami reagent. Only brown-tinted iron phosphide was revealed. 500 Fig. 32 Austempered ductile iron (Fe-3.6%C-2.5%Si- Fig. 34 Same as in Fig. 32 but after etching with Ber- 0.056%P-0.052%Mg-0.7%Cu). Martensite aha-Martensite reagent. PM, blue-yellow plate Fig. 35 Same as in Fig. 32 but after etching with 10% and acicular ferrite. The casting was austempered at 900 martensite; FM, brown fine martensite; and AF A, dark sodium metabisulfite. PM, plate martensite; C (1650 F), held 2 h, taken to salt bath at 360 C (680 F), needles of acicular ferrite surrounded with colorless aus- FM, fine martensite; and AF A, acicular ferrite and aus- held 2 min, and air cooled. Etched with 4% nital. 1000 tenite. 1000 tenite. 1000
  • 10. 574 / Metallography and Microstructures of Ferrous Alloys amount of each constituent. In the case of the stituents, nor does it provide enough information ing in 4% nital. The white areas that surround ternary phosphorous eutectic, which consists of about distribution of the eutectic constituents. the ternary eutectic and are also visible inside ferrite, cementite, and iron phosphide (Fe3P), ni- Figure 23 shows the microstructure of the ter- the eutectic can be either ferrite or cementite. tal does not help in the identification of the con- nary phosphorous eutectic in gray iron after etch- Figure 24 shows the microstructure of the same specimen after selective color etching with hot ASP (Table 2, etchant No. 4). Cementite in the eutectic is tinted brown and blue colors (also in pearlite), while ferrite and iron phosphide are not tinted. To reveal the ferrite, the same specimen was etched with Klemm’s I reagent. Figure 25 shows the eutectic regions with precipitates of brown ferrite (also in pearlite), while cementite and iron phosphide are not tinted. Murakami’s reagent (Table 2, etch No. 8), used at 50 C (120 F) for 3 min and containing potassium hydroxide (KOH), potassium ferri- cyanide (K3Fe(CN)6), and distilled water, can be used for revealing and estimating the amount of iron phosphide in steadite. Figure 26 shows this constituent of the ternary phosphorous eutectic microstructure, which was tinted a light-brown color, while cementite and ferrite remained col- orless. The microstructure of the same specimen after overetching (5 min) with the same reagent is shown in Fig. 27. This time, cementite was also revealed and was tinted a yellow color, while ferrite remained white. The color of the iron phosphide changed to a dark-brown and gray-blue color. Nevertheless, extending the etching time beyond 3 min is not recommended, because this can falsify the true results of the Fig. 36 Austempered ductile iron (Fe-3.6%C-2.5%Si- microstructural examination. 0.052%Mg-0.7%Cu). AF, acicular ferrite; A, austenite; and M, martensite. The casting was austempered Good differentiation of all constituents in the at 900 C (1650 F), held 2 h, taken to salt bath at 360 C Fig. 38 Same as in Fig. 36 but after etching with 10% ternary phosphorus eutectic can be obtained with sodium metabisulfite. AF, acicular ferrite; A, (680 F), held 30 min, and air cooled. Etched with 4% nital. austenite; and M, martensite. 1000 Beraha’s reagent (Table 2, etch No. 9), a mixture 1000 of hydrochloric acid (HCl), selenic acid Fig. 39 White alloyed cast iron (Fe-3.4%C-0.92%Mn- 1.89%Si-9.52%Cr-6.27%Ni). Etched with Ber- aha-Martensite. PM, plate martensite; FM, fine martensite; EC, eutectic carbides type M7C3; SC, secondary carbides; and MS, manganese sulfite. The casting was heat treated: Fig. 40 Same white iron as in Fig. 39 but after etching Fig. 37 Same as in Fig. 36 but after etching with Ber- austenitized at 750 C (1380 F), held 2 h, and air cooled; with 4% nital. M, martensite; EC, eutectic car- aha-Martensite reagent. AF, acicular ferrite; A, tempered at 250 C (480 F), held 4 h, and air cooled. bides; and SC, secondary carbides. 1300 (microscopic austenite; and M, martensite. 1000 1300 (microscopic magnification 1000 ) magnification 1000 )
  • 11. Metallography and Microstructures of Cast Iron / 575 (H2SeO4), and ethanol. According to Beraha, ture of the ternary eutectic, with cementite tinted Figure 29 shows the microstructure of the this etchant tints iron phosphide a dark-blue a light-pink color, while the rest of the constit- pseudobinary phosphorous eutectic, which con- color, cementite a violet or dark red, and ferrite uents were colored properly. sists of iron phosphide and ferrite, after etching remains white. Figure 28 shows the microstruc- with 4% nital. The same specimen was etched with hot ASP (Table 2, etchant No. 4). This did not tint the iron phosphide or the ferrite. Because cementite is not present in the eutectic, the only etching was of cementite in the pearlite, which showed up very lightly. To reveal the microstruc- ture of the eutectic, the specimen was next etched with 4% nital. Figure 30 shows the results after using hot ASP and then nital. Hot Murak- ami’s reagent perfectly tinted the iron phosphide in the binary phosphorous eutectic a brown color, while pearlite was colorless, as shown in Fig. 31. Beraha-Martensite (B-M) (Table 2, etch No. 10) and aqueous 10% sodium metabisulfite (SMB) (Table 2, etch No. 11) reagents for selec- tive color etching are very useful in cases where microstructural details are very fine and barely visible after etching with nital. They reveal all of the constituents, tinting them to expected col- ors that are useful for verifying that the heat treatment process was carried out correctly. The B-M etchant is a mixture of stock solution (1:5, HCl to water), potassium metabisulfite (K2S2O5), and ammonium acid fluoride (NH4F•HF). According to Ref 6, B-M tints mar- tensite a blue color and bainite a brown color, while the residual austenite and carbides remain unaffected. Fig. 43 As-cast high-chromium white iron (Fe- The B-M etchant can be used for identification Fig. 41 Same white iron as in Fig. 39 and 40 but as- 4.52%C-0.4%Si-2.86%Mn-35.0%Cr-0.06%P- of the constituents after heat treatment of cast cast. Eutectic carbides in austenitic matrix. 0.012%S). PC, primary carbides; EC, eutectic carbides, Etched with glyceregia. 500 both M7C3 type. Etched with glyceregia. 500 iron by tinting phases to different colors. It also Fig. 42 Same as in Fig. 41 but after etching with Lich- Fig. 44 Same as in Fig. 43 but after etching with Mu- Fig. 45 Same as in Fig. 43 but as-polished and exam- tenegger and Bloech I. Austenite is dark brown, rakami’s reagent (at room temperature). PC, or- ined in differential interference contrast. Pri- and dendritic segregation is visible around unaffected car- ange primary carbides; EC, orange and gray eutectic car- mary and eutectic carbides are sticking up from the softer bides. 1000 bides. 400 austenitic matrix. 400
  • 12. 576 / Metallography and Microstructures of Ferrous Alloys improves microstructural contrast, enhancing crostructure of ADI after etching with 4% nital, show the microstructure of the same specimen visibility and permitting estimation of even while Fig. 33 shows the same microstructure af- after color etching, respectively, with B-M and small amounts of the residual austenite (although ter etching with 4% picral. Figures 34 and 35 with aqueous 10% SMB etchants. The SMB tints x-ray diffraction results are always more than martensite a brown color and bainite a blue color, 10% greater than by light microscopy) and fine while austenite and carbides are colorless. Both carbides. Figure 32 shows the black-white mi- etching time in B-M and the different crystallo- graphic orientations affected the color of the coarse, high-carbon martensitic plates, which vary from blue to yellow. The brown areas in the microstructure (Fig. 34) are the patches of fine martensite. This color differentiation of micro- structure occurs due to the change in size of the plate martensite as transformation progresses. However, this is not the only factor, because some of the larger plates are also brown. There is only a very small amount of austenite, which surrounds the acicular ferrite at the graphite nod- ules and in the matrix. The SMB etchant is even more useful than the B-M etchant in the case where the dominating phase in the ADI micro- structure is martensite, and acicular ferrite is weakly visible. In ADI, the martensite of both types is tinted a brown color, the acicular ferrite is colored the same as bainite, that is, blue color, while austenite is colorless, which was shown in Fig. 35 (see the section “Ductile Iron” in this article). Figure 36 shows the microstructure of ADI after etching with 4% nital, while Fig. 37 and 38 Fig. 48 Same as Fig. 46 but examined in differential show the same microstructure after etching with interference contrast. EC, eutectic carbides; B-M and 10% SMB, respectively. Nital etched SC, secondary carbides; and M, martensite. 1000 the acicular ferrite, while the austenite is white. Some areas that were darkened may be marten- site, but there is no clear distinction between Fig. 46 Same white iron as in Fig. 39 but after slight martensite and acicular ferrite with nital. Selec- etching with 4% nital and examined in bright- field illumination. EC, eutectic carbides type M7C3; SC, secondary carbides; and M, martensite. 1000 Fig. 49 Same white iron as in Fig. 14 and 15 but cast- ing was heat treated at 1000 C (1830 F), held 1 h, furnace cooled to 400 C (750 F) for 2 h, taken to salt bath at 400 C (750 F), held 4 h, and air cooled. Examined Fig. 47 Same as in Fig. 46 but examined in dark-field in bright-field illumination. EC, eutectic carbides type Fig. 50 Same as in Fig. 49 but examined in dark-field illumination. EC, eutectic carbides; SC, sec- M7C3; SC, secondary carbides. Etched with glyceregia. illumination. EC, eutectic carbides; SC, sec- ondary carbides; and M, martensite. 1000 1000 ondary carbides. 1000
  • 13. Metallography and Microstructures of Cast Iron / 577 tive color etching with the two previously men- B-M than with SMB), and austenite remained alloyed cast iron after heat treatment. The mi- tioned reagents clearly revealed small patches of colorless. crostructure, which is shown in Fig. 39, consists martensite, which were blue after etching with The same results were achieved with the use of brown patches of fine martensite (which may B-M and brown after etching with 10% SMB; of B-M reagent to reveal the microstructure of have transformed from austenite during or after acicular ferrite was colored blue (darker with tempering), while the blue needles are high-car- bon plate martensite. Figure 40 shows the mi- crostructure of the same specimen after etching with 4% nital; in this case, the recognition of martensite is not straightforward. Figures 41 and 42 show the microstructure of the same iron but in the as-cast condition after etching with glyceregia and with Lichtenegger and Bloech I (LBI), respectively (Table 2, etch- ant No. 3 and 12). The LBI is an aqueous solu- tion of ammonium bifluoride (NH4F•HF) and potassium metabisulfite (K2S2O5) (Table 2, etch No. 12). In chromium-nickel alloys, LB I tints austenite, while carbides and ferrite (if present) remain unaffected (white). Glyceregia outlines only the eutectic carbides, while the LB I etchant also reveals microsegregation. The microstruc- ture shown in Fig. 42 consists of austenite, tinted brown and blue color, and white (noncolored) carbides. The blue austenitic areas surrounding Fig. 53 Flake graphite in as-cast gray iron examined in crossed polarized light. As-polished. 200 Fig. 51 Graphite nodule examined in bright-field illu- mination. As-polished. 1000 Fig. 55 Flake graphite in as-cast gray iron examined with SEM. Sample was deeply etched with 50% HCl. 500 Fig. 54 Same as in Fig. 33 but microstructure was ex- amined in crossed polarized light. Acicular fer- Fig. 56 Nodular graphite in as-cast ductile iron exam- Fig. 52 Same as in Fig. 51, but graphite nodule was rite is shining brightly; plate martensite is slightly gray-blue. ined with SEM. Sample was deeply etched with examined in crossed polarized light. 1000 1000 50% HCl. 1000