Traffic Graphics
•
0 gefällt mir•327 views

This document discusses how visual graphics can help communicate complex transportation infrastructure issues and projects more simply. It provides examples of how graphics were used to illustrate levels of service analyses, construction staging processes, and site assessments in a clear way for community members and decision makers. Contact information is included for Michael Fishman of Traffic Graphics to discuss these types of visualizations.

Empfohlen
Empfohlen
Weitere ähnliche Inhalte
Andere mochten auch
Ähnlich wie Traffic Graphics
Ähnlich wie Traffic Graphics (20)
Traffic Graphics
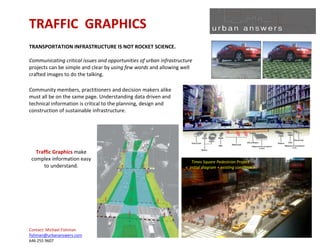
- 1. TRAFFIC GRAPHICS TRANSPORTATION INFRASTRUCTURE IS NOT ROCKET SCIENCE. Communicating critical issues and opportunities of urban infrastructure projects can be simple and clear by using few words and allowing well crafted images to do the talking. Community members, practitioners and decision makers alike must all be on the same page. Understanding data driven and technical information is critical to the planning, design and construction of sustainable infrastructure. Traffic Graphics make complex information easy Times Square Pedestrian Project to understand. < initial diagram + existing condition > Contact: Michael Fishman fishman@urbananswers.com 646 255 9607
- 2. TRAFFIC GRAPHICS LEVELS OF SERVICE ‘A – B – C it’s easy as 1 – 2 – 3 . . .’ Columbia University Master Plan DATA COLLECTION & ANALYSIS < LOS Analysis + Implemented Improvements v Data Collection Strategy > LOS Analysis: before and after proposed platform improvements Stadium Pedestrian Density: Macro & Micro Scale Contact: Michael Fishman fishman@urbananswers.com 646 255 9607
- 3. TRAFFIC GRAPHICS SITE ASSESSMENT NYSDOT Route 9A Plan (World Trade Center Site) Traffic, Tunnel and Landscape assessment clearly identified in Red, Blue and Green > SCALE Reintroducing issues and opportunities at a variety of scales makes concepts clear for all concerned. Service vehicles to pedestrians, property owners to City planners. Multiple Scales: Macro – Micro World Trade Center Master Plan Site Assessment > Whole Foods Site Assessment The Memorial The Site The Region Columbia University Master Plan LOS Analysis + Implemented Improvements The Region The Site Highway Access Local Access Contact: Michael Fishman fishman@urbananswers.com 646 255 9607
- 4. TRAFFIC GRAPHICS CONSTRUCTION STAGING PROCESSES No more ‘Pardon Our Appearance’ under construction. Construction staging is a design exercise for facilities that need to maintain operations during reconstruction. Public infrastructure projects can be easily accessible while under construction and improve levels of service upon ground breaking – not simply at ribbon cutting with clear communications for contractors and the public. Consolidated Edison Roadwork and Facility Improvements: Multi-Lingual flyers and posters NYC Utility Companies Field Manual: Diagrams communicated work being done in communities and for permitting agencies. standards for street construction zones. SIGNAGE AND WAY FINDING Integrated design of each phase for the best passenger throughput can include all types of media, from TV to internet and printed graphics, to inform the public. Newark Airport Vision42 Construction Reconstruction User Staging Strategy: Friendly Maps: On-line outlines stages of and in print maps were construction for cost available to employees estimates and to and passengers to communicate issues to navigate the area during local business and reconstruction. residents. > Contact: Michael Fishman fishman@urbananswers.com 646 255 9607
- 5. TRAFFIC GRAPHICS ANALYZING THE VISION For the World Trade Center Innovative Design Competition, over 250 diagrams were produced to communicate transportation infrastructure issues and opportunities associated with the entries to decision-makers and the public. Far right: pedestrian only space in blue was hard to understand until diagrammed. Below: grade changes that would have been impossible for pedestrians to navigate and service access created dangerous conditions below grade for one entry. Communicating the benefits of the elevated rail in Far Rockaway for flood defense, evacuation and mixed use development to politicians, community members and business leaders. Contact: Michael Fishman fishman@urbananswers.com 646 255 9607
- 6. TRAFFIC GRAPHICS COMMUNICATING THE VISION Connecting the Greenways: Battery Park Perimeter > Pier 76 Infrastructure Consolidation World Financial Center Streetscape Strategy V Chelsea Pier Access Plan Brooklyn Navy Yard Site Plan Contact: Michael Fishman fishman@urbananswers.com 646 255 9607