Compare uses of electronic media among urban nature-based tourists
•
1 gefällt mir•396 views

A look at how tourists use e-travel in the Twin Cities Metropolitan Area, the difference in use between nature and non-nature based tourists, and resulting implications and opportunities for the tourism and recreation industry

Empfohlen
Weitere ähnliche Inhalte
Andere mochten auch
Andere mochten auch (12)
Ähnlich wie Compare uses of electronic media among urban nature-based tourists
Ähnlich wie Compare uses of electronic media among urban nature-based tourists (20)
Mehr von University of Minnesota Tourism Center
Mehr von University of Minnesota Tourism Center (20)
Kürzlich hochgeladen
Kürzlich hochgeladen (20)
Compare uses of electronic media among urban nature-based tourists
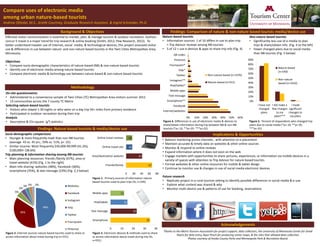
- 1. Compare uses of electronic media among urban nature‐based tourists Andrew Oftedal, M.S., Arielle Courtney, Graduate Research Assistant, & Ingrid Schneider, Ph.D. Effective visitor communication is essential to market, plan, & manage tourism & outdoor recreation. Authors concur E‐travel is a major trend for trip research & online booking (Smith, 2012; Pew Research, 2012). To better understand traveler use of internet, social media, & technological devices, this project assessed visitor use & differences in use between nature‐ and non‐nature based tourists in the Twin Cities Metropolitan Area, Minnesota. Objectives • Compare socio‐demographic characteristics of nature‐based (NB) & non‐nature based tourists • Identify use of electronic media among nature‐based tourists • Compare electronic media & technology use between nature‐based & non‐nature based tourists On‐site questionnaires • Administered to a convenience sample of Twin Cities (TC) Metropolitan Area visitors summer 2012 • 13 communities across the 7 county TC Metro Selecting nature‐based tourists • Visitors who stayed 1‐30 nights or who were on a day trip 50+ miles from primary residence • Participated in outdoor recreation during their trip Analysis • Descriptive & Chi‐square (χ²) statistics Findings: Comparison of nature & non‐nature based tourists media/device use Socio‐demographic comparisons • Younger & more frequently male than non‐NB tourists (average 43 vs. 45 yrs.; 59% vs. 51%, p< .01) • Similar income: Most frequently $50,000‐99,999 (41.2%), $100,000+ (38.6%) Trip planning & information sharing among NB‐tourists • Main planning resources: friends /family (67%), area or travel website (41%) (Fig. 1 to the right) • Main info sharing: websites (48%), Facebook (36%), smartphone (35%), & text message (23%) (Fig. 2,3 below) Background & Objectives Methodology Implications & Opportunities Thanks to the Metro Tourism Association for project support, data collectors, the University of Minnesota Center for Small Towns for data entry, Ryan Pesch for producing visitor maps, & the sites that allowed data collection. Photos courtesy of Anoka County Parks and Minneapolis Park & Recreation Board. • Balance marketing across channels , with attention to e‐placement • Maintain accurate & timely data on websites & other online sources • Monitor & respond to online reviews • Expand information where it does not exist on the web • Engage markets with opportunities to share pictures, experiences, or information via mobile devices in a variety of spaces with attention to Trip Advisor for nature‐based tourists • Format websites & other online resources for mobile & tablet design • Continue to monitor use & changes in use of social media electronic devices Future research • Replicate project in a rural tourism setting to identify possible differences in social media & e‐use • Explore what content was shared & why • Monitor multi‐device use & patterns of use for booking, reservations Acknowledgements Findings: Nature‐based tourists & media/device use 48% 36% 5% 4% 3% 2% 2% Websites Facebook Instagram Yelp Twitter Foursquare Pinterest 35 23 15 12 0 10 20 30 40 Smartphone Text message iPad/tablet Mobile apps Figure 2. Internet sources nature‐based tourists used to share or access information about travel during trip (n=551) Figure 3. Electronic devices & methods used to share or access information about travel during trip (%; n=551) 67 41 16 16 0 20 40 60 80 Friends/family Area/destination website Online travel site Online travel reviews Figure 1. Primary sources of information nature‐ based tourists used to plan trips (%; n=545) Figure 4. Differences in use of electronic media & devices to share/obtain information during trip between NB & non‐NB tourists (*p<.10, **p<.05, ***p<.01) Figure 5. Percent of respondents who changed trip plans due to social media (*p<.10, **p<.05, ***p<.01) Nature‐based tourists • Information sources: 1 of 10 differs in use to plan trip: > Trip Advisor reviews among NB tourists • 5 of 12 > use e‐devices & apps to share trip info (Fig. 4) 0% 10% 20% 30% 40% 50% 60% Internet/websites Facebook Smartphone** Text message Mobile apps iPad/tablet* Instagram** Twitter Yelp* Foursquare* Pinterest QR codes Non‐nature based (n=1476) Nature‐based (n=551) Non‐nature based tourists • Significantly less use of e‐media to plan trips & share/obtain info (Fig. 4 to the left) • Fewer changed plans due to social media than NB tourists (Fig. 5 below) 0% 10% 20% 30% 40% 50% 60% 70% 80% 90% I have not changed plans I did make a few changes to my plans*** I made significant changes to my plans Nature‐based (n=540) Non‐nature based (n=1432)