Beginners Guide to TikTok for Search - Rachel Pearson - We are Tilt __ Bright...
Global insights audio-slides-07-25-11
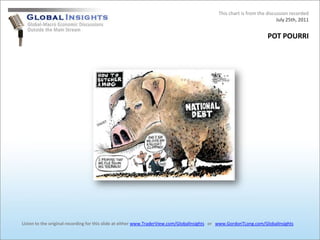
1. This chart is from the discussion recordedJuly 25th, 2011 POT POURRI Listen to the original recording for this slide at either www.TraderView.com/GlobalInsights or www.GordonTLong.com/GlobalInsights
2. This chart is from the discussion recordedJuly 25th, 2011 BEFORE WE START: A Reminder to Keep Your Eye on The YEN Listen to the original recording for this slide at either www.TraderView.com/GlobalInsights or www.GordonTLong.com/GlobalInsights
3. This chart is from the discussion recordedJuly 25th, 2011 BEFORE WE START: A Reminder to Keep Your Eye on The YEN Listen to the original recording for this slide at either www.TraderView.com/GlobalInsights or www.GordonTLong.com/GlobalInsights
4. This chart is from the discussion recordedJuly 25th, 2011 BEFORE WE START: A Reminder to Keep Your Eye on The LIBOR-OIS Listen to the original recording for this slide at either www.TraderView.com/GlobalInsights or www.GordonTLong.com/GlobalInsights
5. This chart is from the discussion recordedJuly 25th, 2011 BEFORE WE START: A Reminder to Keep Your Eye on The INTEREST RATE SWAPS Listen to the original recording for this slide at either www.TraderView.com/GlobalInsights or www.GordonTLong.com/GlobalInsights
6. This chart is from the discussion recordedJuly 25th, 2011 Q2 EARNINGS GUIDANCE - US Listen to the original recording for this slide at either www.TraderView.com/GlobalInsights or www.GordonTLong.com/GlobalInsights
7. This chart is from the discussion recordedJuly 25th, 2011 Q2 EARNING SURPRIZES - EU Listen to the original recording for this slide at either www.TraderView.com/GlobalInsights or www.GordonTLong.com/GlobalInsights
8. This chart is from the discussion recordedJuly 25th, 2011 POT POURRI Listen to the original recording for this slide at either www.TraderView.com/GlobalInsights or www.GordonTLong.com/GlobalInsights
9. This chart is from the discussion recordedJuly 25th, 2011 POT POURRI Listen to the original recording for this slide at either www.TraderView.com/GlobalInsights or www.GordonTLong.com/GlobalInsights
10. This chart is from the discussion recordedJuly 25th, 2011 POT POURRI Listen to the original recording for this slide at either www.TraderView.com/GlobalInsights or www.GordonTLong.com/GlobalInsights
11. This chart is from the discussion recordedJuly 25th, 2011 BEFORE WE FINISH: Beware of BONDS or BOMBS! Listen to the original recording for this slide at either www.TraderView.com/GlobalInsights or www.GordonTLong.com/GlobalInsights
12. This chart is from the discussion recordedJuly 25th, 2011 BEFORE WE FINISH: Beware of BONDS or BOMBS! Listen to the original recording for this slide at either www.TraderView.com/GlobalInsights or www.GordonTLong.com/GlobalInsights
13. This chart is from the discussion recordedJuly 25th, 2011 BEFORE WE FINISH: Beware of BONDS or BOMBS! Listen to the original recording for this slide at either www.TraderView.com/GlobalInsights or www.GordonTLong.com/GlobalInsights
14. This chart is from the discussion recordedJuly 25th, 2011 POT POURRI Listen to the original recording for this slide at either www.TraderView.com/GlobalInsights or www.GordonTLong.com/GlobalInsights
Hinweis der Redaktion
07-25-11: Monday - Pot Pourri OPENING > Good Morning, its Monday July 25th in Boston, I'm Gord Long with GordonTLong.com and have Ty Andros, the President of Traderview and author of the 'no spin' Tedbits Newsletter with me today from Chicago. I hope you had a well deserved weekend with the family? Monday is Pot Pourri where we open it up to random items we have on our mind. As we often do, we have put together some slides to guide our discussions this morning. The slides are located directly below the audio bar. If our listeners could open up the slides to full screen viewing it will allow you to more easily follow along. To kick it off I would like to talk about the YEN Carry Trade unwind then the results so far of the Q2 Earnings seasons which we haven't had time to discuss.
YEN at 78.07 to the US Dollar is now stronger than when the G7 intervened in March to cap the rise and protect the YEN Carry Trade from imploding.There is a possibility that the G-7 Accord to sell down the Japanese Yen via purchase of UST Bonds may have been the stealth initiation of a GLOBAL QE. With European sovereign debt in ruin, the contagion to Italy and soon Greece, the declaration of junk status for Portugal and Ireland in addition to the toxic paper blowing from Mt Olympus, the new dawn of Global Financial Crisis part II is hitting and help force the EU Summit into action last Thursday.We are learning that mass deployment of the electronic money printing machine has indeed a wicked cost, hardly free, in the form of a rising global cost structure and powerful profit squeeze. The result is an economy in permanent recession.
A longer view of the YEN Index is more helpfulTHE JAPANESE YEN BREAKOUTAt the end of QE2, the game is on again. The 125 resistance level on the YEN Index has been shattered on the third attempt since March Intervention. This time, another Global QE will be needed to stop the Yen from rising more.INSURANCE FIRMS: The reconstruction is underway. Insurance firms are cashing in to raise funds urgently needed. INVESTORS: The recent action in the Japanese flagship Nikkei stock index below 10,000 has sparked a torrent of UST Bond sales for rescue funds outside the Japanese walls. A weak stock market has conspired with reconstruction costs due. Foreign asset sales finally hit critical mass. FINANCIAL FIRMS: The financial firms are recognizing yet another important liquidation phase in the Yen Carry Trade. Those who delay in liquidation will face huge losses. This is an important unrecognized short cover squeeze on the Yen currency. It is the hidden signal.
The red circle matches the red circle on our first chart.JAPAN: Domestic disruption to the vast industrial and car supply sector is combining with a slower US Economic demand to bring the trade deficit into view.The after effects in Japan are working in numerous hidden ways to lift the Yen currency. Its steady stubborn rise will confuse economists. The next phase inside Japan will include an unspoken emphasis of foreign asset sales in order to fund the staggering costs and to avert price inflation. Additional debt with Yen markings risks a surge in domestic price inflation. In the next year, the Japanese trade balance will turn into an outright deficit. The trade deficit will not keep down the Yen exchange rate down. The deficit will send into reverse the process of suppressing the Yen currency for 20 to 30 years. No longer will the Japanese financial institutions, led by the BOJ, purchase the UST Bonds. The critical point was reached when the March emergency G-7 Meeting was convened. Its purpose was coordination to buy UST Bonds and keep the Yen down, effectively Global QE. The Yen Sale Pact was never called Global QE but that is the proper interpretation, since all major central banks became UST Bond buyers of last resort. The Gold & Silver market properly interpreted the event, and surged to breakout levels. The effect of the G-7 desperate clumsy pact was temporary. The trade deficit will not keep down the Yen exchange rate. Contrary to standard economic theory, the Japanese trade gap will push up the Yen currency. The Japanese Yen currency will continue to rise even though a trade deficit comes. Their trade surplus used to enable vast funds to suppress the Yen, now gone. The Japanese will sell foreign assets to cover the deficits. They will have to avoid price inflation by selling available foreign assets, in particular the plentiful US$-based assets. Banks will lead the final phase of the Yen Carry Trade unwinding process. Insurance companies will unload US$-based assets in order to finance claims. The financial firms will unload US$-based assets so as to protect Japanese stock values. Look for rising price inflation on imports to the US Economy. Add Japan to China as the source of rising prices to US retail shelves on finished electronic products.
Do not forget the $620 TRILLION SWAPS market. This is where the modern day BOND VIGILANTE call home.I haven’t yet mentioned something very important.Emerging and developing nations accumulated foreign reserves in high volume during the first quarter. Capital flows from the older economies has been huge. The data is shocking. Richer older nations added only $65.5 billion in reserves, of those $1.6 billion in US$ terms. Emerging markets however added $366.3 billion in reserves, of those $65.8 billion in US$ terms. The Japanese Yen was a primary beneficiary of emerging market diversification. Their central banks accumulated $6.6 billion in new JPY reserves in the first quarter, lifting the allocation to 2.9%.The Canadian and Australian Dollars were other beneficiaries, whose share climbed to 5.8% from 5.1% in 4Q2010. Emerging markets spot the European crisis unfolding in full glory. They have moved out a little from the Euro currency, where its share fell to 28.2%. But globally the Euro share rose to 26.6%, up a tiny amount. Nomura analysts reason that central banks reacted to the Euro strength as an opportunity to move into the Yen and other currencies. One can infer that the Yen is seen as a mature currency (yet it yields nothing on bonds), and the two other Dollars are resource currencies with strong national commodity supply.
LET’S TALK FUNDAMENTALSThe percentage of companies that have beaten earnings and revenue estimates this earnings season has been pretty strong. CHARTshowsthe difference between the percentage of companies raising guidance and lowering guidance by quarter going back to 2002. HOWEVER, Guidance on the other hand, has been awful. Of the 345 companies that have reported, 5.8% have raised guidance, while 6.1% have lowered guidance. If earnings season were to end today, the reading of -0.3 would be the first negative reading seen since the first quarter of 2009.BACKGROUNDER:Guidance Numbers Not Looking So Great
Europe, which has had a very lousy week economically (as confirmed by both PMIs and German Ifo survey), is on track to experience its worst earnings season in a decade! Of the 49 companies that have reported so far, 36.7% have beaten and a massive 53.1% have missed. This is well below historical averages of 55.4% and 37.7% respectively. 10.2% of companies have so far reported in-line numbers. Approx 300 will report quarterly results in totalSurprisingly is that the sectors which have outperformed in the US are precisely those that are doing the worst in Europe, specifically discretionary, industrials and staples By sector, earnings beats are led by Technology (75.0%), Financials (71.4%) and Utilities (50.0%). Earnings misses are led by Discretionary (80.0%), Industrials (71.4%) and Staples (66.7%).Notable beats & misses On the stock front we've seen notable beats from Nokia Corp., Marine Harvest, Telenor, StoreBrand and Carnival. Notable misses were Renewable Energy, Philips, Fortum, Castellum and Konecranes .Notable EPS upgrades & downgrades We've also seen notable upgrades of Suedzucker, Tele2, Getinge, StoreBrand and Orkla. Notable downgrades were Husqvarna, Electrolux, Kuehne & Nagel, Outokumpu and Sandvik.Backgrounder: Worst Start To The European Earnings Season In A Decade Zero Hedge
WSJ 50 odd contributing Economists
the US Dollar is losing its reserve status. In a very gradual process of erosion, central banks rely upon stable allocations but they clearly are depending less and less on the greenback.
the US Dollar is losing its reserve status. In a very gradual process of erosion, central banks rely upon stable allocations but they clearly are depending less and less on the greenback.