SlideShare ist ein Scribd-Unternehmen logo
1 von 25
1. The Labour Market
 The labour market is a factor market – it provides a means by which employers find the labour
they need, whilst millions of individuals offer their labour services in different jobs.
 The supply of and demand for labour is affected by what is happening in local, national and
international markets and economies.
Labour Demand – Marginal Revenue Product
 How many people should a business look to employ?
 Theories of the demand for labour try to analyse links between the demand for labour and a
variety of economic factors. We start with the marginal revenue productivity theory of the
demand for labour.
Marginal Revenue Product (MRPL) measures the change in total revenue for a firm from selling the
output produced by additional workers.
MRPL = Marginal Physical Product x Price of Output per unit
o Marginal physical product is the change in output resulting from adding an extra worker.
o The price of output is determined in the product market – in other words, the price that a
business can get in the market for the goods and services that they have produced.
A numerical example of marginal revenue product is shown in the next table:
Labour
people
employed
Capital (K)
Units of
capital
Total
Output (Q)
units
Marginal
Product
Units
Price per
unit of
output when
sold (£)
Marginal revenue
product = MPP x P
(£)
0 5 0 / 5 /
1 5 30 30 5 150
2 5 70 40 5 200
3 5 120 50 5 250
4 5 180 60 5 300
5 5 270 90 5 450
6 5 330 60 5 300
7 5 370 40 5 200
8 5 400 30 5 150
9 5 420 20 5 100
10 5 430 10 5 50
 We are assuming in this example that the firm is operating in a perfectly competitive market
such that the demand curve for finished output is perfectly elastic at £5 per unit.
 Marginal revenue product follows directly the behaviour of marginal physical product. Initially
as more workers are added to a fixed amount of capital, the marginal product is assumed to
rise.
 However beyond the 5
th
worker employed, extra units of labour lead to diminishing returns.
As marginal physical product falls, so too does marginal revenue product. For example the 5
th
worker taken on adds $450 to total revenue whereas the 9th
worker employed generates just
£100 of extra income.
The story is different if the firm is operating in an imperfectly competitive market where the demand
curve is downward sloping. In the next numerical example we see that as output increases, the firm
may have to accept a lower price per unit for the product it is selling. This has an impact on the
marginal revenue product of employing extra units of labour. One again though, a combination of
diminishing returns to extra labour and a falling price per unit causes marginal revenue product
(eventually) to decline. In our example below, it starts to fall once the 7th
worker is employed.
Labour Capital (K) Output (Q) MPP Price (£) MRP = MPP x P (£)
0 5 0 10.0
1 5 25 25 9.60 240
2 5 60 35 9.00 315
3 5 100 40 8.70 348
4 5 150 50 8.20 410
5 5 210 60 7.90 474
6 5 280 70 7.70 539
7 5 360 80 7.00 560
8 5 430 70 6.80 476
9 5 450 20 6.50 130
10 5 460 10 6.00 60
MRP theory suggests that wage differentials result in part from variations in the level of labour
productivity and also the value of the output that the labour input produces.
The main assumptions of the marginal revenue productivity theory of the demand for labour are:
o Workers are homogeneous in terms of their ability and productivity (clearly unrealistic!)
o Firms have no buying power when demanding workers (they have no monopsony power.)
o Trade unions have no impact on the labour supply (the possible impact on unions on wage
determination is considered in later chapters.)
o The physical productivity of each worker can be accurately and objectively measured and
the market value of the output produced by the labour force can also be calculated.
o The industry supply of labour is assumed to be perfectly elastic. Workers are
occupationally and geographically mobile and can be hired at a constant wage rate. This
means that the marginal cost of taking on extra workers is assumed to be constant.
The profit maximising level of employment
Now we consider how many people a business might decide to employ. The profit maximising level of
employment occurs when a firm hires workers up to the point where the marginal cost of employing
an extra worker equals the marginal revenue product of labour. I.e. MCL = MRPL.
This is shown in the labour demand diagram shown below.
o
Limitations of MRPL theory of labour
demand
1. Measuring productivity: Often it is
hard to measure productivity because
no physical output is produced or the
output may not be sold at a market
price. This makes it tough to place a
true valuation on the output of each
extra worker. How does one go about
valuing the final output of people
employed in teaching, social care or
the armed forces? It is easier to
measure output in industries where a
tangible product is produced each day.
2. Pay Award Bodies: In some jobs
wages and salaries are set
independently of the state of labour
demand and supply. Over five million
public sector workers for example fire-fighters, pharmacists, council workers, nurses and
teachers have their pay set according to decisions of independent pay review bodies with
“market forces” having only an indirect role in setting pay-rates.
3. Self employment and Directors’ Pay: There are over three million people classified as self-
employed in Britain. How many of these people set their wages according to the marginal
revenue product of what they produce? And what of those people who have the ability to set
their own pay rates as directors or owners of companies? Recently we have had fierce
debates about the huge level of bonus payments paid to city workers many of whom were
behind the risk-taking that contributed towards the credit crunch. Was their pay justified on the
grounds of marginal revenue product? How does one go about measuring the marginal
revenue product of people working in complex financial markets?
Wage
Rate
Employment of Labour (E)
Marginal Revenue Product (MRPL)
Marginal Cost of
Employing Labour
W1
E1E2
W2
E3
W3
A rise in the wage rate causes a contraction
of labour demand as the marginal cost of
employing extra workers rises
The profit-maximising
level of employment is
where the marginal
revenue product of labour
= the marginal cost of
employing labour
Shifts in the Demand for Labour
The number of people employed at each wage level can change and in the diagram below we see an
outward shift of the labour demand curve. The curve shifts when there is a change in the conditions of
demand in the jobs market. For example:
 A change in demand for a product which means that a business needs to take on fewer
workers
 A change in the productivity of labour
 A change in the level of national insurance contributions made by employers or other costs
of employing people such as health and safety legislation and training levies
 A change in cost and productivity of machinery and technology which might be able to
produce or provide a good or service in place of the labour input.
Labour as a Derived Demand
 The demand for labour is a derived demand i.e. the
demand depends on the demand for the products they
produce.
 When the economy is expanding, we expect to see a rise in
the aggregate demand for labour providing that the rise
in output is greater than the increase in labour productivity.
 In contrast, during a recession or a slowdown, the
aggregate demand for labour will decline as businesses
look to cut their operations costs and scale back on
production.
In a recession, business failures, plant shut downs and short-term
redundancies lead to a reduction in the derived demand for labour. The construction industry is an
example of the derived demand for labour. The decade long property boom in the UK has led to
Wage
Rate
Employment of Labour (E)
Labour Demand (1)
W1
E1
Labour Demand (2)
E2
rising prices, output and employment but since 2008 the property market has been in recession
leading to many thousands of job losses.
Case Study: Pay Cuts in a Recession
The recession is having a huge effect on the UK labour market. Unemployment is rising at a very fast
rate; the number of unfilled vacancies has dropped. And the total number of people in a job either full
time or part time is now on the slide. How best should business respond to the recession in terms of
the pay and conditions they offer to their employees.
Pay cuts and pay freezes are being flagged up as an increasingly common option by businesses
struggling to survive. Staffs working for the publisher Penguin who earn over £30,000 have had their
salaries frozen. Premiership rugby clubs in Britain have agreed to freeze their salary cap at £4m. And
a new survey from the British Chambers of Commerce covering 300 member firms found that 43%
plan to freeze wages and salaries in the coming year. Nearly one business in ten will go a step further
and attempt to cut basic pay and salaries – a measure almost unprecedented in the experience of
today’s workers.”
There are many broader economic effects of a situation in which wage packets and salaries are either
held constant or cut.
 Pension incomes:
o A series of pay cuts this year and next may affect the value of pensions of people who
are on final salary schemes. This will be fiercely resisted by trade unions - especially
those representing workers in the state sector
 Productivity and efficiency:
o Will reductions in pay lead to lower productivity? Pay cuts of 10 per cent or a freeze on
wages (which amounts to a cut in real pay) could have a negative effect on worker
morale.
 Equity
o Will pay cuts be across the board from executive level through to shop floor workers?
 Impact on consumer demand:
o Will a squeeze on real take-home incomes lead to an even deeper cut in consumer
spending - aggravating the extent of the recession in the domestic economy? Many
businesses will be using a mixture of layoffs, reduced hours, less overtime and wage
freezes - all of which have a negative effect on average earnings
An inward shift of labour demand ought to bring about a reduction in the real value of wages and
salaries in a competitive labour market. But wage freezes or cuts are not yet common across most
industries. Some employers are trying more imaginative ways to reduce their payroll expenses. Some
have offered their workers longer holidays or sabbaticals on a fraction on their annual pay. Others
have slashed the amount of overtime available. Many employers recognise that - having strained hard
to recruit their best workers - it would be foolish and counter-productive to get rid of them in a
recession, whose duration few are confident in predicting.
Elasticity of Demand for Labour
Elasticity of labour demand measures the responsiveness of demand for labour when there is a
change in the wage rate. The elasticity of demand for labour depends on:
1. Labour costs as a % of total costs: When labour expenses are a high proportion of total
costs, then labour demand tends to be elastic. In many service jobs such as call-centres,
labour costs are a high proportion of the total costs of a business.
2. The ease and cost of factor substitution: Labour demand will be more elastic when a firm
can substitute quickly and easily between labour and capital inputs. When specialised labour
or capital is needed, then the demand for labour will be more inelastic. For example it might
be fairly easy and cheap to replace security guards with cameras but a hotel would find it
almost impossible to replace hotel cleaning staff with machinery!
3. The price elasticity of demand for the final output produced by a business: If a firm is
operating in a competitive market where final demand for the product is price elastic, they
may have little market power to pass on higher wage costs to consumers.
Labour Supply
 The labour supply refers to the total number of hours that labour is willing and able to
supply at a given wage rate.
 It is the number of workers willing and able to work in a particular job or industry for a given
wage.
 The labour supply curve for an industry or occupation will be upward sloping.
 This is because, as wages rise, other workers enter this industry attracted by the incentive of
higher rewards. They may have moved from other occupations or they may not have
previously held a job, such as housewives or the unemployed.
 The extent to which a rise in the prevailing wage or salary in an occupation leads to an
expansion in the supply of labour depends on the elasticity of labour supply.
Wage
Rate
Employment of Labour (E)
Labour Demand (1)
W1
W2
E2E1
Labour Demand (2)
E3
Labour demand (2) is more elastic – perhaps because the employer
can easily switch to capital inputs as a means of producing an output if
wage rates were to increase
Labour demand (1) is relatively inelastic – e.g. -0.4 i.e. a 10% fall in the
wage rate might only lead to a 4% expansion of labour demand
Key factors affecting labour supply
The supply of labour to a particular occupation is influenced by:
1. The real wage rate on offer in the industry itself – higher wages should boost the number
of people willing and able to work.
2. Overtime: Opportunities to boost earnings come through overtime, productivity-related pay
schemes, and share option schemes.
3. Substitute occupations: The real wage rate on offer in competing jobs is another factor
because this affects the wage and earnings differential that exists between two or more
occupations. So for example an increase in the relative earnings available to trained plumbers
and electricians may cause some people to switch their jobs.
4. Barriers to entry: Artificial limits through the introduction of minimum entry requirements or
other legal barriers to entry can restrict labour supply and force average pay levels higher e.g.
legal services and medicine where there are strict “entry criteria” to the professions.
5. Improvements in the occupational mobility of labour: For example if more people are
trained with the necessary skills required to work in a particular occupation.
6. Non-monetary characteristics of specific jobs – include factors such as the level of risk,
the requirement to work anti-social hours, job security, opportunities for promotion and the
chance to live and work overseas, employer-provided in-work training, subsidised health and
leisure facilities and occupational pension schemes.
7. Net migration of labour – the UK is a member of the EU single market that enshrines free
movement of labour as a guiding principle. A rising flow of people seeking work in the UK is
making labour migration an important factor in determining the supply of labour available to
many industries – be it to relieve shortages of skilled labour in the NHS or education, or to
meet the seasonal demand for workers in agriculture and the construction industry. The
recession has caused inward migration to slow down and in some cases to reverse.
Wage
Rate
Employment
Labour Supply
W1
D1
E1
W2
D2
E3
W3
Wage
Rate
EmploymentE1 E2
LS1
E2
W1
LS2
Elasticity of labour supply
 The elasticity of labour supply to an occupation measures the extent to which labour supply
responds to a change in the wage rate in a given time period.
 In lower-skilled occupations, labour supply is elastic because a pool of labour is employable
at a fairly constant market wage rate.
 Where jobs require specific skills and training, the
labour supply will be more inelastic because it is hard
to expand the workforce in a short period of time when
demand for workers has increased.
Equilibrium wages and wage differentials
 There is a wide gulf in pay and earnings rates between
different occupations in the UK labour market. Even in
local labour markets there will be variations in pay
levels – for example, in London bus drivers working for different companies can see
differences in pay of up to £6,000 a year?
 In 2010, chief executives of FTSE-100 companies were paid on average 145 times the
average salary. Back in 1999 the multiple was 69. On current trends it will be 214 by 2020, or
around £8m a year.
Wage
Rate
Employment
Labour Supply
(short run)
W1
D1
E1
W2
D2
Labour
Supply
(long run)
E3
a
b
W3
c
Wage
Rate
Employment
D1
D2
E1 E2
Inelastic and elastic labour supply curves A perfectly elastic labour supply curve
Labour
Supply
Public sector employees in the UK
account for less than 1% of the top
1% of the income distribution scale
Report of the High Pay Commission
 In the 30 years to 1979, the share of income going to the top 0.1 per cent of earners dropped
from 3.5 per cent to 1.3 per cent. Today, the top 0.1 per cent takes home as big a share as it
did in the 1940s.
Wage Differentials
No one factor explains the gulf in pay that persists between
occupations:
1. Compensating wage differentials - higher pay can
often be reward for risk-taking in certain jobs,
working in poor conditions and having to work
unsocial hours.
2. Equalising difference and human capital - in a
competitive labour market, wage differentials
compensate workers for the opportunity costs and
direct costs of human capital acquisition.
3. Different skill levels - the gap between poorly
skilled and highly skilled workers gets wider each
year. Market demand for skilled labour grows more
quickly than for semi-skilled workers. This pushes up
pay levels. Highly skilled workers are often in
inelastic supply and rising demand forces up the
"going wage rate" in an industry.
Real
Wage
Rate
Employment
W1
Real
Wage
Rate
Employment
D2
D1
E2 E1
The equilibrium price of labour (market wage rate) in a given market is determined by the interaction
of the supply and demand for labour. Employees are hired up to the point where the extra cost of
hiring an employee (their wage) is equal to the addition to sales revenue from hiring them, their MRP.
Labour
Supply
D1
E1
Labour
Supply
W1
W2
D3
W3
E3
Graduates and NEETS
One person in four in the workforce
has a degree, a share that has
doubled in the past 18 years.
Despite the increased supply of
graduates, they still earn hourly
wages that are 61% higher than
those paid to individuals holding
only A-levels.
In another snapshot of the
population, data shows that the
proportion of 19-to-24-year-olds
who are neither in education,
employment or training (NEETS)
has risen to 19.1% in the summer
of 2011 up from 16.5% in 2010.
4. Differences in labour productivity and revenue creation - workers whose efficiency is
highest and ability to generate revenue for a firm should be rewarded with higher pay. E.g.
sports stars can command top wages because of their potential to generate extra revenue
from ticket sales and merchandising.
5. Trade unions and their collective bargaining power - unions might exercise their
bargaining power to offset the power of an employer in a particular occupation and in doing so
achieve a mark-up on wages compared to those on offer to non-union members
6. Employer discrimination is a factor that cannot be ignored despite equal pay legislation
Sticky wages in the labour market
 Economists often refer to the existence of “sticky wages.” In a fully flexible labour market, a
decrease in the demand for labour should cause a fall in wages and a contraction in
employment - just like any demand curve shifting down.
 However, sticky wages refers to a situation in which the real wage level doesn't fall
immediately, partly because many employees have wages specified in employment
contracts that cannot be re-negotiated immediately, and because workers (perhaps
protected by their trade unions) are resistant to cuts in nominal wages.
 If the wage level cannot fall when demand falls, it leads to a much bigger drop in employment
and, more importantly, involuntary unemployment because of a failure of the labour market
to clear.
 The evidence for sticky wages is a good counter-argument to neo-classical models of the
labour market that suggest that real wage levels respond flexibly to any changes in labour
demand and supply conditions.
 Will wages become less sticky during the recession? There are signs that workers, fearful for
their jobs at such a difficult time, have become more willing to consider and perhaps accept
pay freezes or wage cuts traded off against improved job security.
Real
Wage
Rate
Employment
W1
Real
Wage
Rate
Employment
Ld
E1
Ls
W2
E2
Ls
Ld
Government policies and the labour supply
The main policies designed to increase the supply of labour available to the economy are as follows:
1. Reforms to the system of direct taxation: In the 1980s, Thatcherite economics focused on
cutting income tax rates particularly at the top end and switching from direct towards indirect
taxation. More recently, governments have tended to focus more on reductions in the lower
rates of income tax and tax allowances for lower-paid workers. The theoretical idea remains
broadly the same, that lower direct taxes increase the post-tax reward to working and act as
an incentive for more people to join the labour supply. In 2007 the government announced
that the 10% starting rate of income tax would be withdrawn in 2008 and that the basic rate of
tax would be cut from 22% to 20%. From 2010 the government plans to have a top rate of
income tax of 50% for the highest income earners.
2. Reforms to the benefits system: The emphasis here has changed away from the rather
crude idea of cutting the real and relative value of welfare benefits towards encourage people
into searching for work, towards a reliance on tax credits (for example the Working Families
Tax Credit) to give parents with children a greater financial incentives to work. The aim is to
reduce the disincentive problems created by the unemployment and poverty trap.
3. Increased investment in education and training: This is designed to boost the human
capital of the labour force and improve the occupational mobility of the labour force to meet
the changing demands of employers across different industries.
4. A more relaxed approach to labour immigration: Particularly where there are shortages of
workers with skills such as consultants and fully trained nurses in the NHS, or shortages of
teachers in certain subjects. The effect of net inward migration on the labour supply is shown
in the diagram below.
Real
Wage
Rate
Employment
Labour Supply
W2
E1
W1
Labour
Demand
d
Labour
Supply
with
migration
E2
Strong inflows of labour into the economy can
have the effect of increasing the labour supply
This puts downward pressure on real wages
(for a given level of labour demand) e.g.
through helping to relieve labour shortages in
particular industries and occupations
If migration provides a boost to the labour
supply and to labour productivity, there is the
prospect of an outward shift in a country’s long
run aggregate supply
The Work-Leisure Trade Off
 Will people work longer hours if they are offered higher pay?
 Standard economic theory would suggest that the real wage is a key determinant of the
number of hours. The real wage is the money wage rate adjusted for changes in the price
level and it measures the quantity of goods and services that can be bought from each hour
worked.
 An increase in the real wage on offer in a job should lead to someone supplying more hours
over a given period of time
 There is the possibility that further increases in the wage rate might have little effect on an
individual’s labour supply. Indeed, there is the possibility of a backward-bending individual
labour supply curve. This is illustrated in the next diagram.
Two distinct individual labour supply curves are shown.
1. In the first curve, higher real wages lead to an increase in the number of extra hours supplied,
although the rate at which the individual gives up their leisure time and work longer hours
diminishes as the real wage rises.
2. In the second curve, for most of the range of real wages, the same prediction holds true, but
when as real wages step upwards, eventually an individual may choose to actually work fewer
hours (ceteris paribus) giving us what is sometimes termed a “backward bending” labour
supply curve.
Income and substitution effects
To understand why this might happen we consider the income and substitution effects that arise from
a change in the real wage being paid to an individual worker. We start with the income effect.
o The income effect: Higher real wages increase the income that someone can earn from a
job, but they also mean that the hours of work needed to earn enough to pay for a product
declines. Higher pay levels mean that a target real wage can be achieved with fewer hours of
labour supply. So this income effect might persuade people to work less hours and enjoy
extended leisure time.
Real
Wage
Rate
Hours of Work
Supplied (LS)
Individual Labour
Supply (1)
Individual Labour
Supply (2)
L1 L3 L2
o The substitution effect: The substitution effect of a higher wage rate should unambiguously
give people an incentive to work extra hours because the financial rewards of working are
raised, and the opportunity cost of not working (measured by the wages given up when
people opt for leisure instead) has increased.
o With the income and substitution effects working in opposite directions, there is no hard and
fast prediction about whether people will choose to increase their labour supply as real wages
increase.
o Are the income and substitution effects different for male compared to female workers?
o What about younger workers entering the labour market for the first time who are looking to
save to finance a deposit on a house or to fund other major items of spending?
o How might people closer to retirement age respond to changes in real wages?
o What of workers in households where at least someone else is in paid employment compared
to a household where there is only one main “breadwinner”?
The importance of incentives
 Most of us rely on income from our work to pay for the things we need and higher pay and
better conditions should be an incentive perhaps to work some extra hours or search for work
in the first place.
 But for many workers there are disincentives to supply their labour – and these problems
often affect people in lowly paid jobs.
 This is known as the problem of the poverty trap and there is an example in the case study
below.
Case Study: The Poverty Trap worsens in Scotland
The soaring cost of childcare is worsening the poverty trap according to a new report commissioned
for the save the Children Fund in Scotland. More than one quarter of Scots parents on low incomes
cannot work full time because of the cost of registered childcare that has risen by more than 10 per
cent this year across most of the country.
Joanne Brady, a single mother of two children from Glasgow, is unable to work because she loses
more in means-tested child tax credits than she gains in income. “They take 20 per cent off for each
child when you go to work. You still have to pay your housing, travel and lunches and it's just not
adequate.” Ms Brady, 27, is among the 28 per cent of parents with children under 18 and an income
of less than £15,000.
Source: News reports, July 2008
2. Monopsony in the Labour Market
o With increasing frequency these days we read in the media of stories of people – often in low
paid jobs – who claim that they are being underpaid for the job that they do. T
o There are many possible reasons for this and one of them is the effect of an employer using
their monopsony power. This is the focus of this chapter.
Monopsony
o A monopsony producer has buying power in the labour market when seeking to employ
extra workers and may use that buying-power to drive down wage rates.
o The monopsonist knows that they face an upward sloping labour supply curve, in other words,
to attract more workers in their industry, they must pay a higher wage rate – so the average
cost of employing labour rises with the number of people taken on.
o Because the average cost of labour is increasing, the marginal cost of extra workers will
be even higher, since we assume that an increase in the wage rate paid to attract one extra
worker must also be paid to existing workers.
o The profit maximising level of employment is where the marginal cost of labour equates
with the marginal revenue product of employing extra workers.
o In the diagram, Eq workers are taken on, but the monopsonist can employ these workers at
an average wage rate of Wq – a pay level below the marginal revenue product of the last
worker.
o In this sense, the monopsonist is exploiting labour by not paying them the full value of their
marginal revenue product.
Wage
Rate
(W)
Employment of Labour (E)
Demand = MRPL
Labour
Supply
(ACL)
Wq
Eq
Marginal Cost of
Labour (MCL)
MRPL
A monopsony is a market dominated by a single buyer. A monopsonist has the market power
to set the price of whatever it is buying (from raw materials to labour inputs)
o Trade unions may seek to counter-balance the monopsony power of an employer by
controlling aspects of the labour supply and by using
whatever collective bargaining power they possess to
negotiate wages higher without being at the expense
of employment levels.
Examples of monopsony employers
o Major employers in a small town (e.g. a car plant, a
major supermarket or the head office of a bank)
o Nursing homes as employers of care assistants.
o The government can also have monopsony power as
the major employer in the teaching profession or the
National Health Service
o Local authorities are also big employers for example
in refuse collection, street-cleaning and in running
council nursing homes and local libraries
o Agencies who employ thousands of people in the
hotel, catering and cleaning industries
o The farming sector which employs huge numbers of
people on temporary terms during the peak harvesting
season
Government intervention in labour markets to combat the effects of worker exploitation
An employer having monopsony power in the labour market
does not necessarily mean that workers will find their wages
and other terms and conditions worse than if the market for
labour was more competitive.
That said there often are an economic and a clear social
justification for legal interventions in the jobs market to provide
support and backing for thousands of vulnerable and often
poorly-paid people.
Two examples of such intervention are
1. Legal protections such as the Gangmasters Authority
2. The national minimum wage (NMW) and also a
campaign for a living wage. The London living wage
was introduced in 2005 and more than 100 London-
based employers have signed up to it.
Gangmasters Licensing Authority (GLA)
The Gangmasters Licensing Authority was set up in 2006 to
combat exploitation of workers in agriculture, horticulture and
food processing plants, by overseeing the people who supply
much of the labour.
In 2008 it set up operation Ajaz – an investigation into pay and
working conditions in a cluster of industries where workers are
thought to be most vulnerable to exploitation – it targeted
employers in the agriculture, horticulture, forestry, shell fishing
and food processing industries.
Young workers look for better pay
and conditions
The prospect of better pay has
overtaken job satisfaction as the key
reason for moving to another job, a
survey suggests. But employment
prospects in the UK labour market
remain poor with the recovery at a
fragile stage.
It's well known that under-25s are
struggling to find work. The latest
official figures show that 935,000 are
unemployed in the UK. Research by
the Institute for Employment Studies
suggests those under 30 have seen
their real pay fall £890 a year since
the credit crunch first hit in 2008
Adapted from news reports
South Africa wine grown by
'abused' workers
Workers helping to make South
Africa's wines are subject to unsafe
working conditions and inadequate
housing, a report has said. Human
Right Watch says workers on wine
and fruit farms face exposure to
pesticides and are blocked from
forming trade unions.These
workers are some of the worst paid
in the country - despite strict labour
laws.
Fashion chain Zara acts on
Brazil sweatshop conditions
Spanish fashion chain Zara say
they are strengthening the
oversight of their production system
after workers were found toiling in a
Brazilian sweatshop. A raid in Sao
Paulo found mostly Bolivian
immigrants working for a pittance in
unsafe conditions. A raid in Sao
Paulo found people working in
cramped, unsanitary conditions, for
long hours.
The National Minimum Wage (NMW)
The National Minimum Wage (NMW) is a minimum amount per hour that most workers in the UK are
entitled to be paid. The NMW rates are reviewed each year by the Low Pay Commission and from 1
October 2011 the main hourly rate for workers aged 21 is £6.08 (£4.98 for workers aged 18-20, with
lower rates for workers aged 16-17 (£3.68) and for apprentices under 19 years old £2.60).
How might a minimum wage impact on employment and the wage decisions of a monopsony
business?
o Because the minimum wage is a pay floor, the monopsonist cannot pay a wage below it
o So the NMW effectively becomes the marginal and average cost curve for hiring workers up
to employment level Emin.
o Thereafter to hire additional staff, the wage rate must be bid up, again creating a divergence
between the average and marginal cost of labour.
o The effect on the diagram is that with an appropriately set rate, the profit maximising level of
employment after a minimum wage is higher (E2) and the wage rate paid to labour has also
increased (W2).
o In this example, making certain assumptions, a minimum wage might actually boost total
employment and secure better pay for workers in occupations and industries where there is
some monopsonistic power among the buyers of labour.
Wage
Rate
(W)
Demand =
MRPL
Labour
Supply
(ACL)
Wq
Eq
MRPL
National
Minimum Wage
Marginal
Cost with
NMW
NMW
E2 Employment of Labour (E)
3. Discrimination in the Labour Market
What is discrimination?
o Nobel-prize winning economist Kenneth Arrow has defined discrimination as “the valuation
in the market place of personal characteristics of the worker that are unrelated to worker
productivity”.
o These personal characteristics may be sex, race, height, appearance, age, national origin or
sexual preference – or indeed any other identifiable characteristic.
o Discrimination is a cause of labour market failure and a source of inequity in the
distribution of income and wealth and it is usually subject to intervention e.g. through
regulation and legislation.
o Discriminatory treatment of minority groups leads to lower wages and poor employment
opportunities, including less training, job insecurity and fewer promotions. The result is that
groups exposed to discrimination earn less than they would and suffer a fall in relative living
standards.
Why does discrimination occur in the labour market?
1. The 'Taste' Model (Gary Becker) - Discrimination arises here because employers and
workers have a ‘distaste’ for working with people from different ethnic backgrounds or final
customers dislike buying goods from sales people from different races i.e. people prefer to
associate with others from their own group. They are willing to pay a price to avoid contact
with other groups. With reference to race, this is equivalent to racial prejudice.
2. Employer ignorance – Discrimination arises because employers are unable to observe
directly the productive ability of individuals and therefore characteristics such as gender or
race may be used as ‘proxies’ – the employer through ignorance or prejudice assumes that
certain groups of workers are less productive than others and is less willing to employ them,
or pay them a wage or salary that fairly reflects their productivity, experience and applicability
for a particular job.
3. Occupational crowding effects – Females and minorities may be crowded into a cluster of
lower paying occupations.
Younger workers are often among the most vulnerable in the labour market. Since the 2008-09 recession
employment among workers aged 18-24 has contracted by nearly 400,000 and the unemployment rate among
this group has jumped from 12% to over 18%. Little wonder that politicians are under great pressure to invest
extra funds in improving job prospects for this segment of the labour force
Discrimination against female workers - the “gender pay gap” in the UK
There is little doubt that a permanent gap exists between average pay rates for females and males in
the UK labour market. Evidence of the gender pay gap comes from the New Earnings Survey.
The gender gap, measured by full-time median hourly pay rates excluding overtime, shrank from 12.2
per cent to a record low of 10.2 per cent in the year to April 2010, according to an annual survey of
hours and earnings by the Office for National Statistics. Men’s median hourly earnings were £13.01,
while for women the rate was £11.68. The median is the level at which half of workers fall above and
half below.
In 1997 the gender pay gap in median earnings for full-timers was around 17 per cent and now it’s
dropped to around 10 per cent. The median gender gap for all employees, including part-timers, in
2010 fell from 22 per cent to 19.8 per cent. The gender gap was widest in south-east England and
narrowest in Northern Ireland.
What factors explain the gender pay gap in the UK?
1. Human capital: i.e. there are differences in educational levels and work experience between
males and females. Breaks from paid work, including time to raise a family, can impact on
women's level of work experience.
2. Part-time working: a significant proportion of women work part-time and part-time work
typically pays less well than full-time jobs. Fewer hours worked inevitably has an effect on the
weekly gross earnings of female workers compared to men.
3. Travel patterns: on average, women spend less time commuting than men with the result
that they will have a smaller pool of jobs to choose from. It may also result in lots of women
wanting work in the same location near to where they live which will result in lower equilibrium
wages for those jobs.
4. Occupational segregation: 60 per cent of women work in just 10 occupations. Occupations
which are female-dominated are often relatively poorly paid jobs (e.g. Caring, Cashiering,
Catering, Cleaning and Clerical jobs) and there is continued under-representation in higher
paid jobs within occupations – the so-called "glass ceiling" effect.
5. Employer discrimination: Work by the LSE calculates that up to 42% of the gender pay gap
is attributable to direct discrimination against women. Since 1995 the number of equal pay
cases registered with employment tribunals has more than doubled.
6. The effects of monopsony power: Females may be relatively geographically immobile
(because they are tied to their husbands' place of employment) and may be paid less than a
competitive wage by a monopsonist employer.
Government Intervention to reduce the gender gap
o The Equal Pay Act introduced in 1970 sought to provide legal protection for female workers
and encouraged employers to bring the pay for males and females into line.
o The Sex Discrimination Act of 1975 outlawed unequal opportunities for employment and
promotion in the workplace because of gender and it set up the Equal Opportunities
Commission.
o Attention has switched in recent years away from legislation towards encouraging more
women to stay on in further and higher education providing and targeted assistance for single
parents to find work and thereby increase the labour market participation ratio among female
workers.
Theory of labour market discrimination
We can model the effects of discrimination using a simple labour demand and supply framework
It is difficult to be precise about the effects of discrimination in the labour market. Employers rarely
have full information about the productivity of all of their workers, let alone prejudiced or ignorant
views about the relative merits and de-merits of different groups. Increasingly employers’
organisations along with trade unions are working hard to break down barriers to the employment of
different minority groups and in highlighting instances of discriminatory behaviour.
The issue of labour market discrimination will remain with us for many years. It is closely linked to the
issue of labour migration and in particular, the risks of discrimination of the many thousands of
workers from Eastern Europe who have come into the UK either on a temporary or permanent basis
now that twelve countries have joined the European Union.
Ee Em
Wm
We
EeEd
Wd
We
Employment of White malesEmployment of Non-White Females
Wage
Supply
MRPL
MRPL Dis
Supply
MRPL
MRPL Wm
If employers are prejudiced about the relative productivity of different groups of workers, this will be
reflected in their estimates of the marginal revenue productivity of each group. The MRPL of
discriminated groups is lower than for other groups.
This is reflected in lower relative wages and a lower level of employment
Wage
4. Trade Unions in the Labour Market
Trade unions are organisations of workers that seek through collective bargaining with employers
to protect and improve the real incomes of their members, provide job security, protect workers
against unfair dismissal and offer a range of other work-related services including support for people
claiming compensation for injuries sustained in a job.
o Association of Flight Attendants (AFA)
o Association of Teachers and Lecturers (ATL)
o Bakers, Food and Allied Workers Union (BFAWU)
o Communication Workers Union (CWU)
o Fire Brigades Union (FBU)
o National Union of Journalists (NUJ)
o Prison Officers Association (POA)
o Professional Footballers Association (PFA)
o Transport and General Workers' Union (T&G)
Main roles of unions
o Improve the real incomes of their members
o Lobby for better working conditions and pensions
o Provide job security
o Protect their workers against unfair dismissal
o Provide a counter-balance to the monopsony power of some employers
o Support people claiming compensation for injuries sustained in a job
o Protect workers against possible employment-related discrimination
Union Membership Trends
1. There has been a long term decline in union membership. In 2008, only 28 per cent of people
in a job in the UK were members of a trade union
a. Only one in six private sector employees in the UK were union members in 2006
b. Almost three in five public sector employees in the UK were union members
c. Around one third of workers say that their pay and conditions are influenced by trade
union collective bargaining
d. The hourly earnings of union members averaged £13.07 in 2008, 12.5 per cent more
than the earnings of non-members
e. Nearly 60 per cent of people working in education are members of a trade union but
only 6 per cent of people in hotels and restaurants and only 11 per cent of people
working in wholesale, retail and motor trades
f. Only one worker in five in manufacturing industry is a member of a union
g. Only one worker in ten aged between 16-24 years is a trade union member
2. Union density is highest in the Scandinavian countries of Sweden (70.8 per cent), Finland
(70.3 per cent), and Denmark (69.1 per cent) and lowest in Hungary (16.9 per cent), the
United States (11.6 per cent) and France (7.8 per cent).
3. Unions now have significantly less power and influence to determine pay and conditions than
twenty years ago although in some industries (including postal workers, railway worker, fire
fighters and prison officers) unions are still prepared to exert their “industrial muscle”.
4. Under new legislation, employers must recognise a union in pay and employment discussions
when a majority of the workforce want to be represented and has voted for it. But there is little
evidence that union members secure any significant wage “mark-up” or greater job protection
than people in non-union jobs
5. In current times, employers have less incentive to fear unions (many work in partnership with
businesses) but individuals have less incentive to belong since inflation is low and the
economy is strong
6. The number of active trades unions has declined by
over 40% between 1990 and 2005 – there have been a
number of mergers.
Why has union membership declined?
1. Many people no longer believe that union membership
is worth their while
a. Low inflation means less pressure for higher
pay to protect real incomes
b. Tougher employment laws make it harder for
unions to strike
c. Perception that trade unions have lost some of
their relevance
2. Changes to the nature of the UK labour market
a. Increased number of people working part-time or flexi time
b. Shift towards shorter employment contracts
c. Decline in the number of jobs in heavy industry (de-industrialisation)
3. Some employers have resisted having trade unions in their workplace – or prefer to deal only
with one or two unions on pay and other issues
Trade union power
Trade union membership in Britain
peaked at over 13 million 30 years
ago but now stands at just over 7
million, despite the number of
workers rising over the period. Only
about 15% of private sector
workers are in a union compared to
over half of those in the public
sector
The number of monthly industrial disputes / stoppages in the UK has been at historically low levels for more than
a decade. The 1970s and 1980s were years when strike-action was common in many industries.
Unions have less power and influence in the labour market than they did two decades ago although in
several big industries they can still exert their “industrial muscle”. Power has gradually ebbed away for
a variety of reasons:
1. Employment legislation which has outlawed illegal strikes, given employers the right to seek
compensation for the effects of certain forms of industrial action and requires all unions to
hold secret ballots of their members before any strike action is permitted
2. The effects of increased competition in product markets – in nearly every domestic
market for goods and services, there is greater competition than there was a few years ago.
Be it the intensity of global competition from lower-cost producers or the deregulation of
markets that has increased market contestability, trade unions have had to adjust to a world
where the pricing power of manufacturers and service industries has been severely curtailed.
Hence the increasing demands from businesses to link pay and conditions to worker
productivity. There are still some fairly militant trade unions around – notably in the public
sector services including transport. The train drivers’ union, ASLEF, has been one of the more
militant unions in recent years, conducting strikes on the rail network and London
Underground.
3. Patterns of employment: There has been a long term change in the structure of
employment in the British economy away from traditionally strong union sectors such as
heavy engineering, coal-mining, steel and textiles, towards service sector jobs in the private
sector where union density is much lower
Average weekly earnings are higher in the public sector than in the private sector. That said the chart shows
average wages and there will be huge differences within this figure – for example in the private sector, contrast
the earnings of top premier league footballers with people working as kitchen workers in a London hotel
Unions and wage negotiations – labour market theory
o Unions might seek to exercise their collective bargaining power with employers to achieve
a mark-up on wages compared to those on offer to non-union members.
o For this to happen, a union must have some control over the labour supply available to an
industry.
o In the past this was possible if a union operated a closed shop agreement with an employer
– i.e. where the employer and union agreed that all workers would be a member of a
particular union.
o However in most sectors, the closed shop is now history – outlawed by legislation.
More frequently, a union may simply bid for better pay through bi-lateral face-to-face negotiations
with employers to achieve an increase in wages ahead of the rate of inflation so that real wages rise,
and other improvements to working hours and conditions.
The balance of power between employers and a trade union in their periodic wage negotiations
depends on a range of factors including:
1. Unemployment: when labour is scarce and there are shortages of skilled workers, then the
balance of power tilts towards unions. Unions are always less powerful when the demand for
labour is falling and labour is less scarce.
2. Competitive pressures in product markets – when a firm is enjoying a dominant monopoly
position and high levels of abnormal profit, the unions will know that the employer has the
financial resources to meet a more generous wage settlement
Wage
Rate
Employment
Labour Supply (union
controlled)
E1E2
Labour
Demand
W1
W2
Employment
Labour Supply (union
controlled)
E1E2
Labour
Demand
Labour
Supply to
the
Economy
W1
W3
Elastic labour demand – union control of
labour supply forces wages higher – but
employment contracts
Inelastic labour demand – unions may be
more effective in negotiating higher pay
levels and increasing total factor earnings
The conventional case against trade unions
1. Unions act as a distortion in the workings of the labour market
2. They drive wages higher and profits & employment lower than if the labour market was fully
competitive
3. They may prevent the introduction of new, flexible work practices
4. They may delay the introduction of new technology which thus affects productivity
5. Their collective bargaining power can lead to higher wages and cost-push inflationary
pressures which leads to a worsening of macroeconomic performance
6. Unions can cause labour market failure such as real-wage unemployment
Counter-arguments
1. The new ‘partnership model’ between employers and unions
a. Unions and their members stand to gain from
i. Higher productivity
ii. The workforce having more flexible skills
iii. Improved working conditions and employment rights
2. Higher pay does not automatically lead to fewer jobs
i. Monopsony argument (see previous page)
ii. Higher pay can create incentives for higher productivity and working more
hours
3. Keynesian effects of increased incomes on consumer demand for goods and services – rising
aggregate demand – leading to a boost to short run economic growth
4. Trade unions have modernised to reflect changes in the domestic and global economy
5. Their role is becoming ever more important
a. Threats to the stability and future of occupational pensions
b. Persistent discrimination in the labour market (gender glass ceilings, age, ethnicity)
6. They can work with management and employers to improve efficiency and competitiveness –
and therefore achieve a positive sum game
7. There has been a step change in industrial relations in the UK – which has made the UK
economy a favoured venue for inflows of foreign direct investment – there are far fewer
industrial stoppages and days lost from strike action (see the chart below)

Weitere ähnliche Inhalte

Mehr von tutor2u

UK Economy Update_2019
UK Economy Update_2019UK Economy Update_2019
UK Economy Update_2019tutor2u
 
Supply-Side Policies (2019 Examples Update)
Supply-Side Policies (2019 Examples Update)Supply-Side Policies (2019 Examples Update)
Supply-Side Policies (2019 Examples Update)tutor2u
 
Applied Macro Examples for Economics Exams
Applied Macro Examples for Economics ExamsApplied Macro Examples for Economics Exams
Applied Macro Examples for Economics Examstutor2u
 
Microeconomics - Great Applied Examples for Exams
Microeconomics - Great Applied Examples for ExamsMicroeconomics - Great Applied Examples for Exams
Microeconomics - Great Applied Examples for Examstutor2u
 
Business Objectives and Stakeholders
Business Objectives and StakeholdersBusiness Objectives and Stakeholders
Business Objectives and Stakeholderstutor2u
 
Profit Satisficing
Profit SatisficingProfit Satisficing
Profit Satisficingtutor2u
 
Why Businesses Grow
Why Businesses GrowWhy Businesses Grow
Why Businesses Growtutor2u
 
Sizes and Types of Firms
Sizes and Types of FirmsSizes and Types of Firms
Sizes and Types of Firmstutor2u
 
The UK Productivity Gap
The UK Productivity GapThe UK Productivity Gap
The UK Productivity Gaptutor2u
 
Trade Unions with a Monopsony Employer
Trade Unions with a Monopsony EmployerTrade Unions with a Monopsony Employer
Trade Unions with a Monopsony Employertutor2u
 
Labour Market Failure (2019 Update)
Labour Market Failure (2019 Update)Labour Market Failure (2019 Update)
Labour Market Failure (2019 Update)tutor2u
 
Behavioural Economics Update 2019
Behavioural Economics Update 2019Behavioural Economics Update 2019
Behavioural Economics Update 2019tutor2u
 
Consumer surplus and price changes
Consumer surplus and price changesConsumer surplus and price changes
Consumer surplus and price changestutor2u
 
Markets sub markets
Markets sub marketsMarkets sub markets
Markets sub marketstutor2u
 
Economic Forecasts
Economic ForecastsEconomic Forecasts
Economic Forecaststutor2u
 
UK Economy Update March 2019
UK Economy Update March 2019UK Economy Update March 2019
UK Economy Update March 2019tutor2u
 
Policies to counter monopsony power
Policies to counter monopsony powerPolicies to counter monopsony power
Policies to counter monopsony powertutor2u
 
Human Development Index
Human Development IndexHuman Development Index
Human Development Indextutor2u
 
Why study economics?
Why study economics?Why study economics?
Why study economics?tutor2u
 
The UK Economy in 2018
The UK Economy in 2018The UK Economy in 2018
The UK Economy in 2018tutor2u
 

Mehr von tutor2u (20)

UK Economy Update_2019
UK Economy Update_2019UK Economy Update_2019
UK Economy Update_2019
 
Supply-Side Policies (2019 Examples Update)
Supply-Side Policies (2019 Examples Update)Supply-Side Policies (2019 Examples Update)
Supply-Side Policies (2019 Examples Update)
 
Applied Macro Examples for Economics Exams
Applied Macro Examples for Economics ExamsApplied Macro Examples for Economics Exams
Applied Macro Examples for Economics Exams
 
Microeconomics - Great Applied Examples for Exams
Microeconomics - Great Applied Examples for ExamsMicroeconomics - Great Applied Examples for Exams
Microeconomics - Great Applied Examples for Exams
 
Business Objectives and Stakeholders
Business Objectives and StakeholdersBusiness Objectives and Stakeholders
Business Objectives and Stakeholders
 
Profit Satisficing
Profit SatisficingProfit Satisficing
Profit Satisficing
 
Why Businesses Grow
Why Businesses GrowWhy Businesses Grow
Why Businesses Grow
 
Sizes and Types of Firms
Sizes and Types of FirmsSizes and Types of Firms
Sizes and Types of Firms
 
The UK Productivity Gap
The UK Productivity GapThe UK Productivity Gap
The UK Productivity Gap
 
Trade Unions with a Monopsony Employer
Trade Unions with a Monopsony EmployerTrade Unions with a Monopsony Employer
Trade Unions with a Monopsony Employer
 
Labour Market Failure (2019 Update)
Labour Market Failure (2019 Update)Labour Market Failure (2019 Update)
Labour Market Failure (2019 Update)
 
Behavioural Economics Update 2019
Behavioural Economics Update 2019Behavioural Economics Update 2019
Behavioural Economics Update 2019
 
Consumer surplus and price changes
Consumer surplus and price changesConsumer surplus and price changes
Consumer surplus and price changes
 
Markets sub markets
Markets sub marketsMarkets sub markets
Markets sub markets
 
Economic Forecasts
Economic ForecastsEconomic Forecasts
Economic Forecasts
 
UK Economy Update March 2019
UK Economy Update March 2019UK Economy Update March 2019
UK Economy Update March 2019
 
Policies to counter monopsony power
Policies to counter monopsony powerPolicies to counter monopsony power
Policies to counter monopsony power
 
Human Development Index
Human Development IndexHuman Development Index
Human Development Index
 
Why study economics?
Why study economics?Why study economics?
Why study economics?
 
The UK Economy in 2018
The UK Economy in 2018The UK Economy in 2018
The UK Economy in 2018
 

Kürzlich hochgeladen

Quarter 4- Module 3 Principles of Marketing
Quarter 4- Module 3 Principles of MarketingQuarter 4- Module 3 Principles of Marketing
Quarter 4- Module 3 Principles of MarketingMaristelaRamos12
 
High Class Call Girls Nashik Maya 7001305949 Independent Escort Service Nashik
High Class Call Girls Nashik Maya 7001305949 Independent Escort Service NashikHigh Class Call Girls Nashik Maya 7001305949 Independent Escort Service Nashik
High Class Call Girls Nashik Maya 7001305949 Independent Escort Service NashikCall Girls in Nagpur High Profile
 
VIP Kolkata Call Girl Serampore 👉 8250192130 Available With Room
VIP Kolkata Call Girl Serampore 👉 8250192130  Available With RoomVIP Kolkata Call Girl Serampore 👉 8250192130  Available With Room
VIP Kolkata Call Girl Serampore 👉 8250192130 Available With Roomdivyansh0kumar0
 
Lundin Gold April 2024 Corporate Presentation v4.pdf
Lundin Gold April 2024 Corporate Presentation v4.pdfLundin Gold April 2024 Corporate Presentation v4.pdf
Lundin Gold April 2024 Corporate Presentation v4.pdfAdnet Communications
 
High Class Call Girls Nagpur Grishma Call 7001035870 Meet With Nagpur Escorts
High Class Call Girls Nagpur Grishma Call 7001035870 Meet With Nagpur EscortsHigh Class Call Girls Nagpur Grishma Call 7001035870 Meet With Nagpur Escorts
High Class Call Girls Nagpur Grishma Call 7001035870 Meet With Nagpur Escortsranjana rawat
 
The Economic History of the U.S. Lecture 21.pdf
The Economic History of the U.S. Lecture 21.pdfThe Economic History of the U.S. Lecture 21.pdf
The Economic History of the U.S. Lecture 21.pdfGale Pooley
 
Best VIP Call Girls Noida Sector 18 Call Me: 8448380779
Best VIP Call Girls Noida Sector 18 Call Me: 8448380779Best VIP Call Girls Noida Sector 18 Call Me: 8448380779
Best VIP Call Girls Noida Sector 18 Call Me: 8448380779Delhi Call girls
 
VIP Call Girls LB Nagar ( Hyderabad ) Phone 8250192130 | ₹5k To 25k With Room...
VIP Call Girls LB Nagar ( Hyderabad ) Phone 8250192130 | ₹5k To 25k With Room...VIP Call Girls LB Nagar ( Hyderabad ) Phone 8250192130 | ₹5k To 25k With Room...
VIP Call Girls LB Nagar ( Hyderabad ) Phone 8250192130 | ₹5k To 25k With Room...Suhani Kapoor
 
TEST BANK For Corporate Finance, 13th Edition By Stephen Ross, Randolph Weste...
TEST BANK For Corporate Finance, 13th Edition By Stephen Ross, Randolph Weste...TEST BANK For Corporate Finance, 13th Edition By Stephen Ross, Randolph Weste...
TEST BANK For Corporate Finance, 13th Edition By Stephen Ross, Randolph Weste...ssifa0344
 
Monthly Market Risk Update: April 2024 [SlideShare]
Monthly Market Risk Update: April 2024 [SlideShare]Monthly Market Risk Update: April 2024 [SlideShare]
Monthly Market Risk Update: April 2024 [SlideShare]Commonwealth
 
Booking open Available Pune Call Girls Shivane 6297143586 Call Hot Indian Gi...
Booking open Available Pune Call Girls Shivane  6297143586 Call Hot Indian Gi...Booking open Available Pune Call Girls Shivane  6297143586 Call Hot Indian Gi...
Booking open Available Pune Call Girls Shivane 6297143586 Call Hot Indian Gi...Call Girls in Nagpur High Profile
 
OAT_RI_Ep19 WeighingTheRisks_Apr24_TheYellowMetal.pptx
OAT_RI_Ep19 WeighingTheRisks_Apr24_TheYellowMetal.pptxOAT_RI_Ep19 WeighingTheRisks_Apr24_TheYellowMetal.pptx
OAT_RI_Ep19 WeighingTheRisks_Apr24_TheYellowMetal.pptxhiddenlevers
 
Solution Manual for Financial Accounting, 11th Edition by Robert Libby, Patri...
Solution Manual for Financial Accounting, 11th Edition by Robert Libby, Patri...Solution Manual for Financial Accounting, 11th Edition by Robert Libby, Patri...
Solution Manual for Financial Accounting, 11th Edition by Robert Libby, Patri...ssifa0344
 
02_Fabio Colombo_Accenture_MeetupDora&Cybersecurity.pptx
02_Fabio Colombo_Accenture_MeetupDora&Cybersecurity.pptx02_Fabio Colombo_Accenture_MeetupDora&Cybersecurity.pptx
02_Fabio Colombo_Accenture_MeetupDora&Cybersecurity.pptxFinTech Belgium
 
20240417-Calibre-April-2024-Investor-Presentation.pdf
20240417-Calibre-April-2024-Investor-Presentation.pdf20240417-Calibre-April-2024-Investor-Presentation.pdf
20240417-Calibre-April-2024-Investor-Presentation.pdfAdnet Communications
 
20240429 Calibre April 2024 Investor Presentation.pdf
20240429 Calibre April 2024 Investor Presentation.pdf20240429 Calibre April 2024 Investor Presentation.pdf
20240429 Calibre April 2024 Investor Presentation.pdfAdnet Communications
 
The Economic History of the U.S. Lecture 30.pdf
The Economic History of the U.S. Lecture 30.pdfThe Economic History of the U.S. Lecture 30.pdf
The Economic History of the U.S. Lecture 30.pdfGale Pooley
 
Russian Call Girls In Gtb Nagar (Delhi) 9711199012 💋✔💕😘 Naughty Call Girls Se...
Russian Call Girls In Gtb Nagar (Delhi) 9711199012 💋✔💕😘 Naughty Call Girls Se...Russian Call Girls In Gtb Nagar (Delhi) 9711199012 💋✔💕😘 Naughty Call Girls Se...
Russian Call Girls In Gtb Nagar (Delhi) 9711199012 💋✔💕😘 Naughty Call Girls Se...shivangimorya083
 

Kürzlich hochgeladen (20)

Quarter 4- Module 3 Principles of Marketing
Quarter 4- Module 3 Principles of MarketingQuarter 4- Module 3 Principles of Marketing
Quarter 4- Module 3 Principles of Marketing
 
High Class Call Girls Nashik Maya 7001305949 Independent Escort Service Nashik
High Class Call Girls Nashik Maya 7001305949 Independent Escort Service NashikHigh Class Call Girls Nashik Maya 7001305949 Independent Escort Service Nashik
High Class Call Girls Nashik Maya 7001305949 Independent Escort Service Nashik
 
VIP Kolkata Call Girl Serampore 👉 8250192130 Available With Room
VIP Kolkata Call Girl Serampore 👉 8250192130  Available With RoomVIP Kolkata Call Girl Serampore 👉 8250192130  Available With Room
VIP Kolkata Call Girl Serampore 👉 8250192130 Available With Room
 
Lundin Gold April 2024 Corporate Presentation v4.pdf
Lundin Gold April 2024 Corporate Presentation v4.pdfLundin Gold April 2024 Corporate Presentation v4.pdf
Lundin Gold April 2024 Corporate Presentation v4.pdf
 
High Class Call Girls Nagpur Grishma Call 7001035870 Meet With Nagpur Escorts
High Class Call Girls Nagpur Grishma Call 7001035870 Meet With Nagpur EscortsHigh Class Call Girls Nagpur Grishma Call 7001035870 Meet With Nagpur Escorts
High Class Call Girls Nagpur Grishma Call 7001035870 Meet With Nagpur Escorts
 
The Economic History of the U.S. Lecture 21.pdf
The Economic History of the U.S. Lecture 21.pdfThe Economic History of the U.S. Lecture 21.pdf
The Economic History of the U.S. Lecture 21.pdf
 
Best VIP Call Girls Noida Sector 18 Call Me: 8448380779
Best VIP Call Girls Noida Sector 18 Call Me: 8448380779Best VIP Call Girls Noida Sector 18 Call Me: 8448380779
Best VIP Call Girls Noida Sector 18 Call Me: 8448380779
 
VIP Call Girls LB Nagar ( Hyderabad ) Phone 8250192130 | ₹5k To 25k With Room...
VIP Call Girls LB Nagar ( Hyderabad ) Phone 8250192130 | ₹5k To 25k With Room...VIP Call Girls LB Nagar ( Hyderabad ) Phone 8250192130 | ₹5k To 25k With Room...
VIP Call Girls LB Nagar ( Hyderabad ) Phone 8250192130 | ₹5k To 25k With Room...
 
Veritas Interim Report 1 January–31 March 2024
Veritas Interim Report 1 January–31 March 2024Veritas Interim Report 1 January–31 March 2024
Veritas Interim Report 1 January–31 March 2024
 
TEST BANK For Corporate Finance, 13th Edition By Stephen Ross, Randolph Weste...
TEST BANK For Corporate Finance, 13th Edition By Stephen Ross, Randolph Weste...TEST BANK For Corporate Finance, 13th Edition By Stephen Ross, Randolph Weste...
TEST BANK For Corporate Finance, 13th Edition By Stephen Ross, Randolph Weste...
 
Monthly Market Risk Update: April 2024 [SlideShare]
Monthly Market Risk Update: April 2024 [SlideShare]Monthly Market Risk Update: April 2024 [SlideShare]
Monthly Market Risk Update: April 2024 [SlideShare]
 
Booking open Available Pune Call Girls Shivane 6297143586 Call Hot Indian Gi...
Booking open Available Pune Call Girls Shivane  6297143586 Call Hot Indian Gi...Booking open Available Pune Call Girls Shivane  6297143586 Call Hot Indian Gi...
Booking open Available Pune Call Girls Shivane 6297143586 Call Hot Indian Gi...
 
OAT_RI_Ep19 WeighingTheRisks_Apr24_TheYellowMetal.pptx
OAT_RI_Ep19 WeighingTheRisks_Apr24_TheYellowMetal.pptxOAT_RI_Ep19 WeighingTheRisks_Apr24_TheYellowMetal.pptx
OAT_RI_Ep19 WeighingTheRisks_Apr24_TheYellowMetal.pptx
 
Solution Manual for Financial Accounting, 11th Edition by Robert Libby, Patri...
Solution Manual for Financial Accounting, 11th Edition by Robert Libby, Patri...Solution Manual for Financial Accounting, 11th Edition by Robert Libby, Patri...
Solution Manual for Financial Accounting, 11th Edition by Robert Libby, Patri...
 
02_Fabio Colombo_Accenture_MeetupDora&Cybersecurity.pptx
02_Fabio Colombo_Accenture_MeetupDora&Cybersecurity.pptx02_Fabio Colombo_Accenture_MeetupDora&Cybersecurity.pptx
02_Fabio Colombo_Accenture_MeetupDora&Cybersecurity.pptx
 
20240417-Calibre-April-2024-Investor-Presentation.pdf
20240417-Calibre-April-2024-Investor-Presentation.pdf20240417-Calibre-April-2024-Investor-Presentation.pdf
20240417-Calibre-April-2024-Investor-Presentation.pdf
 
Commercial Bank Economic Capsule - April 2024
Commercial Bank Economic Capsule - April 2024Commercial Bank Economic Capsule - April 2024
Commercial Bank Economic Capsule - April 2024
 
20240429 Calibre April 2024 Investor Presentation.pdf
20240429 Calibre April 2024 Investor Presentation.pdf20240429 Calibre April 2024 Investor Presentation.pdf
20240429 Calibre April 2024 Investor Presentation.pdf
 
The Economic History of the U.S. Lecture 30.pdf
The Economic History of the U.S. Lecture 30.pdfThe Economic History of the U.S. Lecture 30.pdf
The Economic History of the U.S. Lecture 30.pdf
 
Russian Call Girls In Gtb Nagar (Delhi) 9711199012 💋✔💕😘 Naughty Call Girls Se...
Russian Call Girls In Gtb Nagar (Delhi) 9711199012 💋✔💕😘 Naughty Call Girls Se...Russian Call Girls In Gtb Nagar (Delhi) 9711199012 💋✔💕😘 Naughty Call Girls Se...
Russian Call Girls In Gtb Nagar (Delhi) 9711199012 💋✔💕😘 Naughty Call Girls Se...
 

Labour Market Economics
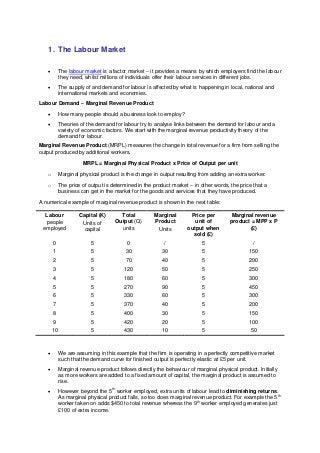
  • 1. 1. The Labour Market  The labour market is a factor market – it provides a means by which employers find the labour they need, whilst millions of individuals offer their labour services in different jobs.  The supply of and demand for labour is affected by what is happening in local, national and international markets and economies. Labour Demand – Marginal Revenue Product  How many people should a business look to employ?  Theories of the demand for labour try to analyse links between the demand for labour and a variety of economic factors. We start with the marginal revenue productivity theory of the demand for labour. Marginal Revenue Product (MRPL) measures the change in total revenue for a firm from selling the output produced by additional workers. MRPL = Marginal Physical Product x Price of Output per unit o Marginal physical product is the change in output resulting from adding an extra worker. o The price of output is determined in the product market – in other words, the price that a business can get in the market for the goods and services that they have produced. A numerical example of marginal revenue product is shown in the next table: Labour people employed Capital (K) Units of capital Total Output (Q) units Marginal Product Units Price per unit of output when sold (£) Marginal revenue product = MPP x P (£) 0 5 0 / 5 / 1 5 30 30 5 150 2 5 70 40 5 200 3 5 120 50 5 250 4 5 180 60 5 300 5 5 270 90 5 450 6 5 330 60 5 300 7 5 370 40 5 200 8 5 400 30 5 150 9 5 420 20 5 100 10 5 430 10 5 50  We are assuming in this example that the firm is operating in a perfectly competitive market such that the demand curve for finished output is perfectly elastic at £5 per unit.  Marginal revenue product follows directly the behaviour of marginal physical product. Initially as more workers are added to a fixed amount of capital, the marginal product is assumed to rise.  However beyond the 5 th worker employed, extra units of labour lead to diminishing returns. As marginal physical product falls, so too does marginal revenue product. For example the 5 th worker taken on adds $450 to total revenue whereas the 9th worker employed generates just £100 of extra income.
  • 2. The story is different if the firm is operating in an imperfectly competitive market where the demand curve is downward sloping. In the next numerical example we see that as output increases, the firm may have to accept a lower price per unit for the product it is selling. This has an impact on the marginal revenue product of employing extra units of labour. One again though, a combination of diminishing returns to extra labour and a falling price per unit causes marginal revenue product (eventually) to decline. In our example below, it starts to fall once the 7th worker is employed. Labour Capital (K) Output (Q) MPP Price (£) MRP = MPP x P (£) 0 5 0 10.0 1 5 25 25 9.60 240 2 5 60 35 9.00 315 3 5 100 40 8.70 348 4 5 150 50 8.20 410 5 5 210 60 7.90 474 6 5 280 70 7.70 539 7 5 360 80 7.00 560 8 5 430 70 6.80 476 9 5 450 20 6.50 130 10 5 460 10 6.00 60 MRP theory suggests that wage differentials result in part from variations in the level of labour productivity and also the value of the output that the labour input produces. The main assumptions of the marginal revenue productivity theory of the demand for labour are: o Workers are homogeneous in terms of their ability and productivity (clearly unrealistic!) o Firms have no buying power when demanding workers (they have no monopsony power.) o Trade unions have no impact on the labour supply (the possible impact on unions on wage determination is considered in later chapters.) o The physical productivity of each worker can be accurately and objectively measured and the market value of the output produced by the labour force can also be calculated. o The industry supply of labour is assumed to be perfectly elastic. Workers are occupationally and geographically mobile and can be hired at a constant wage rate. This means that the marginal cost of taking on extra workers is assumed to be constant. The profit maximising level of employment Now we consider how many people a business might decide to employ. The profit maximising level of employment occurs when a firm hires workers up to the point where the marginal cost of employing an extra worker equals the marginal revenue product of labour. I.e. MCL = MRPL. This is shown in the labour demand diagram shown below.
  • 3. o Limitations of MRPL theory of labour demand 1. Measuring productivity: Often it is hard to measure productivity because no physical output is produced or the output may not be sold at a market price. This makes it tough to place a true valuation on the output of each extra worker. How does one go about valuing the final output of people employed in teaching, social care or the armed forces? It is easier to measure output in industries where a tangible product is produced each day. 2. Pay Award Bodies: In some jobs wages and salaries are set independently of the state of labour demand and supply. Over five million public sector workers for example fire-fighters, pharmacists, council workers, nurses and teachers have their pay set according to decisions of independent pay review bodies with “market forces” having only an indirect role in setting pay-rates. 3. Self employment and Directors’ Pay: There are over three million people classified as self- employed in Britain. How many of these people set their wages according to the marginal revenue product of what they produce? And what of those people who have the ability to set their own pay rates as directors or owners of companies? Recently we have had fierce debates about the huge level of bonus payments paid to city workers many of whom were behind the risk-taking that contributed towards the credit crunch. Was their pay justified on the grounds of marginal revenue product? How does one go about measuring the marginal revenue product of people working in complex financial markets? Wage Rate Employment of Labour (E) Marginal Revenue Product (MRPL) Marginal Cost of Employing Labour W1 E1E2 W2 E3 W3 A rise in the wage rate causes a contraction of labour demand as the marginal cost of employing extra workers rises The profit-maximising level of employment is where the marginal revenue product of labour = the marginal cost of employing labour
  • 4. Shifts in the Demand for Labour The number of people employed at each wage level can change and in the diagram below we see an outward shift of the labour demand curve. The curve shifts when there is a change in the conditions of demand in the jobs market. For example:  A change in demand for a product which means that a business needs to take on fewer workers  A change in the productivity of labour  A change in the level of national insurance contributions made by employers or other costs of employing people such as health and safety legislation and training levies  A change in cost and productivity of machinery and technology which might be able to produce or provide a good or service in place of the labour input. Labour as a Derived Demand  The demand for labour is a derived demand i.e. the demand depends on the demand for the products they produce.  When the economy is expanding, we expect to see a rise in the aggregate demand for labour providing that the rise in output is greater than the increase in labour productivity.  In contrast, during a recession or a slowdown, the aggregate demand for labour will decline as businesses look to cut their operations costs and scale back on production. In a recession, business failures, plant shut downs and short-term redundancies lead to a reduction in the derived demand for labour. The construction industry is an example of the derived demand for labour. The decade long property boom in the UK has led to Wage Rate Employment of Labour (E) Labour Demand (1) W1 E1 Labour Demand (2) E2
  • 5. rising prices, output and employment but since 2008 the property market has been in recession leading to many thousands of job losses. Case Study: Pay Cuts in a Recession The recession is having a huge effect on the UK labour market. Unemployment is rising at a very fast rate; the number of unfilled vacancies has dropped. And the total number of people in a job either full time or part time is now on the slide. How best should business respond to the recession in terms of the pay and conditions they offer to their employees. Pay cuts and pay freezes are being flagged up as an increasingly common option by businesses struggling to survive. Staffs working for the publisher Penguin who earn over £30,000 have had their salaries frozen. Premiership rugby clubs in Britain have agreed to freeze their salary cap at £4m. And a new survey from the British Chambers of Commerce covering 300 member firms found that 43% plan to freeze wages and salaries in the coming year. Nearly one business in ten will go a step further and attempt to cut basic pay and salaries – a measure almost unprecedented in the experience of today’s workers.” There are many broader economic effects of a situation in which wage packets and salaries are either held constant or cut.  Pension incomes: o A series of pay cuts this year and next may affect the value of pensions of people who are on final salary schemes. This will be fiercely resisted by trade unions - especially those representing workers in the state sector  Productivity and efficiency: o Will reductions in pay lead to lower productivity? Pay cuts of 10 per cent or a freeze on wages (which amounts to a cut in real pay) could have a negative effect on worker morale.  Equity o Will pay cuts be across the board from executive level through to shop floor workers?  Impact on consumer demand: o Will a squeeze on real take-home incomes lead to an even deeper cut in consumer spending - aggravating the extent of the recession in the domestic economy? Many businesses will be using a mixture of layoffs, reduced hours, less overtime and wage freezes - all of which have a negative effect on average earnings An inward shift of labour demand ought to bring about a reduction in the real value of wages and salaries in a competitive labour market. But wage freezes or cuts are not yet common across most industries. Some employers are trying more imaginative ways to reduce their payroll expenses. Some have offered their workers longer holidays or sabbaticals on a fraction on their annual pay. Others have slashed the amount of overtime available. Many employers recognise that - having strained hard to recruit their best workers - it would be foolish and counter-productive to get rid of them in a recession, whose duration few are confident in predicting.
  • 6. Elasticity of Demand for Labour Elasticity of labour demand measures the responsiveness of demand for labour when there is a change in the wage rate. The elasticity of demand for labour depends on: 1. Labour costs as a % of total costs: When labour expenses are a high proportion of total costs, then labour demand tends to be elastic. In many service jobs such as call-centres, labour costs are a high proportion of the total costs of a business. 2. The ease and cost of factor substitution: Labour demand will be more elastic when a firm can substitute quickly and easily between labour and capital inputs. When specialised labour or capital is needed, then the demand for labour will be more inelastic. For example it might be fairly easy and cheap to replace security guards with cameras but a hotel would find it almost impossible to replace hotel cleaning staff with machinery! 3. The price elasticity of demand for the final output produced by a business: If a firm is operating in a competitive market where final demand for the product is price elastic, they may have little market power to pass on higher wage costs to consumers. Labour Supply  The labour supply refers to the total number of hours that labour is willing and able to supply at a given wage rate.  It is the number of workers willing and able to work in a particular job or industry for a given wage.  The labour supply curve for an industry or occupation will be upward sloping.  This is because, as wages rise, other workers enter this industry attracted by the incentive of higher rewards. They may have moved from other occupations or they may not have previously held a job, such as housewives or the unemployed.  The extent to which a rise in the prevailing wage or salary in an occupation leads to an expansion in the supply of labour depends on the elasticity of labour supply. Wage Rate Employment of Labour (E) Labour Demand (1) W1 W2 E2E1 Labour Demand (2) E3 Labour demand (2) is more elastic – perhaps because the employer can easily switch to capital inputs as a means of producing an output if wage rates were to increase Labour demand (1) is relatively inelastic – e.g. -0.4 i.e. a 10% fall in the wage rate might only lead to a 4% expansion of labour demand
  • 7. Key factors affecting labour supply The supply of labour to a particular occupation is influenced by: 1. The real wage rate on offer in the industry itself – higher wages should boost the number of people willing and able to work. 2. Overtime: Opportunities to boost earnings come through overtime, productivity-related pay schemes, and share option schemes. 3. Substitute occupations: The real wage rate on offer in competing jobs is another factor because this affects the wage and earnings differential that exists between two or more occupations. So for example an increase in the relative earnings available to trained plumbers and electricians may cause some people to switch their jobs. 4. Barriers to entry: Artificial limits through the introduction of minimum entry requirements or other legal barriers to entry can restrict labour supply and force average pay levels higher e.g. legal services and medicine where there are strict “entry criteria” to the professions. 5. Improvements in the occupational mobility of labour: For example if more people are trained with the necessary skills required to work in a particular occupation. 6. Non-monetary characteristics of specific jobs – include factors such as the level of risk, the requirement to work anti-social hours, job security, opportunities for promotion and the chance to live and work overseas, employer-provided in-work training, subsidised health and leisure facilities and occupational pension schemes. 7. Net migration of labour – the UK is a member of the EU single market that enshrines free movement of labour as a guiding principle. A rising flow of people seeking work in the UK is making labour migration an important factor in determining the supply of labour available to many industries – be it to relieve shortages of skilled labour in the NHS or education, or to meet the seasonal demand for workers in agriculture and the construction industry. The recession has caused inward migration to slow down and in some cases to reverse. Wage Rate Employment Labour Supply W1 D1 E1 W2 D2 E3 W3 Wage Rate EmploymentE1 E2 LS1 E2 W1 LS2
  • 8. Elasticity of labour supply  The elasticity of labour supply to an occupation measures the extent to which labour supply responds to a change in the wage rate in a given time period.  In lower-skilled occupations, labour supply is elastic because a pool of labour is employable at a fairly constant market wage rate.  Where jobs require specific skills and training, the labour supply will be more inelastic because it is hard to expand the workforce in a short period of time when demand for workers has increased. Equilibrium wages and wage differentials  There is a wide gulf in pay and earnings rates between different occupations in the UK labour market. Even in local labour markets there will be variations in pay levels – for example, in London bus drivers working for different companies can see differences in pay of up to £6,000 a year?  In 2010, chief executives of FTSE-100 companies were paid on average 145 times the average salary. Back in 1999 the multiple was 69. On current trends it will be 214 by 2020, or around £8m a year. Wage Rate Employment Labour Supply (short run) W1 D1 E1 W2 D2 Labour Supply (long run) E3 a b W3 c Wage Rate Employment D1 D2 E1 E2 Inelastic and elastic labour supply curves A perfectly elastic labour supply curve Labour Supply Public sector employees in the UK account for less than 1% of the top 1% of the income distribution scale Report of the High Pay Commission
  • 9.  In the 30 years to 1979, the share of income going to the top 0.1 per cent of earners dropped from 3.5 per cent to 1.3 per cent. Today, the top 0.1 per cent takes home as big a share as it did in the 1940s. Wage Differentials No one factor explains the gulf in pay that persists between occupations: 1. Compensating wage differentials - higher pay can often be reward for risk-taking in certain jobs, working in poor conditions and having to work unsocial hours. 2. Equalising difference and human capital - in a competitive labour market, wage differentials compensate workers for the opportunity costs and direct costs of human capital acquisition. 3. Different skill levels - the gap between poorly skilled and highly skilled workers gets wider each year. Market demand for skilled labour grows more quickly than for semi-skilled workers. This pushes up pay levels. Highly skilled workers are often in inelastic supply and rising demand forces up the "going wage rate" in an industry. Real Wage Rate Employment W1 Real Wage Rate Employment D2 D1 E2 E1 The equilibrium price of labour (market wage rate) in a given market is determined by the interaction of the supply and demand for labour. Employees are hired up to the point where the extra cost of hiring an employee (their wage) is equal to the addition to sales revenue from hiring them, their MRP. Labour Supply D1 E1 Labour Supply W1 W2 D3 W3 E3 Graduates and NEETS One person in four in the workforce has a degree, a share that has doubled in the past 18 years. Despite the increased supply of graduates, they still earn hourly wages that are 61% higher than those paid to individuals holding only A-levels. In another snapshot of the population, data shows that the proportion of 19-to-24-year-olds who are neither in education, employment or training (NEETS) has risen to 19.1% in the summer of 2011 up from 16.5% in 2010.
  • 10. 4. Differences in labour productivity and revenue creation - workers whose efficiency is highest and ability to generate revenue for a firm should be rewarded with higher pay. E.g. sports stars can command top wages because of their potential to generate extra revenue from ticket sales and merchandising. 5. Trade unions and their collective bargaining power - unions might exercise their bargaining power to offset the power of an employer in a particular occupation and in doing so achieve a mark-up on wages compared to those on offer to non-union members 6. Employer discrimination is a factor that cannot be ignored despite equal pay legislation Sticky wages in the labour market  Economists often refer to the existence of “sticky wages.” In a fully flexible labour market, a decrease in the demand for labour should cause a fall in wages and a contraction in employment - just like any demand curve shifting down.  However, sticky wages refers to a situation in which the real wage level doesn't fall immediately, partly because many employees have wages specified in employment contracts that cannot be re-negotiated immediately, and because workers (perhaps protected by their trade unions) are resistant to cuts in nominal wages.  If the wage level cannot fall when demand falls, it leads to a much bigger drop in employment and, more importantly, involuntary unemployment because of a failure of the labour market to clear.  The evidence for sticky wages is a good counter-argument to neo-classical models of the labour market that suggest that real wage levels respond flexibly to any changes in labour demand and supply conditions.  Will wages become less sticky during the recession? There are signs that workers, fearful for their jobs at such a difficult time, have become more willing to consider and perhaps accept pay freezes or wage cuts traded off against improved job security. Real Wage Rate Employment W1 Real Wage Rate Employment Ld E1 Ls W2 E2 Ls Ld
  • 11. Government policies and the labour supply The main policies designed to increase the supply of labour available to the economy are as follows: 1. Reforms to the system of direct taxation: In the 1980s, Thatcherite economics focused on cutting income tax rates particularly at the top end and switching from direct towards indirect taxation. More recently, governments have tended to focus more on reductions in the lower rates of income tax and tax allowances for lower-paid workers. The theoretical idea remains broadly the same, that lower direct taxes increase the post-tax reward to working and act as an incentive for more people to join the labour supply. In 2007 the government announced that the 10% starting rate of income tax would be withdrawn in 2008 and that the basic rate of tax would be cut from 22% to 20%. From 2010 the government plans to have a top rate of income tax of 50% for the highest income earners. 2. Reforms to the benefits system: The emphasis here has changed away from the rather crude idea of cutting the real and relative value of welfare benefits towards encourage people into searching for work, towards a reliance on tax credits (for example the Working Families Tax Credit) to give parents with children a greater financial incentives to work. The aim is to reduce the disincentive problems created by the unemployment and poverty trap. 3. Increased investment in education and training: This is designed to boost the human capital of the labour force and improve the occupational mobility of the labour force to meet the changing demands of employers across different industries. 4. A more relaxed approach to labour immigration: Particularly where there are shortages of workers with skills such as consultants and fully trained nurses in the NHS, or shortages of teachers in certain subjects. The effect of net inward migration on the labour supply is shown in the diagram below. Real Wage Rate Employment Labour Supply W2 E1 W1 Labour Demand d Labour Supply with migration E2 Strong inflows of labour into the economy can have the effect of increasing the labour supply This puts downward pressure on real wages (for a given level of labour demand) e.g. through helping to relieve labour shortages in particular industries and occupations If migration provides a boost to the labour supply and to labour productivity, there is the prospect of an outward shift in a country’s long run aggregate supply
  • 12. The Work-Leisure Trade Off  Will people work longer hours if they are offered higher pay?  Standard economic theory would suggest that the real wage is a key determinant of the number of hours. The real wage is the money wage rate adjusted for changes in the price level and it measures the quantity of goods and services that can be bought from each hour worked.  An increase in the real wage on offer in a job should lead to someone supplying more hours over a given period of time  There is the possibility that further increases in the wage rate might have little effect on an individual’s labour supply. Indeed, there is the possibility of a backward-bending individual labour supply curve. This is illustrated in the next diagram. Two distinct individual labour supply curves are shown. 1. In the first curve, higher real wages lead to an increase in the number of extra hours supplied, although the rate at which the individual gives up their leisure time and work longer hours diminishes as the real wage rises. 2. In the second curve, for most of the range of real wages, the same prediction holds true, but when as real wages step upwards, eventually an individual may choose to actually work fewer hours (ceteris paribus) giving us what is sometimes termed a “backward bending” labour supply curve. Income and substitution effects To understand why this might happen we consider the income and substitution effects that arise from a change in the real wage being paid to an individual worker. We start with the income effect. o The income effect: Higher real wages increase the income that someone can earn from a job, but they also mean that the hours of work needed to earn enough to pay for a product declines. Higher pay levels mean that a target real wage can be achieved with fewer hours of labour supply. So this income effect might persuade people to work less hours and enjoy extended leisure time. Real Wage Rate Hours of Work Supplied (LS) Individual Labour Supply (1) Individual Labour Supply (2) L1 L3 L2
  • 13. o The substitution effect: The substitution effect of a higher wage rate should unambiguously give people an incentive to work extra hours because the financial rewards of working are raised, and the opportunity cost of not working (measured by the wages given up when people opt for leisure instead) has increased. o With the income and substitution effects working in opposite directions, there is no hard and fast prediction about whether people will choose to increase their labour supply as real wages increase. o Are the income and substitution effects different for male compared to female workers? o What about younger workers entering the labour market for the first time who are looking to save to finance a deposit on a house or to fund other major items of spending? o How might people closer to retirement age respond to changes in real wages? o What of workers in households where at least someone else is in paid employment compared to a household where there is only one main “breadwinner”? The importance of incentives  Most of us rely on income from our work to pay for the things we need and higher pay and better conditions should be an incentive perhaps to work some extra hours or search for work in the first place.  But for many workers there are disincentives to supply their labour – and these problems often affect people in lowly paid jobs.  This is known as the problem of the poverty trap and there is an example in the case study below. Case Study: The Poverty Trap worsens in Scotland The soaring cost of childcare is worsening the poverty trap according to a new report commissioned for the save the Children Fund in Scotland. More than one quarter of Scots parents on low incomes cannot work full time because of the cost of registered childcare that has risen by more than 10 per cent this year across most of the country. Joanne Brady, a single mother of two children from Glasgow, is unable to work because she loses more in means-tested child tax credits than she gains in income. “They take 20 per cent off for each child when you go to work. You still have to pay your housing, travel and lunches and it's just not adequate.” Ms Brady, 27, is among the 28 per cent of parents with children under 18 and an income of less than £15,000. Source: News reports, July 2008
  • 14. 2. Monopsony in the Labour Market o With increasing frequency these days we read in the media of stories of people – often in low paid jobs – who claim that they are being underpaid for the job that they do. T o There are many possible reasons for this and one of them is the effect of an employer using their monopsony power. This is the focus of this chapter. Monopsony o A monopsony producer has buying power in the labour market when seeking to employ extra workers and may use that buying-power to drive down wage rates. o The monopsonist knows that they face an upward sloping labour supply curve, in other words, to attract more workers in their industry, they must pay a higher wage rate – so the average cost of employing labour rises with the number of people taken on. o Because the average cost of labour is increasing, the marginal cost of extra workers will be even higher, since we assume that an increase in the wage rate paid to attract one extra worker must also be paid to existing workers. o The profit maximising level of employment is where the marginal cost of labour equates with the marginal revenue product of employing extra workers. o In the diagram, Eq workers are taken on, but the monopsonist can employ these workers at an average wage rate of Wq – a pay level below the marginal revenue product of the last worker. o In this sense, the monopsonist is exploiting labour by not paying them the full value of their marginal revenue product. Wage Rate (W) Employment of Labour (E) Demand = MRPL Labour Supply (ACL) Wq Eq Marginal Cost of Labour (MCL) MRPL A monopsony is a market dominated by a single buyer. A monopsonist has the market power to set the price of whatever it is buying (from raw materials to labour inputs)
  • 15. o Trade unions may seek to counter-balance the monopsony power of an employer by controlling aspects of the labour supply and by using whatever collective bargaining power they possess to negotiate wages higher without being at the expense of employment levels. Examples of monopsony employers o Major employers in a small town (e.g. a car plant, a major supermarket or the head office of a bank) o Nursing homes as employers of care assistants. o The government can also have monopsony power as the major employer in the teaching profession or the National Health Service o Local authorities are also big employers for example in refuse collection, street-cleaning and in running council nursing homes and local libraries o Agencies who employ thousands of people in the hotel, catering and cleaning industries o The farming sector which employs huge numbers of people on temporary terms during the peak harvesting season Government intervention in labour markets to combat the effects of worker exploitation An employer having monopsony power in the labour market does not necessarily mean that workers will find their wages and other terms and conditions worse than if the market for labour was more competitive. That said there often are an economic and a clear social justification for legal interventions in the jobs market to provide support and backing for thousands of vulnerable and often poorly-paid people. Two examples of such intervention are 1. Legal protections such as the Gangmasters Authority 2. The national minimum wage (NMW) and also a campaign for a living wage. The London living wage was introduced in 2005 and more than 100 London- based employers have signed up to it. Gangmasters Licensing Authority (GLA) The Gangmasters Licensing Authority was set up in 2006 to combat exploitation of workers in agriculture, horticulture and food processing plants, by overseeing the people who supply much of the labour. In 2008 it set up operation Ajaz – an investigation into pay and working conditions in a cluster of industries where workers are thought to be most vulnerable to exploitation – it targeted employers in the agriculture, horticulture, forestry, shell fishing and food processing industries. Young workers look for better pay and conditions The prospect of better pay has overtaken job satisfaction as the key reason for moving to another job, a survey suggests. But employment prospects in the UK labour market remain poor with the recovery at a fragile stage. It's well known that under-25s are struggling to find work. The latest official figures show that 935,000 are unemployed in the UK. Research by the Institute for Employment Studies suggests those under 30 have seen their real pay fall £890 a year since the credit crunch first hit in 2008 Adapted from news reports South Africa wine grown by 'abused' workers Workers helping to make South Africa's wines are subject to unsafe working conditions and inadequate housing, a report has said. Human Right Watch says workers on wine and fruit farms face exposure to pesticides and are blocked from forming trade unions.These workers are some of the worst paid in the country - despite strict labour laws. Fashion chain Zara acts on Brazil sweatshop conditions Spanish fashion chain Zara say they are strengthening the oversight of their production system after workers were found toiling in a Brazilian sweatshop. A raid in Sao Paulo found mostly Bolivian immigrants working for a pittance in unsafe conditions. A raid in Sao Paulo found people working in cramped, unsanitary conditions, for long hours.
  • 16. The National Minimum Wage (NMW) The National Minimum Wage (NMW) is a minimum amount per hour that most workers in the UK are entitled to be paid. The NMW rates are reviewed each year by the Low Pay Commission and from 1 October 2011 the main hourly rate for workers aged 21 is £6.08 (£4.98 for workers aged 18-20, with lower rates for workers aged 16-17 (£3.68) and for apprentices under 19 years old £2.60). How might a minimum wage impact on employment and the wage decisions of a monopsony business? o Because the minimum wage is a pay floor, the monopsonist cannot pay a wage below it o So the NMW effectively becomes the marginal and average cost curve for hiring workers up to employment level Emin. o Thereafter to hire additional staff, the wage rate must be bid up, again creating a divergence between the average and marginal cost of labour. o The effect on the diagram is that with an appropriately set rate, the profit maximising level of employment after a minimum wage is higher (E2) and the wage rate paid to labour has also increased (W2). o In this example, making certain assumptions, a minimum wage might actually boost total employment and secure better pay for workers in occupations and industries where there is some monopsonistic power among the buyers of labour. Wage Rate (W) Demand = MRPL Labour Supply (ACL) Wq Eq MRPL National Minimum Wage Marginal Cost with NMW NMW E2 Employment of Labour (E)
  • 17. 3. Discrimination in the Labour Market What is discrimination? o Nobel-prize winning economist Kenneth Arrow has defined discrimination as “the valuation in the market place of personal characteristics of the worker that are unrelated to worker productivity”. o These personal characteristics may be sex, race, height, appearance, age, national origin or sexual preference – or indeed any other identifiable characteristic. o Discrimination is a cause of labour market failure and a source of inequity in the distribution of income and wealth and it is usually subject to intervention e.g. through regulation and legislation. o Discriminatory treatment of minority groups leads to lower wages and poor employment opportunities, including less training, job insecurity and fewer promotions. The result is that groups exposed to discrimination earn less than they would and suffer a fall in relative living standards. Why does discrimination occur in the labour market? 1. The 'Taste' Model (Gary Becker) - Discrimination arises here because employers and workers have a ‘distaste’ for working with people from different ethnic backgrounds or final customers dislike buying goods from sales people from different races i.e. people prefer to associate with others from their own group. They are willing to pay a price to avoid contact with other groups. With reference to race, this is equivalent to racial prejudice. 2. Employer ignorance – Discrimination arises because employers are unable to observe directly the productive ability of individuals and therefore characteristics such as gender or race may be used as ‘proxies’ – the employer through ignorance or prejudice assumes that certain groups of workers are less productive than others and is less willing to employ them, or pay them a wage or salary that fairly reflects their productivity, experience and applicability for a particular job. 3. Occupational crowding effects – Females and minorities may be crowded into a cluster of lower paying occupations.
  • 18. Younger workers are often among the most vulnerable in the labour market. Since the 2008-09 recession employment among workers aged 18-24 has contracted by nearly 400,000 and the unemployment rate among this group has jumped from 12% to over 18%. Little wonder that politicians are under great pressure to invest extra funds in improving job prospects for this segment of the labour force Discrimination against female workers - the “gender pay gap” in the UK There is little doubt that a permanent gap exists between average pay rates for females and males in the UK labour market. Evidence of the gender pay gap comes from the New Earnings Survey. The gender gap, measured by full-time median hourly pay rates excluding overtime, shrank from 12.2 per cent to a record low of 10.2 per cent in the year to April 2010, according to an annual survey of hours and earnings by the Office for National Statistics. Men’s median hourly earnings were £13.01, while for women the rate was £11.68. The median is the level at which half of workers fall above and half below. In 1997 the gender pay gap in median earnings for full-timers was around 17 per cent and now it’s dropped to around 10 per cent. The median gender gap for all employees, including part-timers, in 2010 fell from 22 per cent to 19.8 per cent. The gender gap was widest in south-east England and narrowest in Northern Ireland. What factors explain the gender pay gap in the UK? 1. Human capital: i.e. there are differences in educational levels and work experience between males and females. Breaks from paid work, including time to raise a family, can impact on women's level of work experience. 2. Part-time working: a significant proportion of women work part-time and part-time work typically pays less well than full-time jobs. Fewer hours worked inevitably has an effect on the weekly gross earnings of female workers compared to men. 3. Travel patterns: on average, women spend less time commuting than men with the result that they will have a smaller pool of jobs to choose from. It may also result in lots of women wanting work in the same location near to where they live which will result in lower equilibrium wages for those jobs.
  • 19. 4. Occupational segregation: 60 per cent of women work in just 10 occupations. Occupations which are female-dominated are often relatively poorly paid jobs (e.g. Caring, Cashiering, Catering, Cleaning and Clerical jobs) and there is continued under-representation in higher paid jobs within occupations – the so-called "glass ceiling" effect. 5. Employer discrimination: Work by the LSE calculates that up to 42% of the gender pay gap is attributable to direct discrimination against women. Since 1995 the number of equal pay cases registered with employment tribunals has more than doubled. 6. The effects of monopsony power: Females may be relatively geographically immobile (because they are tied to their husbands' place of employment) and may be paid less than a competitive wage by a monopsonist employer. Government Intervention to reduce the gender gap o The Equal Pay Act introduced in 1970 sought to provide legal protection for female workers and encouraged employers to bring the pay for males and females into line. o The Sex Discrimination Act of 1975 outlawed unequal opportunities for employment and promotion in the workplace because of gender and it set up the Equal Opportunities Commission. o Attention has switched in recent years away from legislation towards encouraging more women to stay on in further and higher education providing and targeted assistance for single parents to find work and thereby increase the labour market participation ratio among female workers.
  • 20. Theory of labour market discrimination We can model the effects of discrimination using a simple labour demand and supply framework It is difficult to be precise about the effects of discrimination in the labour market. Employers rarely have full information about the productivity of all of their workers, let alone prejudiced or ignorant views about the relative merits and de-merits of different groups. Increasingly employers’ organisations along with trade unions are working hard to break down barriers to the employment of different minority groups and in highlighting instances of discriminatory behaviour. The issue of labour market discrimination will remain with us for many years. It is closely linked to the issue of labour migration and in particular, the risks of discrimination of the many thousands of workers from Eastern Europe who have come into the UK either on a temporary or permanent basis now that twelve countries have joined the European Union. Ee Em Wm We EeEd Wd We Employment of White malesEmployment of Non-White Females Wage Supply MRPL MRPL Dis Supply MRPL MRPL Wm If employers are prejudiced about the relative productivity of different groups of workers, this will be reflected in their estimates of the marginal revenue productivity of each group. The MRPL of discriminated groups is lower than for other groups. This is reflected in lower relative wages and a lower level of employment Wage
  • 21. 4. Trade Unions in the Labour Market Trade unions are organisations of workers that seek through collective bargaining with employers to protect and improve the real incomes of their members, provide job security, protect workers against unfair dismissal and offer a range of other work-related services including support for people claiming compensation for injuries sustained in a job. o Association of Flight Attendants (AFA) o Association of Teachers and Lecturers (ATL) o Bakers, Food and Allied Workers Union (BFAWU) o Communication Workers Union (CWU) o Fire Brigades Union (FBU) o National Union of Journalists (NUJ) o Prison Officers Association (POA) o Professional Footballers Association (PFA) o Transport and General Workers' Union (T&G) Main roles of unions o Improve the real incomes of their members o Lobby for better working conditions and pensions o Provide job security o Protect their workers against unfair dismissal o Provide a counter-balance to the monopsony power of some employers o Support people claiming compensation for injuries sustained in a job o Protect workers against possible employment-related discrimination Union Membership Trends 1. There has been a long term decline in union membership. In 2008, only 28 per cent of people in a job in the UK were members of a trade union a. Only one in six private sector employees in the UK were union members in 2006 b. Almost three in five public sector employees in the UK were union members c. Around one third of workers say that their pay and conditions are influenced by trade union collective bargaining d. The hourly earnings of union members averaged £13.07 in 2008, 12.5 per cent more than the earnings of non-members e. Nearly 60 per cent of people working in education are members of a trade union but only 6 per cent of people in hotels and restaurants and only 11 per cent of people working in wholesale, retail and motor trades f. Only one worker in five in manufacturing industry is a member of a union g. Only one worker in ten aged between 16-24 years is a trade union member 2. Union density is highest in the Scandinavian countries of Sweden (70.8 per cent), Finland (70.3 per cent), and Denmark (69.1 per cent) and lowest in Hungary (16.9 per cent), the United States (11.6 per cent) and France (7.8 per cent). 3. Unions now have significantly less power and influence to determine pay and conditions than twenty years ago although in some industries (including postal workers, railway worker, fire fighters and prison officers) unions are still prepared to exert their “industrial muscle”.
  • 22. 4. Under new legislation, employers must recognise a union in pay and employment discussions when a majority of the workforce want to be represented and has voted for it. But there is little evidence that union members secure any significant wage “mark-up” or greater job protection than people in non-union jobs 5. In current times, employers have less incentive to fear unions (many work in partnership with businesses) but individuals have less incentive to belong since inflation is low and the economy is strong 6. The number of active trades unions has declined by over 40% between 1990 and 2005 – there have been a number of mergers. Why has union membership declined? 1. Many people no longer believe that union membership is worth their while a. Low inflation means less pressure for higher pay to protect real incomes b. Tougher employment laws make it harder for unions to strike c. Perception that trade unions have lost some of their relevance 2. Changes to the nature of the UK labour market a. Increased number of people working part-time or flexi time b. Shift towards shorter employment contracts c. Decline in the number of jobs in heavy industry (de-industrialisation) 3. Some employers have resisted having trade unions in their workplace – or prefer to deal only with one or two unions on pay and other issues Trade union power Trade union membership in Britain peaked at over 13 million 30 years ago but now stands at just over 7 million, despite the number of workers rising over the period. Only about 15% of private sector workers are in a union compared to over half of those in the public sector
  • 23. The number of monthly industrial disputes / stoppages in the UK has been at historically low levels for more than a decade. The 1970s and 1980s were years when strike-action was common in many industries. Unions have less power and influence in the labour market than they did two decades ago although in several big industries they can still exert their “industrial muscle”. Power has gradually ebbed away for a variety of reasons: 1. Employment legislation which has outlawed illegal strikes, given employers the right to seek compensation for the effects of certain forms of industrial action and requires all unions to hold secret ballots of their members before any strike action is permitted 2. The effects of increased competition in product markets – in nearly every domestic market for goods and services, there is greater competition than there was a few years ago. Be it the intensity of global competition from lower-cost producers or the deregulation of markets that has increased market contestability, trade unions have had to adjust to a world where the pricing power of manufacturers and service industries has been severely curtailed. Hence the increasing demands from businesses to link pay and conditions to worker productivity. There are still some fairly militant trade unions around – notably in the public sector services including transport. The train drivers’ union, ASLEF, has been one of the more militant unions in recent years, conducting strikes on the rail network and London Underground. 3. Patterns of employment: There has been a long term change in the structure of employment in the British economy away from traditionally strong union sectors such as heavy engineering, coal-mining, steel and textiles, towards service sector jobs in the private sector where union density is much lower Average weekly earnings are higher in the public sector than in the private sector. That said the chart shows average wages and there will be huge differences within this figure – for example in the private sector, contrast the earnings of top premier league footballers with people working as kitchen workers in a London hotel
  • 24. Unions and wage negotiations – labour market theory o Unions might seek to exercise their collective bargaining power with employers to achieve a mark-up on wages compared to those on offer to non-union members. o For this to happen, a union must have some control over the labour supply available to an industry. o In the past this was possible if a union operated a closed shop agreement with an employer – i.e. where the employer and union agreed that all workers would be a member of a particular union. o However in most sectors, the closed shop is now history – outlawed by legislation. More frequently, a union may simply bid for better pay through bi-lateral face-to-face negotiations with employers to achieve an increase in wages ahead of the rate of inflation so that real wages rise, and other improvements to working hours and conditions. The balance of power between employers and a trade union in their periodic wage negotiations depends on a range of factors including: 1. Unemployment: when labour is scarce and there are shortages of skilled workers, then the balance of power tilts towards unions. Unions are always less powerful when the demand for labour is falling and labour is less scarce. 2. Competitive pressures in product markets – when a firm is enjoying a dominant monopoly position and high levels of abnormal profit, the unions will know that the employer has the financial resources to meet a more generous wage settlement Wage Rate Employment Labour Supply (union controlled) E1E2 Labour Demand W1 W2 Employment Labour Supply (union controlled) E1E2 Labour Demand Labour Supply to the Economy W1 W3 Elastic labour demand – union control of labour supply forces wages higher – but employment contracts Inelastic labour demand – unions may be more effective in negotiating higher pay levels and increasing total factor earnings
  • 25. The conventional case against trade unions 1. Unions act as a distortion in the workings of the labour market 2. They drive wages higher and profits & employment lower than if the labour market was fully competitive 3. They may prevent the introduction of new, flexible work practices 4. They may delay the introduction of new technology which thus affects productivity 5. Their collective bargaining power can lead to higher wages and cost-push inflationary pressures which leads to a worsening of macroeconomic performance 6. Unions can cause labour market failure such as real-wage unemployment Counter-arguments 1. The new ‘partnership model’ between employers and unions a. Unions and their members stand to gain from i. Higher productivity ii. The workforce having more flexible skills iii. Improved working conditions and employment rights 2. Higher pay does not automatically lead to fewer jobs i. Monopsony argument (see previous page) ii. Higher pay can create incentives for higher productivity and working more hours 3. Keynesian effects of increased incomes on consumer demand for goods and services – rising aggregate demand – leading to a boost to short run economic growth 4. Trade unions have modernised to reflect changes in the domestic and global economy 5. Their role is becoming ever more important a. Threats to the stability and future of occupational pensions b. Persistent discrimination in the labour market (gender glass ceilings, age, ethnicity) 6. They can work with management and employers to improve efficiency and competitiveness – and therefore achieve a positive sum game 7. There has been a step change in industrial relations in the UK – which has made the UK economy a favoured venue for inflows of foreign direct investment – there are far fewer industrial stoppages and days lost from strike action (see the chart below)