Inflation charts
•
1 gefällt mir•3,050 views

Ten charts focusing on inflation data for the UK economy

Empfohlen
Weitere ähnliche Inhalte
Was ist angesagt?
Was ist angesagt? (20)
Andere mochten auch
Andere mochten auch (20)
Ähnlich wie Inflation charts
Ähnlich wie Inflation charts (20)
Mehr von tutor2u
Mehr von tutor2u (20)
Kürzlich hochgeladen
Kürzlich hochgeladen (20)
Inflation charts
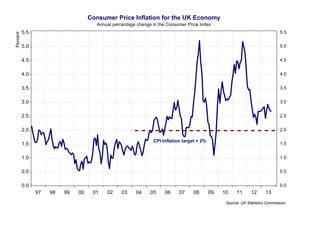
- 1. Consumer Price Inflation for the UK Economy Percent Annual percentage change in the Consumer Price Index 5.5 5.5 5.0 5.0 4.5 4.5 4.0 4.0 3.5 3.5 3.0 3.0 2.5 2.5 2.0 2.0 CPI Inflation target = 2% 1.5 1.5 1.0 1.0 0.5 0.5 0.0 0.0 97 98 99 00 01 02 03 04 05 06 07 08 09 10 11 12 13 Source: UK Statistics Commission
- 2. Inflation Expectations Bank of England/NOP, how do you expect prices to change over the next 12 months? 6.0 5.0 5.0 4.0 Percent 6.0 4.0 3.0 3.0 2.0 2.0 1.0 1.0 0.0 0.0 Q1 Q3 Q1 Q3 Q1 Q3 Q1 Q3 Q1 Q3 Q1 Q3 06 07 08 09 10 11 How do you expect prices to change over the next 12 months? United Kingdom, Consumer Prices, By Commodity, All items (CPI), Chg Y/Y Q1 Q3 12 Q1 13 Source: Bank of England
- 3. Consumer Price Inflation in Europe and the UK Percent Annual percentage change in consumer prices 6 6 UK 5 5 4 4 3 3 2 2 1 1 Euro Zone 0 0 -1 -1 05 06 07 08 09 10 11 12 13 Source: Reuters EcoWin
- 4. Changing Real Prices for Goods and Services Retail Price Index, January 1988 = 100 600 500 500 400 Index 600 400 Cigarettes 300 Rail fares 300 Repairs 200 200 All goods and services Clothing and footwear 100 100 Electrical appliances 0 0 88 89 90 91 92 93 94 95 96 97 98 99 00 01 02 03 04 05 06 07 08 09 10 11 12 13 Source: Monthly Digest and Statistics
- 5. Electricity and Gas Prices compared with changes in the CPI Index of consumer prices, 2005=100 250 250 225 225 200 200 Gas Prices 175 Index 175 150 150 Electricity Prices 125 125 Consumer Price Index (all items) 100 100 75 75 05 06 All items (CPI) 07 Gas 08 09 10 11 12 13 Electricity Source: Reuters EcoWin
- 6. Consumer Price Inflation and Interest Rates for the UK Annual percentage change in the UK Consumer Price Index, the inflation target is 2% 6 6 Base Interest Rates 5 5 Percent 4 4 3 3 2 2 Consumer Price Inflation 1 1 0 0 04 05 06 07 08 09 10 11 12 13 Source: Reuters EcoWin
- 7. Price Deflation for Selected Items Consumer price index, monthly value, 2005=100 170 170 160 160 150 150 140 140 Audio-Visual Equipment 130 120 Index 130 120 110 110 100 100 Clothing and Footwear 90 90 80 80 70 70 60 60 50 50 40 40 00 01 02 03 04 05 06 07 08 09 10 11 12 13 Source: Reuters EcoWin
- 8. Consumer Price Inflation for Goods and Services Annual Percentage Change in Prices 6 6 Inflation in Services 5 5 4 3 Percent 4 3 2 2 1 1 0 0 -1 -1 -2 Inflation in Goods -2 -3 -3 99 00 01 02 03 04 05 06 07 08 09 10 11 12 13 Source: Reuters EcoWin
- 9. Selected Weights in the UK Consumer Price Index Total weights for the CPI = 1000. Source: Office of National Statistics 150 150 125 125 Housing, water and fuels 1996=100 100 100 Foods 75 75 Clothing and footwear 50 50 Alcohol, tobacco and narcotics 25 25 Education 0 0 03 04 05 06 07 08 09 10 11 12 13 Source: UK Statistics Commission
- 10. UK Inflation and Crude Oil Prices Annual % change in the Consumer Price Index and the world crude price US dollars per barrel of oil 150 150 Crude Oil Price 100 100 50 50 0 0 6.0 6.0 Consumer Price Inflation 5.0 4.0 Percent 5.0 4.0 3.0 3.0 2.0 2.0 1.0 1.0 0.0 0.0 07 08 09 10 11 12 13 Source: UK Statistics Commission and IPE