SlideShare ist ein Scribd-Unternehmen logo
1 von 23
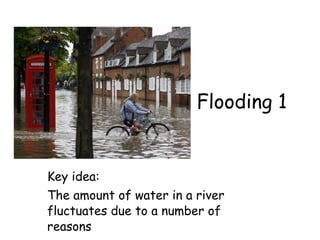
Flooding 1


Key idea:
The amount of water in a river
fluctuates due to a number of
reasons
Lesson objectives
• To know the terms:
 Flooding, hydrograph, rising limb, falling
 limb, lag time, drainage basin
• To be able to describe the
  characteristics of a hydrograph
Starter activity….
                     The area of land from which
A DRAINAGE BASIN     precipitation flows into a
                     stream.

DISCHARGE
                   The amount of water in a river
                   channel at a given time
VELOCITY           The speed of the river


WATERSHED              The boundary of a drainage
                       basin
A flood occurs when…
…..the discharge is so great that all the
  water can no longer be contained within
  the channel so that the river overflows
  its banks
Factors affecting discharge

•Amount and type of rainfall   • Soil

•Temperature                   • Land Use
                               • Slope
•Previous weather conditions
• Relief
•Drainage Density
•Rock Type
Hydrographs
                           Peak discharge


                                                  Falling
                       Rising
                                                  limb
                       limb
                                     storm flow

                                      normal (base) flow
I = Lagtime          Peak rainfall


Show the change in
discharge caused
by a period of
rainfall
Storm hydrograph
A graph which shows the relationship between
precipitation and the level of a river
APPROACH SEGMENT = base flow
• The discharge of the river before it rains.
RISING LIMB
• Results from a rapid increase in rainwater
  reaching the river.
LAG TIME
• The difference between the time of the
  heaviest rainfall and the maximum level and
  /or discharge of the river.
FALLING LIMB
• Some rainwater is still reaching the river, but
  in decreasing amounts – throughflow and
  groundwater flow
Why Construct & Analyse
Hydrographs ?
• To find out discharge patterns of
   a particular drainage basin


  Help predict flooding events,
   therefore influence implementation
   of flood prevention measures
                                        ©Microsoft Word clipart
ph
                                 g ra Basin lag time
                   d ro                                           Peak flow
              y                  3
          H
     od

                                                   limb


                                                                  Re
  lo


                                                                    ce
              Discharge (m3/s)


F
                                               Rising


                                                                      ss
                                                          Overland
                                 2


                                                                         io
                                                          flow


                                                                        nl
                                                                           im
                                              mm


                                                                              b
                                          4                Through flow
                                 1        3

                                          2
                                                               Base flow


                                     0         12         24     36      48       30   72

                                         Hours from start of rain storm
Discharge (m3/s)   3


                   2


                   1


                       0       12   24   36   48   30   72

                           Hours from start of rain storm
Rainfall shown
                   3                                  in mm, as a
                                                       bar graph
Discharge (m3/s)


                   2
                                mm
                            4

                   1        3

                            2


                       0         12   24   36   48    30   72

                           Hours from start of rain storm
Discharge in
                   3                                  m3/s, as a
                                                      line graph
Discharge (m3/s)


                   2
                                mm
                            4

                   1        3

                            2


                       0         12   24   36   48   30   72

                           Hours from start of rain storm
Rising limb
                                                               The rising
                   3                                         flood water in
                                                                the river


                                     li m b
Discharge (m3/s)


                                 Rising
                   2
                                mm
                            4

                   1        3

                            2


                       0         12           24   36   48   30   72

                           Hours from start of rain storm
Peak flow
                                                 Peak flow    Maximum
                   3                                         discharge in
                                                              the river


                                     limb
Discharge (m3/s)


                                 Rising
                   2
                                mm
                            4

                   1        3

                            2


                       0         12         24   36   48     30   72

                           Hours from start of rain storm
Recession limb
                                                 Peak flow
                                                                   Falling flood
                   3                                               water in the


                                     limb
                                                                       river


                                                  Re
Discharge (m3/s)


                                                      ce
                                 Rising


                                                      ss
                   2


                                                        ion
                                mm


                                                           li m
                                                            b
                            4

                   1        3

                            2


                       0         12         24   36    48         30   72

                           Hours from start of rain storm
Basin lag time
                                Basin lag time
                                                 Peak flow       Time
                   3                                             difference
                                                                 between the


                                     limb


                                                 Re
                                                   ce
                                                                 peak of the
Discharge (m3/s)


                                  Rising


                                                     ss
                   2


                                                        io
                                                                 rain storm and


                                                       nl
                                                        im
                                mm
                                                                 the peak flow


                                                             b
                            4

                   1        3
                                                                 of the river
                            2


                       0          12        24   36     48       30   72

                           Hours from start of rain storm
Base flow
                                Basin lag time
                                                    Peak flow
                                                                       Normal
                   3                                                discharge of


                                     limb
                                                                      the river


                                                    Re
                                                      ce
Discharge (m3/s)


                                  Rising


                                                        ss
                   2


                                                           io
                                                          nl
                                                           im
                                mm


                                                                b
                            4

                   1        3

                            2
                                                 Base flow


                       0          12        24     36      48       30   72

                           Hours from start of rain storm
Basin lag time
                                                    Peak flow

                   3


                                     limb


                                                    Re
                                                      ce
Discharge (m3/s)


                                  Rising


                                                        ss
                                            Overland
                   2


                                                           io
                                            flow


                                                          nl
                                                             im
                                mm


                                                                b
                            4                Through flow
                   1        3

                            2
                                                 Base flow


                       0          12        24     36      48       30   72

                           Hours from start of rain storm
Overland flow = surface run off

 Volume of water reaching the river from
 surface run off

    Through flow
Volume of water reaching the river through
horizontal movement of water through the
soil and underlying rock layers
• After a period of heavy rainfall, the
  discharge increases.


• The lagtime is the difference in time
  between the peak of the rainstorm and
  the peak of the discharge. The shorter
  this is and the steeper the rising limb
  the greater the risk of flooding.


• Complete task 1
Plenary
Homework
Worksheet - task 2 a - c

Weitere ähnliche Inhalte

Was ist angesagt?

What is the river discharge and what factors
What is the river discharge and what factorsWhat is the river discharge and what factors
What is the river discharge and what factorsMischa Knight
 
River Discharge and Hydrographs
River Discharge and HydrographsRiver Discharge and Hydrographs
River Discharge and HydrographsSteven Heath
 
1 module run off (1)
1 module run off (1)1 module run off (1)
1 module run off (1)Riya Susan
 
1 module hydrology (1)
1 module hydrology (1)1 module hydrology (1)
1 module hydrology (1)Riya Susan
 
Channel efficiency - Rivers
Channel efficiency - RiversChannel efficiency - Rivers
Channel efficiency - RiversSteven Heath
 
measurement of infiltration
measurement of infiltrationmeasurement of infiltration
measurement of infiltrationTharun Reddy
 
The drainage basin as a system lesson 2
The drainage basin as a system   lesson 2The drainage basin as a system   lesson 2
The drainage basin as a system lesson 2Ms Geoflake
 
Runoff computation by infiltration indices
Runoff computation by infiltration indicesRunoff computation by infiltration indices
Runoff computation by infiltration indicesSagar Vekariya
 
1 introduction to hydrology
1 introduction to hydrology1 introduction to hydrology
1 introduction to hydrologyAbdulhakim Mobin
 
Hydrology & Fluvial Geomorphology
Hydrology & Fluvial GeomorphologyHydrology & Fluvial Geomorphology
Hydrology & Fluvial GeomorphologyMalia Damit
 
Wrm hydrology by k r thanki
Wrm hydrology by k r thanki Wrm hydrology by k r thanki
Wrm hydrology by k r thanki Krunal Thanki
 
Infiltration and runoff
Infiltration and runoffInfiltration and runoff
Infiltration and runoffMoudud Hasan
 

Was ist angesagt? (20)

What is the river discharge and what factors
What is the river discharge and what factorsWhat is the river discharge and what factors
What is the river discharge and what factors
 
River Discharge and Hydrographs
River Discharge and HydrographsRiver Discharge and Hydrographs
River Discharge and Hydrographs
 
River discharge
River dischargeRiver discharge
River discharge
 
Flood Magnitude VLE
Flood Magnitude  VLEFlood Magnitude  VLE
Flood Magnitude VLE
 
Hyd runoff
Hyd runoffHyd runoff
Hyd runoff
 
1 module run off (1)
1 module run off (1)1 module run off (1)
1 module run off (1)
 
River profile
River profileRiver profile
River profile
 
Drainage Basins
Drainage BasinsDrainage Basins
Drainage Basins
 
1 module hydrology (1)
1 module hydrology (1)1 module hydrology (1)
1 module hydrology (1)
 
Channel efficiency - Rivers
Channel efficiency - RiversChannel efficiency - Rivers
Channel efficiency - Rivers
 
Runoff
RunoffRunoff
Runoff
 
measurement of infiltration
measurement of infiltrationmeasurement of infiltration
measurement of infiltration
 
The drainage basin as a system lesson 2
The drainage basin as a system   lesson 2The drainage basin as a system   lesson 2
The drainage basin as a system lesson 2
 
Runoff computation by infiltration indices
Runoff computation by infiltration indicesRunoff computation by infiltration indices
Runoff computation by infiltration indices
 
Runoff
RunoffRunoff
Runoff
 
1 introduction to hydrology
1 introduction to hydrology1 introduction to hydrology
1 introduction to hydrology
 
4 runoff and floods
4 runoff and floods4 runoff and floods
4 runoff and floods
 
Hydrology & Fluvial Geomorphology
Hydrology & Fluvial GeomorphologyHydrology & Fluvial Geomorphology
Hydrology & Fluvial Geomorphology
 
Wrm hydrology by k r thanki
Wrm hydrology by k r thanki Wrm hydrology by k r thanki
Wrm hydrology by k r thanki
 
Infiltration and runoff
Infiltration and runoffInfiltration and runoff
Infiltration and runoff
 

Andere mochten auch

Runoff and Hydrograph
Runoff and HydrographRunoff and Hydrograph
Runoff and HydrographSajjad Ahmad
 
Unit hydrograph by anwar
Unit hydrograph by anwarUnit hydrograph by anwar
Unit hydrograph by anwarMuhammad Anwar
 
Causes Of River Floods
Causes Of River FloodsCauses Of River Floods
Causes Of River FloodsMrs Coles
 
The geomorphological unit hydrograph
The geomorphological unit hydrographThe geomorphological unit hydrograph
The geomorphological unit hydrographRiccardo Rigon
 
Hyetograph and hydrograph analysis
Hyetograph and hydrograph analysisHyetograph and hydrograph analysis
Hyetograph and hydrograph analysisvivek gami
 
Flooding 7 River Tees Case Study
Flooding 7 River Tees Case StudyFlooding 7 River Tees Case Study
Flooding 7 River Tees Case Studytudorgeog
 
Characterizing Change in Baseflow Interactions with Urbanization Through Even...
Characterizing Change in Baseflow Interactions with Urbanization Through Even...Characterizing Change in Baseflow Interactions with Urbanization Through Even...
Characterizing Change in Baseflow Interactions with Urbanization Through Even...Dirk Kassenaar M.Sc. P.Eng.
 

Andere mochten auch (9)

Runoff and Hydrograph
Runoff and HydrographRunoff and Hydrograph
Runoff and Hydrograph
 
Unit hydrograph by anwar
Unit hydrograph by anwarUnit hydrograph by anwar
Unit hydrograph by anwar
 
Causes Of River Floods
Causes Of River FloodsCauses Of River Floods
Causes Of River Floods
 
The geomorphological unit hydrograph
The geomorphological unit hydrographThe geomorphological unit hydrograph
The geomorphological unit hydrograph
 
Hyetograph and hydrograph analysis
Hyetograph and hydrograph analysisHyetograph and hydrograph analysis
Hyetograph and hydrograph analysis
 
Flooding 7 River Tees Case Study
Flooding 7 River Tees Case StudyFlooding 7 River Tees Case Study
Flooding 7 River Tees Case Study
 
Surface runoff
Surface runoffSurface runoff
Surface runoff
 
Hydrograph
HydrographHydrograph
Hydrograph
 
Characterizing Change in Baseflow Interactions with Urbanization Through Even...
Characterizing Change in Baseflow Interactions with Urbanization Through Even...Characterizing Change in Baseflow Interactions with Urbanization Through Even...
Characterizing Change in Baseflow Interactions with Urbanization Through Even...
 

Mehr von tudorgeog

Meeting powerpoint 2016
Meeting powerpoint 2016Meeting powerpoint 2016
Meeting powerpoint 2016tudorgeog
 
Coastal questions
Coastal questionsCoastal questions
Coastal questionstudorgeog
 
Paper 1 revision 29.5.13 bv
Paper 1 revision 29.5.13 bvPaper 1 revision 29.5.13 bv
Paper 1 revision 29.5.13 bvtudorgeog
 
Tourism model answers
Tourism model answersTourism model answers
Tourism model answerstudorgeog
 
Describe how governments are attempting to cope with the problems of an agein...
Describe how governments are attempting to cope with the problems of an agein...Describe how governments are attempting to cope with the problems of an agein...
Describe how governments are attempting to cope with the problems of an agein...tudorgeog
 
Urban model answers
Urban model answersUrban model answers
Urban model answerstudorgeog
 
Iceland 2011 v2 nsr
Iceland 2011 v2 nsrIceland 2011 v2 nsr
Iceland 2011 v2 nsrtudorgeog
 
Mock exam feedback 2011
Mock exam feedback 2011Mock exam feedback 2011
Mock exam feedback 2011tudorgeog
 
Sustainability requires the
Sustainability requires theSustainability requires the
Sustainability requires thetudorgeog
 
Tourism in kenya– good or bad
Tourism in kenya– good or badTourism in kenya– good or bad
Tourism in kenya– good or badtudorgeog
 
Mass tourism – good or bad
Mass tourism – good or badMass tourism – good or bad
Mass tourism – good or badtudorgeog
 
L3 how do we manage tourism in the uk
L3 how do we manage tourism in the ukL3 how do we manage tourism in the uk
L3 how do we manage tourism in the uktudorgeog
 
L2 why has global
L2 why has globalL2 why has global
L2 why has globaltudorgeog
 
L1 why has global tourism grown nsr
L1 why has global tourism grown nsrL1 why has global tourism grown nsr
L1 why has global tourism grown nsrtudorgeog
 
L15 air and water pollution
L15 air and water pollutionL15 air and water pollution
L15 air and water pollutiontudorgeog
 

Mehr von tudorgeog (20)

Meeting powerpoint 2016
Meeting powerpoint 2016Meeting powerpoint 2016
Meeting powerpoint 2016
 
Coastal questions
Coastal questionsCoastal questions
Coastal questions
 
Paper 1 revision 29.5.13 bv
Paper 1 revision 29.5.13 bvPaper 1 revision 29.5.13 bv
Paper 1 revision 29.5.13 bv
 
Model 1
Model 1Model 1
Model 1
 
Model 3
Model 3Model 3
Model 3
 
Model 2
Model 2Model 2
Model 2
 
Tourism model answers
Tourism model answersTourism model answers
Tourism model answers
 
Describe how governments are attempting to cope with the problems of an agein...
Describe how governments are attempting to cope with the problems of an agein...Describe how governments are attempting to cope with the problems of an agein...
Describe how governments are attempting to cope with the problems of an agein...
 
Urban model answers
Urban model answersUrban model answers
Urban model answers
 
Iceland 2011 v2 nsr
Iceland 2011 v2 nsrIceland 2011 v2 nsr
Iceland 2011 v2 nsr
 
Mock exam feedback 2011
Mock exam feedback 2011Mock exam feedback 2011
Mock exam feedback 2011
 
Sustainability requires the
Sustainability requires theSustainability requires the
Sustainability requires the
 
Tourism in kenya– good or bad
Tourism in kenya– good or badTourism in kenya– good or bad
Tourism in kenya– good or bad
 
Mass tourism – good or bad
Mass tourism – good or badMass tourism – good or bad
Mass tourism – good or bad
 
L3 how do we manage tourism in the uk
L3 how do we manage tourism in the ukL3 how do we manage tourism in the uk
L3 how do we manage tourism in the uk
 
L2 why has global
L2 why has globalL2 why has global
L2 why has global
 
L1 why has global tourism grown nsr
L1 why has global tourism grown nsrL1 why has global tourism grown nsr
L1 why has global tourism grown nsr
 
L14 waste
L14 wasteL14 waste
L14 waste
 
L15 air and water pollution
L15 air and water pollutionL15 air and water pollution
L15 air and water pollution
 
Bhopal
BhopalBhopal
Bhopal
 

Kürzlich hochgeladen

TrustArc Webinar - How to Build Consumer Trust Through Data Privacy
TrustArc Webinar - How to Build Consumer Trust Through Data PrivacyTrustArc Webinar - How to Build Consumer Trust Through Data Privacy
TrustArc Webinar - How to Build Consumer Trust Through Data PrivacyTrustArc
 
New from BookNet Canada for 2024: BNC CataList - Tech Forum 2024
New from BookNet Canada for 2024: BNC CataList - Tech Forum 2024New from BookNet Canada for 2024: BNC CataList - Tech Forum 2024
New from BookNet Canada for 2024: BNC CataList - Tech Forum 2024BookNet Canada
 
Streamlining Python Development: A Guide to a Modern Project Setup
Streamlining Python Development: A Guide to a Modern Project SetupStreamlining Python Development: A Guide to a Modern Project Setup
Streamlining Python Development: A Guide to a Modern Project SetupFlorian Wilhelm
 
Hyperautomation and AI/ML: A Strategy for Digital Transformation Success.pdf
Hyperautomation and AI/ML: A Strategy for Digital Transformation Success.pdfHyperautomation and AI/ML: A Strategy for Digital Transformation Success.pdf
Hyperautomation and AI/ML: A Strategy for Digital Transformation Success.pdfPrecisely
 
Designing IA for AI - Information Architecture Conference 2024
Designing IA for AI - Information Architecture Conference 2024Designing IA for AI - Information Architecture Conference 2024
Designing IA for AI - Information Architecture Conference 2024Enterprise Knowledge
 
Developer Data Modeling Mistakes: From Postgres to NoSQL
Developer Data Modeling Mistakes: From Postgres to NoSQLDeveloper Data Modeling Mistakes: From Postgres to NoSQL
Developer Data Modeling Mistakes: From Postgres to NoSQLScyllaDB
 
Commit 2024 - Secret Management made easy
Commit 2024 - Secret Management made easyCommit 2024 - Secret Management made easy
Commit 2024 - Secret Management made easyAlfredo García Lavilla
 
SIP trunking in Janus @ Kamailio World 2024
SIP trunking in Janus @ Kamailio World 2024SIP trunking in Janus @ Kamailio World 2024
SIP trunking in Janus @ Kamailio World 2024Lorenzo Miniero
 
SAP Build Work Zone - Overview L2-L3.pptx
SAP Build Work Zone - Overview L2-L3.pptxSAP Build Work Zone - Overview L2-L3.pptx
SAP Build Work Zone - Overview L2-L3.pptxNavinnSomaal
 
How AI, OpenAI, and ChatGPT impact business and software.
How AI, OpenAI, and ChatGPT impact business and software.How AI, OpenAI, and ChatGPT impact business and software.
How AI, OpenAI, and ChatGPT impact business and software.Curtis Poe
 
"Debugging python applications inside k8s environment", Andrii Soldatenko
"Debugging python applications inside k8s environment", Andrii Soldatenko"Debugging python applications inside k8s environment", Andrii Soldatenko
"Debugging python applications inside k8s environment", Andrii SoldatenkoFwdays
 
DSPy a system for AI to Write Prompts and Do Fine Tuning
DSPy a system for AI to Write Prompts and Do Fine TuningDSPy a system for AI to Write Prompts and Do Fine Tuning
DSPy a system for AI to Write Prompts and Do Fine TuningLars Bell
 
DevEX - reference for building teams, processes, and platforms
DevEX - reference for building teams, processes, and platformsDevEX - reference for building teams, processes, and platforms
DevEX - reference for building teams, processes, and platformsSergiu Bodiu
 
"ML in Production",Oleksandr Bagan
"ML in Production",Oleksandr Bagan"ML in Production",Oleksandr Bagan
"ML in Production",Oleksandr BaganFwdays
 
Tampa BSides - Chef's Tour of Microsoft Security Adoption Framework (SAF)
Tampa BSides - Chef's Tour of Microsoft Security Adoption Framework (SAF)Tampa BSides - Chef's Tour of Microsoft Security Adoption Framework (SAF)
Tampa BSides - Chef's Tour of Microsoft Security Adoption Framework (SAF)Mark Simos
 
How to write a Business Continuity Plan
How to write a Business Continuity PlanHow to write a Business Continuity Plan
How to write a Business Continuity PlanDatabarracks
 
Scanning the Internet for External Cloud Exposures via SSL Certs
Scanning the Internet for External Cloud Exposures via SSL CertsScanning the Internet for External Cloud Exposures via SSL Certs
Scanning the Internet for External Cloud Exposures via SSL CertsRizwan Syed
 
The Ultimate Guide to Choosing WordPress Pros and Cons
The Ultimate Guide to Choosing WordPress Pros and ConsThe Ultimate Guide to Choosing WordPress Pros and Cons
The Ultimate Guide to Choosing WordPress Pros and ConsPixlogix Infotech
 
Unleash Your Potential - Namagunga Girls Coding Club
Unleash Your Potential - Namagunga Girls Coding ClubUnleash Your Potential - Namagunga Girls Coding Club
Unleash Your Potential - Namagunga Girls Coding ClubKalema Edgar
 
Dev Dives: Streamline document processing with UiPath Studio Web
Dev Dives: Streamline document processing with UiPath Studio WebDev Dives: Streamline document processing with UiPath Studio Web
Dev Dives: Streamline document processing with UiPath Studio WebUiPathCommunity
 

Kürzlich hochgeladen (20)

TrustArc Webinar - How to Build Consumer Trust Through Data Privacy
TrustArc Webinar - How to Build Consumer Trust Through Data PrivacyTrustArc Webinar - How to Build Consumer Trust Through Data Privacy
TrustArc Webinar - How to Build Consumer Trust Through Data Privacy
 
New from BookNet Canada for 2024: BNC CataList - Tech Forum 2024
New from BookNet Canada for 2024: BNC CataList - Tech Forum 2024New from BookNet Canada for 2024: BNC CataList - Tech Forum 2024
New from BookNet Canada for 2024: BNC CataList - Tech Forum 2024
 
Streamlining Python Development: A Guide to a Modern Project Setup
Streamlining Python Development: A Guide to a Modern Project SetupStreamlining Python Development: A Guide to a Modern Project Setup
Streamlining Python Development: A Guide to a Modern Project Setup
 
Hyperautomation and AI/ML: A Strategy for Digital Transformation Success.pdf
Hyperautomation and AI/ML: A Strategy for Digital Transformation Success.pdfHyperautomation and AI/ML: A Strategy for Digital Transformation Success.pdf
Hyperautomation and AI/ML: A Strategy for Digital Transformation Success.pdf
 
Designing IA for AI - Information Architecture Conference 2024
Designing IA for AI - Information Architecture Conference 2024Designing IA for AI - Information Architecture Conference 2024
Designing IA for AI - Information Architecture Conference 2024
 
Developer Data Modeling Mistakes: From Postgres to NoSQL
Developer Data Modeling Mistakes: From Postgres to NoSQLDeveloper Data Modeling Mistakes: From Postgres to NoSQL
Developer Data Modeling Mistakes: From Postgres to NoSQL
 
Commit 2024 - Secret Management made easy
Commit 2024 - Secret Management made easyCommit 2024 - Secret Management made easy
Commit 2024 - Secret Management made easy
 
SIP trunking in Janus @ Kamailio World 2024
SIP trunking in Janus @ Kamailio World 2024SIP trunking in Janus @ Kamailio World 2024
SIP trunking in Janus @ Kamailio World 2024
 
SAP Build Work Zone - Overview L2-L3.pptx
SAP Build Work Zone - Overview L2-L3.pptxSAP Build Work Zone - Overview L2-L3.pptx
SAP Build Work Zone - Overview L2-L3.pptx
 
How AI, OpenAI, and ChatGPT impact business and software.
How AI, OpenAI, and ChatGPT impact business and software.How AI, OpenAI, and ChatGPT impact business and software.
How AI, OpenAI, and ChatGPT impact business and software.
 
"Debugging python applications inside k8s environment", Andrii Soldatenko
"Debugging python applications inside k8s environment", Andrii Soldatenko"Debugging python applications inside k8s environment", Andrii Soldatenko
"Debugging python applications inside k8s environment", Andrii Soldatenko
 
DSPy a system for AI to Write Prompts and Do Fine Tuning
DSPy a system for AI to Write Prompts and Do Fine TuningDSPy a system for AI to Write Prompts and Do Fine Tuning
DSPy a system for AI to Write Prompts and Do Fine Tuning
 
DevEX - reference for building teams, processes, and platforms
DevEX - reference for building teams, processes, and platformsDevEX - reference for building teams, processes, and platforms
DevEX - reference for building teams, processes, and platforms
 
"ML in Production",Oleksandr Bagan
"ML in Production",Oleksandr Bagan"ML in Production",Oleksandr Bagan
"ML in Production",Oleksandr Bagan
 
Tampa BSides - Chef's Tour of Microsoft Security Adoption Framework (SAF)
Tampa BSides - Chef's Tour of Microsoft Security Adoption Framework (SAF)Tampa BSides - Chef's Tour of Microsoft Security Adoption Framework (SAF)
Tampa BSides - Chef's Tour of Microsoft Security Adoption Framework (SAF)
 
How to write a Business Continuity Plan
How to write a Business Continuity PlanHow to write a Business Continuity Plan
How to write a Business Continuity Plan
 
Scanning the Internet for External Cloud Exposures via SSL Certs
Scanning the Internet for External Cloud Exposures via SSL CertsScanning the Internet for External Cloud Exposures via SSL Certs
Scanning the Internet for External Cloud Exposures via SSL Certs
 
The Ultimate Guide to Choosing WordPress Pros and Cons
The Ultimate Guide to Choosing WordPress Pros and ConsThe Ultimate Guide to Choosing WordPress Pros and Cons
The Ultimate Guide to Choosing WordPress Pros and Cons
 
Unleash Your Potential - Namagunga Girls Coding Club
Unleash Your Potential - Namagunga Girls Coding ClubUnleash Your Potential - Namagunga Girls Coding Club
Unleash Your Potential - Namagunga Girls Coding Club
 
Dev Dives: Streamline document processing with UiPath Studio Web
Dev Dives: Streamline document processing with UiPath Studio WebDev Dives: Streamline document processing with UiPath Studio Web
Dev Dives: Streamline document processing with UiPath Studio Web
 

River Flooding Explained

  • 1. Flooding 1 Key idea: The amount of water in a river fluctuates due to a number of reasons
  • 2. Lesson objectives • To know the terms: Flooding, hydrograph, rising limb, falling limb, lag time, drainage basin • To be able to describe the characteristics of a hydrograph
  • 3. Starter activity…. The area of land from which A DRAINAGE BASIN precipitation flows into a stream. DISCHARGE The amount of water in a river channel at a given time VELOCITY The speed of the river WATERSHED The boundary of a drainage basin
  • 4. A flood occurs when… …..the discharge is so great that all the water can no longer be contained within the channel so that the river overflows its banks
  • 5. Factors affecting discharge •Amount and type of rainfall • Soil •Temperature • Land Use • Slope •Previous weather conditions • Relief •Drainage Density •Rock Type
  • 6. Hydrographs Peak discharge Falling Rising limb limb storm flow normal (base) flow I = Lagtime Peak rainfall Show the change in discharge caused by a period of rainfall
  • 7. Storm hydrograph A graph which shows the relationship between precipitation and the level of a river
  • 8. APPROACH SEGMENT = base flow • The discharge of the river before it rains. RISING LIMB • Results from a rapid increase in rainwater reaching the river. LAG TIME • The difference between the time of the heaviest rainfall and the maximum level and /or discharge of the river. FALLING LIMB • Some rainwater is still reaching the river, but in decreasing amounts – throughflow and groundwater flow
  • 9. Why Construct & Analyse Hydrographs ? • To find out discharge patterns of a particular drainage basin Help predict flooding events, therefore influence implementation of flood prevention measures ©Microsoft Word clipart
  • 10. ph g ra Basin lag time d ro Peak flow y 3 H od limb Re lo ce Discharge (m3/s) F Rising ss Overland 2 io flow nl im mm b 4 Through flow 1 3 2 Base flow 0 12 24 36 48 30 72 Hours from start of rain storm
  • 11. Discharge (m3/s) 3 2 1 0 12 24 36 48 30 72 Hours from start of rain storm
  • 12. Rainfall shown 3 in mm, as a bar graph Discharge (m3/s) 2 mm 4 1 3 2 0 12 24 36 48 30 72 Hours from start of rain storm
  • 13. Discharge in 3 m3/s, as a line graph Discharge (m3/s) 2 mm 4 1 3 2 0 12 24 36 48 30 72 Hours from start of rain storm
  • 14. Rising limb The rising 3 flood water in the river li m b Discharge (m3/s) Rising 2 mm 4 1 3 2 0 12 24 36 48 30 72 Hours from start of rain storm
  • 15. Peak flow Peak flow Maximum 3 discharge in the river limb Discharge (m3/s) Rising 2 mm 4 1 3 2 0 12 24 36 48 30 72 Hours from start of rain storm
  • 16. Recession limb Peak flow Falling flood 3 water in the limb river Re Discharge (m3/s) ce Rising ss 2 ion mm li m b 4 1 3 2 0 12 24 36 48 30 72 Hours from start of rain storm
  • 17. Basin lag time Basin lag time Peak flow Time 3 difference between the limb Re ce peak of the Discharge (m3/s) Rising ss 2 io rain storm and nl im mm the peak flow b 4 1 3 of the river 2 0 12 24 36 48 30 72 Hours from start of rain storm
  • 18. Base flow Basin lag time Peak flow Normal 3 discharge of limb the river Re ce Discharge (m3/s) Rising ss 2 io nl im mm b 4 1 3 2 Base flow 0 12 24 36 48 30 72 Hours from start of rain storm
  • 19. Basin lag time Peak flow 3 limb Re ce Discharge (m3/s) Rising ss Overland 2 io flow nl im mm b 4 Through flow 1 3 2 Base flow 0 12 24 36 48 30 72 Hours from start of rain storm
  • 20. Overland flow = surface run off Volume of water reaching the river from surface run off Through flow Volume of water reaching the river through horizontal movement of water through the soil and underlying rock layers
  • 21. • After a period of heavy rainfall, the discharge increases. • The lagtime is the difference in time between the peak of the rainstorm and the peak of the discharge. The shorter this is and the steeper the rising limb the greater the risk of flooding. • Complete task 1