SlideShare ist ein Scribd-Unternehmen logo
1 von 25
Activity Duration
1. “Guess” the activity duration,
     •      especially smaller activities.
2. Use Published materials:
     – Crew A= 1 Foreman, 2 Masons, 1 Labor
     – Crew A can install 200 12 Blocks/day


Spring 2008,                       PERT             1
King Saud University        Dr. Khalid Al-Gahtani
Activity Duration
3. Use companies historical data:
     –      similar to method#2.
     –      the jobs must be similar.
     –      Field input helps to modify historical data.
4. Use the estimated labor costs to determine the
   activity duration. Ex)
     –      Labor cost = $2000.
     –      Worker = $100/day
     –          task will take 20 worker days.
     –      If a 4 workers crew is used, t= 5 days.
     –      Estimate must be accurate.

Spring 2008,                        PERT                   2
King Saud University         Dr. Khalid Al-Gahtani
Example of using labor cost
•   A masonry facade consisting of 3,800 ft2,
•   total cost per worker hour = $31.5,
•   total estimated cost of labor = $10,500,
•   assuming 8-hour work/days and a crew of
    6 workers;


Spring 2008,                  PERT              3
King Saud University   Dr. Khalid Al-Gahtani
Example of using labor cost
      How many days should be allowed to complete this task?

(i)     da ys sho uld be a llo w ed to co m p lete this task is:
                              2
               V = 3,800 ft
               R ate = $31.5/hr
               T otal la bo r co st = $10,500
                                                   $ 10,500
               N u m ber o f ho urs requ ired =               = 333.33 hrs
                                                   $31.5/hr
                                                 3 3 3 .3 3 h rs
                      D uratio n =                                      = 6.94   7 days
                                     8 h rs/d ay.w orkers 6 w o rkers


      Spring 2008,                             PERT                                 4
      King Saud University              Dr. Khalid Al-Gahtani
Example of using labor cost
  What is the production rate that the crew must attain to
  keep the project on schedule and within the budget?

(ii) T he pro ductio n rate that the crew m ust attain to keep the pro ject
      o n sc hedu le a nd w ithin the budget is:
                                                                2
                                                   3,800 ft                     2
          T heo retica l P ro ductio n R ate =                      = 547.2 ft /day
                                                   6.94 days
                                                          2
                                           3,800 ft                     2
          A ctua l P ro ductio n R ate =                      = 542.8 ft /day
                                             7 days


  Spring 2008,                           PERT                                         5
  King Saud University            Dr. Khalid Al-Gahtani
Example of using Historical Data
  # o f 12 B lo ck s                                                B lo cks o n this
                             t (days)               B lo cks/da y
     o n P ro ject                                                       pro ject
        8,000                   16                          500           22
        12,000                  22                          546          20.2
        9,000                   19                          474          23.2
        7,000                   15                          467          23.6
        13,000                  20         ,                650          16.6
       14,0000                  31                          452          24.4

        n
                                                                         21.7
                       n
                                                                         2.76
                xi           ( xi     X)
                                           2

       i 1             i 1

            n                 n      1

Spring 2008,                               PERT                                         6
King Saud University                Dr. Khalid Al-Gahtani
Example of using Historical Data
     = 21.7 days, = 2.76 days
       - H o w ma ny da ys in o rder to be 85% ? t 85 % :
               at 85%  x= 1.04 days          (T able A ppendix 9-1b)
                   t-μ
               x=        t 85 % = + (x× )
                    σ
                 = 21.7 + (1.04 × 2.76) = 24.6 25 days
                                   ,


       - W hat % o f tim es < 28 da ys (% o f (t < 28 days)):
                   t-μ      28 - 21.7
              x=         =            = 2.28
                    σ         2.76
              % o f (t < 28 days)      = 0.9887 = 98.87%
               at x= 2.28 from T able Appendix 9 -1b
Spring 2008,                       PERT                             7
King Saud University        Dr. Khalid Al-Gahtani
Program Evaluation and Review
               Technique [PERT]
•        Activity time is very much probabilities.
•        three activity durations should be
         estimated for each activity:
     –      Optimistic duration           =a =4
     –      Pessimistic duration          =b =7
     –      Most Likely duration          =m =6


Spring 2008,                    PERT                 8
King Saud University     Dr. Khalid Al-Gahtani
• Optimistic Duration (a): Very favorable
  conditions. Very low probability of being
  completed within this duration.
         (say p = 5%, shortest time)
• Pessimistic Duration (b): Activity
  performed under very unfavorable
  conditions. Again, very low probabilities
                 (say p= 5%)
• Most Likely Duration (m): Usually closet to
  the actual durations. Very high probability.
Spring 2008,                  PERT               9
King Saud University   Dr. Khalid Al-Gahtani
If this activity is performed a large number of times and
record of the actual durations is maintained, a plot of
frequencies of such durations will give the beta-curve (an
unsymmetrical curve).
Spring 2008,                   PERT                          10
King Saud University    Dr. Khalid Al-Gahtani
Example I


                                   0.5


                                                t e (5.8)   m (6)


 Since m > te ( 6 > 5.8 )
     The person making activity estimates was pessimistic


Spring 2008,                   PERT                                 11
King Saud University    Dr. Khalid Al-Gahtani
Example II


                                                0.5


    a (4)         m (6)   t e (7)                           b (18)


 Here, since te > m, the person making this estimate was
 optimistic.


Spring 2008,                               PERT                      12
King Saud University                Dr. Khalid Al-Gahtani
Even thought „t‟ has a Beta distribution, T     N( ,   2)


                           T or

 Spring 2008,                  PERT                    13
 King Saud University   Dr. Khalid Al-Gahtani
Variance
                            A ct ivit y ( A )                              A ct ivit y (B )

    a =                                   4                                       2

   m =                                    6                                       6

    b =                                   8                                       10
                                  4   24          8                        2     4(6)     10
    te =                                  6                                       6
                                          6                                       6


                                      8       4                                  10       2
                       te ( A )
                                                      1 . 25          te ( B )
                                                                                               2 .5
                                      3 .2                                         3 .2

Spring 2008,                                         PERT                                             14
King Saud University                          Dr. Khalid Al-Gahtani
Variance
•      2   (te) = [(b-a) /3.2]2
     – (5%-95% Assumption)
•      2
      (te) = Uncertainty about the activity
    durations, where:
     – If (b-a) is a large figure, greater uncertainty.
     – If (b-a) is small amount, less uncertainty.


Spring 2008,                     PERT                     15
King Saud University      Dr. Khalid Al-Gahtani
Project Duration (Te)
• Determine te for each activity
• Determine Slacks and Project Duration
  (Te) by forward and backward passes as in
  a CPM network.
• P (the project will be finished as time Te)
     – or              p(Te) = 0.5, Since
           • p(te) = 0.5            i = 1, 2, 3, …, n


Spring 2008,                          PERT              16
King Saud University           Dr. Khalid Al-Gahtani
• Te‟s follow a normal distributions, and not beta-
  distributions as activity durations te‟s do.


                       Te =            t e*
Spring 2008,                  PERT                    17
King Saud University   Dr. Khalid Al-Gahtani
Example 1
                                  A                      B                            C          D


                a =               4                     3                     2             4
               m =                6                     8                     4             5
                b =               8                     9                     7             6
   2                         2            2                      2                      2            2
       (t e ) = [(b-a)/3.2 ]      (1.25 )               (1.875 )              (1.5625 )     (0.625 )
                 te               6                     7.33                  4.17          5

        P ro ject D uratio ns             T e = 6 + 7.33 + 4.17 + 5
                       o r,               T e = 22.50 da ys

                                  2                2              2               2
       (T e ) =          1 .2 5         1 .8 7 5       1 .5 6 3        0 .6 2 5

                =         (T e ) = 2.81 3
Spring 2008,                                          PERT                                           18
King Saud University                           Dr. Khalid Al-Gahtani
TE       TE


                                     TE   2   TE


                                 TE       3   TE


          18.0         19.5   21.0                 2 4.0   25.5   27.0
                                          22.5
                                           TE

Spring 2008,                           PERT                              19
King Saud University            Dr. Khalid Al-Gahtani
Central Limit Theorem
• if number of CA > 4, the distribution of T is
  approximately normal with mean T and variance
  Vt given by:
     – T = te1+ te2 + ……, tem (sum of the means)
     – Vt = vt1 + vt2 + ……+ vtm (sum of the variances)
• The distributions of the sum of activity times will
  BE NORMAL regardless of the shape of the
  distribution of actual activity performance times.


Spring 2008,                    PERT                     20
King Saud University     Dr. Khalid Al-Gahtani
PERT Computations
     1)
     (i)     C o m pu te:
                 - E xpected activity d u ratio n ( t e )
                             a 4m b
                     te =                  w here
                                  6
                                a = O ptim ist ic d uratio n
                                m = m o st lik e ly du rat io n
                                b = pessim ist ic du ratio n
                 - S tand ard d ev iatio n o f an act iv ity (    te)
                                  b a
                        (t e ) =
                                   3 .2


Spring 2008,                          PERT                              21
King Saud University           Dr. Khalid Al-Gahtani
PERT Computations
     ( i)
     2)      C o m pute:
                                                               2
                 - V ar ia nce o f an act ivit y (                 te)
                                                      2
                        2                    b   a
                            (t e ) =
                                             3 .2
     3)
     ( ii) D o C P M ana lysis, using ‘t e ’ as activit y tim e s.
                                                    *
     4)
     ( iii) Ident ify C r it ica l A na lys is. t e
     ( iv) P ro ject T im e (T e )
     5)
                                         *
                       Te =            te


Spring 2008,                                  PERT                       22
King Saud University                   Dr. Khalid Al-Gahtani
PERT Computations
            (6 ) C o m p u te:
             i)
                                                        2
                     - P ro ject V aria nce                  (T e )
                                                2       *
                              (T e ) =              ( te )
                       - F o r m u lt ip le crit ica l p aths, co nsid er
                          the h ig he st to tal o f v ar ia nces .
                       - P ro ject Standard D ev iatio n (T e )
                                                    2        *
                              (T e ) =                  (te )        or
                                                                 2
                                                    b       a
                              (T e ) =
                                                     3 .2


Spring 2008,                              PERT                              23
King Saud University               Dr. Khalid Al-Gahtani
Probability of Meeting a schedule Date
STEPS
   i) Set the variance (Vt) of the initial event to zero,
   ii) Ignore other scheduled dates (if any),
   iii) Compute the mean duration of the longest path
        (critical path) to the scheduled date event,
   iv) Compute the total variance to the scheduled date
        event using the longest path. For multiple critical paths,
        consider the highest total of variances.
   v) P (T ≤ Ts ) = P (Z ≤ z)
              Ts -
        z=             Table 9.1 given z  find P
                  t
Spring 2008,                           PERT                          24
King Saud University            Dr. Khalid Al-Gahtani
Example 2:
                                                    D uratio n E stim ates
                 activit y   D epend o n        a             m             b
                    A                           1             1             7
                    B                           1             4             7
                    C                           2             2             8
                    D            A              1             1             1
                    E            B              2             5            14
                    F            C              2             5             8
                    G            E              3             6            15


Compute the followings:
   1. Project mean duration and variance.
   2. Probability of completing the project three days earlier than expected.
   3. Probability of completing the project three days later than expected.
   4. The date for the terminal event that meets a probability of being
      finished with the project at or less than 84% of the time.
   5. Probability of completing activity E by day 9.
  Spring 2008,                              PERT                                25
  King Saud University               Dr. Khalid Al-Gahtani

Weitere ähnliche Inhalte

Ähnlich wie Pert

Masters project atmoshperic turbulence
Masters project   atmoshperic turbulenceMasters project   atmoshperic turbulence
Masters project atmoshperic turbulenceJohnaton McAdam
 
Econometric Investigation into Cryptocurrency Price Bubbles in Bitcoin and Et...
Econometric Investigation into Cryptocurrency Price Bubbles in Bitcoin and Et...Econometric Investigation into Cryptocurrency Price Bubbles in Bitcoin and Et...
Econometric Investigation into Cryptocurrency Price Bubbles in Bitcoin and Et...Siddharth Hitkari
 
An Econometric Investigation into Cryptocurrency Price Bubbles in Bitcoin and...
An Econometric Investigation into Cryptocurrency Price Bubbles in Bitcoin and...An Econometric Investigation into Cryptocurrency Price Bubbles in Bitcoin and...
An Econometric Investigation into Cryptocurrency Price Bubbles in Bitcoin and...Shane Jose
 
Crimson Publishers-Production Scheduling in Block Caving with Consideration o...
Crimson Publishers-Production Scheduling in Block Caving with Consideration o...Crimson Publishers-Production Scheduling in Block Caving with Consideration o...
Crimson Publishers-Production Scheduling in Block Caving with Consideration o...CrimsonPublishersAMMS
 
HYDROTHERMAL COORDINATION FOR SHORT RANGE FIXED HEAD STATIONS USING FAST GENE...
HYDROTHERMAL COORDINATION FOR SHORT RANGE FIXED HEAD STATIONS USING FAST GENE...HYDROTHERMAL COORDINATION FOR SHORT RANGE FIXED HEAD STATIONS USING FAST GENE...
HYDROTHERMAL COORDINATION FOR SHORT RANGE FIXED HEAD STATIONS USING FAST GENE...ecij
 
Chaotic based Pteropus algorithm for solving optimal reactive power problem
Chaotic based Pteropus algorithm for solving optimal reactive power problemChaotic based Pteropus algorithm for solving optimal reactive power problem
Chaotic based Pteropus algorithm for solving optimal reactive power problemIJAAS Team
 
Optimization of Convective Heat Transfer Model of Cold Storage with Cylindric...
Optimization of Convective Heat Transfer Model of Cold Storage with Cylindric...Optimization of Convective Heat Transfer Model of Cold Storage with Cylindric...
Optimization of Convective Heat Transfer Model of Cold Storage with Cylindric...IJERA Editor
 
August 25 JRI Final Report, Jodutt
August 25 JRI Final Report, JoduttAugust 25 JRI Final Report, Jodutt
August 25 JRI Final Report, JoduttJodutt Basrawi
 
Reverse electro-dialysis in desalination process
Reverse electro-dialysis in desalination processReverse electro-dialysis in desalination process
Reverse electro-dialysis in desalination processJinit1
 
Relaxation timescales, decay of correlations and multipartite entanglement in...
Relaxation timescales, decay of correlations and multipartite entanglement in...Relaxation timescales, decay of correlations and multipartite entanglement in...
Relaxation timescales, decay of correlations and multipartite entanglement in...Mauritz van den Worm
 
Comparative characteristics of pert and cpm
Comparative characteristics of pert and cpmComparative characteristics of pert and cpm
Comparative characteristics of pert and cpmKinshook Chaturvedi
 
Eugm 2011 mehta - adaptive designs for phase 3 oncology trials
Eugm 2011   mehta - adaptive designs for phase 3 oncology trialsEugm 2011   mehta - adaptive designs for phase 3 oncology trials
Eugm 2011 mehta - adaptive designs for phase 3 oncology trialsCytel USA
 

Ähnlich wie Pert (20)

Control epidemics
Control epidemics Control epidemics
Control epidemics
 
CCP_SEC2_ Cost Estimating
CCP_SEC2_ Cost EstimatingCCP_SEC2_ Cost Estimating
CCP_SEC2_ Cost Estimating
 
Masters project atmoshperic turbulence
Masters project   atmoshperic turbulenceMasters project   atmoshperic turbulence
Masters project atmoshperic turbulence
 
Econometric Investigation into Cryptocurrency Price Bubbles in Bitcoin and Et...
Econometric Investigation into Cryptocurrency Price Bubbles in Bitcoin and Et...Econometric Investigation into Cryptocurrency Price Bubbles in Bitcoin and Et...
Econometric Investigation into Cryptocurrency Price Bubbles in Bitcoin and Et...
 
An Econometric Investigation into Cryptocurrency Price Bubbles in Bitcoin and...
An Econometric Investigation into Cryptocurrency Price Bubbles in Bitcoin and...An Econometric Investigation into Cryptocurrency Price Bubbles in Bitcoin and...
An Econometric Investigation into Cryptocurrency Price Bubbles in Bitcoin and...
 
Crimson Publishers-Production Scheduling in Block Caving with Consideration o...
Crimson Publishers-Production Scheduling in Block Caving with Consideration o...Crimson Publishers-Production Scheduling in Block Caving with Consideration o...
Crimson Publishers-Production Scheduling in Block Caving with Consideration o...
 
rgDefense
rgDefensergDefense
rgDefense
 
Ali Pert
Ali PertAli Pert
Ali Pert
 
Optimal Power System Planning with Renewable DGs with Reactive Power Consider...
Optimal Power System Planning with Renewable DGs with Reactive Power Consider...Optimal Power System Planning with Renewable DGs with Reactive Power Consider...
Optimal Power System Planning with Renewable DGs with Reactive Power Consider...
 
Pankaj Chandna MTech Dissertation
Pankaj Chandna MTech DissertationPankaj Chandna MTech Dissertation
Pankaj Chandna MTech Dissertation
 
HYDROTHERMAL COORDINATION FOR SHORT RANGE FIXED HEAD STATIONS USING FAST GENE...
HYDROTHERMAL COORDINATION FOR SHORT RANGE FIXED HEAD STATIONS USING FAST GENE...HYDROTHERMAL COORDINATION FOR SHORT RANGE FIXED HEAD STATIONS USING FAST GENE...
HYDROTHERMAL COORDINATION FOR SHORT RANGE FIXED HEAD STATIONS USING FAST GENE...
 
Chaotic based Pteropus algorithm for solving optimal reactive power problem
Chaotic based Pteropus algorithm for solving optimal reactive power problemChaotic based Pteropus algorithm for solving optimal reactive power problem
Chaotic based Pteropus algorithm for solving optimal reactive power problem
 
Optimization of Convective Heat Transfer Model of Cold Storage with Cylindric...
Optimization of Convective Heat Transfer Model of Cold Storage with Cylindric...Optimization of Convective Heat Transfer Model of Cold Storage with Cylindric...
Optimization of Convective Heat Transfer Model of Cold Storage with Cylindric...
 
August 25 JRI Final Report, Jodutt
August 25 JRI Final Report, JoduttAugust 25 JRI Final Report, Jodutt
August 25 JRI Final Report, Jodutt
 
Reverse electro-dialysis in desalination process
Reverse electro-dialysis in desalination processReverse electro-dialysis in desalination process
Reverse electro-dialysis in desalination process
 
Relaxation timescales, decay of correlations and multipartite entanglement in...
Relaxation timescales, decay of correlations and multipartite entanglement in...Relaxation timescales, decay of correlations and multipartite entanglement in...
Relaxation timescales, decay of correlations and multipartite entanglement in...
 
Isarc2007 4.3 2-065
Isarc2007 4.3 2-065Isarc2007 4.3 2-065
Isarc2007 4.3 2-065
 
Isarc2007 4.3 2-065
Isarc2007 4.3 2-065Isarc2007 4.3 2-065
Isarc2007 4.3 2-065
 
Comparative characteristics of pert and cpm
Comparative characteristics of pert and cpmComparative characteristics of pert and cpm
Comparative characteristics of pert and cpm
 
Eugm 2011 mehta - adaptive designs for phase 3 oncology trials
Eugm 2011   mehta - adaptive designs for phase 3 oncology trialsEugm 2011   mehta - adaptive designs for phase 3 oncology trials
Eugm 2011 mehta - adaptive designs for phase 3 oncology trials
 

Mehr von Tu Nguyen, PMP®,PMI-RMP®

Mehr von Tu Nguyen, PMP®,PMI-RMP® (20)

4.contracting
4.contracting4.contracting
4.contracting
 
3.estimating
3.estimating3.estimating
3.estimating
 
2.tendering
2.tendering2.tendering
2.tendering
 
1.introduction
1.introduction1.introduction
1.introduction
 
Session 8 gdas pmp study group presentation
Session 8   gdas pmp study group presentationSession 8   gdas pmp study group presentation
Session 8 gdas pmp study group presentation
 
Session 7 gdas pmp study group presentation
Session 7   gdas pmp study group presentationSession 7   gdas pmp study group presentation
Session 7 gdas pmp study group presentation
 
Session 6 gdas pmp study group presentation
Session 6   gdas pmp study group presentationSession 6   gdas pmp study group presentation
Session 6 gdas pmp study group presentation
 
Session 5 gdas pmp study group presentation
Session 5   gdas pmp study group presentationSession 5   gdas pmp study group presentation
Session 5 gdas pmp study group presentation
 
Session 4 gdas pmp study group presentation
Session 4   gdas pmp study group presentationSession 4   gdas pmp study group presentation
Session 4 gdas pmp study group presentation
 
Session 10 gdas pmp study group presentation
Session 10   gdas pmp study group presentationSession 10   gdas pmp study group presentation
Session 10 gdas pmp study group presentation
 
Session 3 gdas pmp study group presentation
Session 3   gdas pmp study group presentationSession 3   gdas pmp study group presentation
Session 3 gdas pmp study group presentation
 
Session 2 gdas pmp study group presentation
Session 2   gdas pmp study group presentationSession 2   gdas pmp study group presentation
Session 2 gdas pmp study group presentation
 
Node
NodeNode
Node
 
Contract
ContractContract
Contract
 
Cash flow
Cash flowCash flow
Cash flow
 
Arrow computation
Arrow computationArrow computation
Arrow computation
 
Arrow
ArrowArrow
Arrow
 
Administration
AdministrationAdministration
Administration
 
Time cost-control
Time cost-controlTime cost-control
Time cost-control
 
Resources
ResourcesResources
Resources
 

Pert

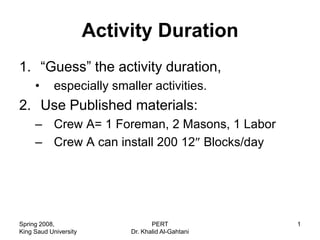
  • 1. Activity Duration 1. “Guess” the activity duration, • especially smaller activities. 2. Use Published materials: – Crew A= 1 Foreman, 2 Masons, 1 Labor – Crew A can install 200 12 Blocks/day Spring 2008, PERT 1 King Saud University Dr. Khalid Al-Gahtani
  • 2. Activity Duration 3. Use companies historical data: – similar to method#2. – the jobs must be similar. – Field input helps to modify historical data. 4. Use the estimated labor costs to determine the activity duration. Ex) – Labor cost = $2000. – Worker = $100/day – task will take 20 worker days. – If a 4 workers crew is used, t= 5 days. – Estimate must be accurate. Spring 2008, PERT 2 King Saud University Dr. Khalid Al-Gahtani
  • 3. Example of using labor cost • A masonry facade consisting of 3,800 ft2, • total cost per worker hour = $31.5, • total estimated cost of labor = $10,500, • assuming 8-hour work/days and a crew of 6 workers; Spring 2008, PERT 3 King Saud University Dr. Khalid Al-Gahtani
  • 4. Example of using labor cost How many days should be allowed to complete this task? (i) da ys sho uld be a llo w ed to co m p lete this task is: 2 V = 3,800 ft R ate = $31.5/hr T otal la bo r co st = $10,500 $ 10,500 N u m ber o f ho urs requ ired = = 333.33 hrs $31.5/hr 3 3 3 .3 3 h rs D uratio n = = 6.94 7 days 8 h rs/d ay.w orkers 6 w o rkers Spring 2008, PERT 4 King Saud University Dr. Khalid Al-Gahtani
  • 5. Example of using labor cost What is the production rate that the crew must attain to keep the project on schedule and within the budget? (ii) T he pro ductio n rate that the crew m ust attain to keep the pro ject o n sc hedu le a nd w ithin the budget is: 2 3,800 ft 2 T heo retica l P ro ductio n R ate = = 547.2 ft /day 6.94 days 2 3,800 ft 2 A ctua l P ro ductio n R ate = = 542.8 ft /day 7 days Spring 2008, PERT 5 King Saud University Dr. Khalid Al-Gahtani
  • 6. Example of using Historical Data # o f 12 B lo ck s B lo cks o n this t (days) B lo cks/da y o n P ro ject pro ject 8,000 16 500 22 12,000 22 546 20.2 9,000 19 474 23.2 7,000 15 467 23.6 13,000 20 , 650 16.6 14,0000 31 452 24.4 n 21.7 n 2.76 xi ( xi X) 2 i 1 i 1 n n 1 Spring 2008, PERT 6 King Saud University Dr. Khalid Al-Gahtani
  • 7. Example of using Historical Data = 21.7 days, = 2.76 days - H o w ma ny da ys in o rder to be 85% ? t 85 % : at 85%  x= 1.04 days (T able A ppendix 9-1b) t-μ x=  t 85 % = + (x× ) σ = 21.7 + (1.04 × 2.76) = 24.6 25 days , - W hat % o f tim es < 28 da ys (% o f (t < 28 days)): t-μ 28 - 21.7 x= = = 2.28 σ 2.76 % o f (t < 28 days) = 0.9887 = 98.87%  at x= 2.28 from T able Appendix 9 -1b Spring 2008, PERT 7 King Saud University Dr. Khalid Al-Gahtani
  • 8. Program Evaluation and Review Technique [PERT] • Activity time is very much probabilities. • three activity durations should be estimated for each activity: – Optimistic duration =a =4 – Pessimistic duration =b =7 – Most Likely duration =m =6 Spring 2008, PERT 8 King Saud University Dr. Khalid Al-Gahtani
  • 9. • Optimistic Duration (a): Very favorable conditions. Very low probability of being completed within this duration. (say p = 5%, shortest time) • Pessimistic Duration (b): Activity performed under very unfavorable conditions. Again, very low probabilities (say p= 5%) • Most Likely Duration (m): Usually closet to the actual durations. Very high probability. Spring 2008, PERT 9 King Saud University Dr. Khalid Al-Gahtani
  • 10. If this activity is performed a large number of times and record of the actual durations is maintained, a plot of frequencies of such durations will give the beta-curve (an unsymmetrical curve). Spring 2008, PERT 10 King Saud University Dr. Khalid Al-Gahtani
  • 11. Example I 0.5 t e (5.8) m (6) Since m > te ( 6 > 5.8 ) The person making activity estimates was pessimistic Spring 2008, PERT 11 King Saud University Dr. Khalid Al-Gahtani
  • 12. Example II 0.5 a (4) m (6) t e (7) b (18) Here, since te > m, the person making this estimate was optimistic. Spring 2008, PERT 12 King Saud University Dr. Khalid Al-Gahtani
  • 13. Even thought „t‟ has a Beta distribution, T N( , 2) T or Spring 2008, PERT 13 King Saud University Dr. Khalid Al-Gahtani
  • 14. Variance A ct ivit y ( A ) A ct ivit y (B ) a = 4 2 m = 6 6 b = 8 10 4 24 8 2 4(6) 10 te = 6 6 6 6 8 4 10 2 te ( A ) 1 . 25 te ( B ) 2 .5 3 .2 3 .2 Spring 2008, PERT 14 King Saud University Dr. Khalid Al-Gahtani
  • 15. Variance • 2 (te) = [(b-a) /3.2]2 – (5%-95% Assumption) • 2 (te) = Uncertainty about the activity durations, where: – If (b-a) is a large figure, greater uncertainty. – If (b-a) is small amount, less uncertainty. Spring 2008, PERT 15 King Saud University Dr. Khalid Al-Gahtani
  • 16. Project Duration (Te) • Determine te for each activity • Determine Slacks and Project Duration (Te) by forward and backward passes as in a CPM network. • P (the project will be finished as time Te) – or p(Te) = 0.5, Since • p(te) = 0.5 i = 1, 2, 3, …, n Spring 2008, PERT 16 King Saud University Dr. Khalid Al-Gahtani
  • 17. • Te‟s follow a normal distributions, and not beta- distributions as activity durations te‟s do. Te = t e* Spring 2008, PERT 17 King Saud University Dr. Khalid Al-Gahtani
  • 18. Example 1 A B C D a = 4 3 2 4 m = 6 8 4 5 b = 8 9 7 6 2 2 2 2 2 2 (t e ) = [(b-a)/3.2 ] (1.25 ) (1.875 ) (1.5625 ) (0.625 ) te 6 7.33 4.17 5 P ro ject D uratio ns T e = 6 + 7.33 + 4.17 + 5 o r, T e = 22.50 da ys 2 2 2 2 (T e ) = 1 .2 5 1 .8 7 5 1 .5 6 3 0 .6 2 5 = (T e ) = 2.81 3 Spring 2008, PERT 18 King Saud University Dr. Khalid Al-Gahtani
  • 19. TE TE TE 2 TE TE 3 TE 18.0 19.5 21.0 2 4.0 25.5 27.0 22.5 TE Spring 2008, PERT 19 King Saud University Dr. Khalid Al-Gahtani
  • 20. Central Limit Theorem • if number of CA > 4, the distribution of T is approximately normal with mean T and variance Vt given by: – T = te1+ te2 + ……, tem (sum of the means) – Vt = vt1 + vt2 + ……+ vtm (sum of the variances) • The distributions of the sum of activity times will BE NORMAL regardless of the shape of the distribution of actual activity performance times. Spring 2008, PERT 20 King Saud University Dr. Khalid Al-Gahtani
  • 21. PERT Computations 1) (i) C o m pu te: - E xpected activity d u ratio n ( t e ) a 4m b te = w here 6 a = O ptim ist ic d uratio n m = m o st lik e ly du rat io n b = pessim ist ic du ratio n - S tand ard d ev iatio n o f an act iv ity ( te) b a (t e ) = 3 .2 Spring 2008, PERT 21 King Saud University Dr. Khalid Al-Gahtani
  • 22. PERT Computations ( i) 2) C o m pute: 2 - V ar ia nce o f an act ivit y ( te) 2 2 b a (t e ) = 3 .2 3) ( ii) D o C P M ana lysis, using ‘t e ’ as activit y tim e s. * 4) ( iii) Ident ify C r it ica l A na lys is. t e ( iv) P ro ject T im e (T e ) 5) * Te = te Spring 2008, PERT 22 King Saud University Dr. Khalid Al-Gahtani
  • 23. PERT Computations (6 ) C o m p u te: i) 2 - P ro ject V aria nce (T e ) 2 * (T e ) = ( te ) - F o r m u lt ip le crit ica l p aths, co nsid er the h ig he st to tal o f v ar ia nces . - P ro ject Standard D ev iatio n (T e ) 2 * (T e ) = (te ) or 2 b a (T e ) = 3 .2 Spring 2008, PERT 23 King Saud University Dr. Khalid Al-Gahtani
  • 24. Probability of Meeting a schedule Date STEPS i) Set the variance (Vt) of the initial event to zero, ii) Ignore other scheduled dates (if any), iii) Compute the mean duration of the longest path (critical path) to the scheduled date event, iv) Compute the total variance to the scheduled date event using the longest path. For multiple critical paths, consider the highest total of variances. v) P (T ≤ Ts ) = P (Z ≤ z) Ts - z= Table 9.1 given z  find P t Spring 2008, PERT 24 King Saud University Dr. Khalid Al-Gahtani
  • 25. Example 2: D uratio n E stim ates activit y D epend o n a m b A 1 1 7 B 1 4 7 C 2 2 8 D A 1 1 1 E B 2 5 14 F C 2 5 8 G E 3 6 15 Compute the followings: 1. Project mean duration and variance. 2. Probability of completing the project three days earlier than expected. 3. Probability of completing the project three days later than expected. 4. The date for the terminal event that meets a probability of being finished with the project at or less than 84% of the time. 5. Probability of completing activity E by day 9. Spring 2008, PERT 25 King Saud University Dr. Khalid Al-Gahtani