2014 q1 net lease research report
•
1 gefällt mir•383 views

net lease research report by The Boulder Group

Empfohlen
Empfohlen
Weitere ähnliche Inhalte
Was ist angesagt?
Was ist angesagt? (20)
Andere mochten auch
Andere mochten auch (14)
Ähnlich wie 2014 q1 net lease research report
Ähnlich wie 2014 q1 net lease research report (20)
Mehr von The Boulder Group
Mehr von The Boulder Group (20)
Kürzlich hochgeladen
Kürzlich hochgeladen (20)
2014 q1 net lease research report
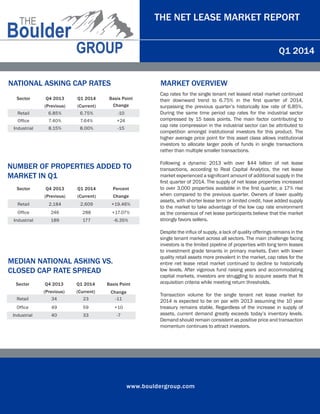
- 1. www.bouldergroup.com THE NET LEASE MARKET REPORT Q1 2014 Sector Q4 2013 Q1 2014 Basis Point (Previous) (Current) Change Retail 6.85% 6.75% -10 Office 7.40% 7.64% +24 Industrial 8.15% 8.00% -15 Sector Q4 2013 Q1 2014 Percent (Previous) (Current) Change Retail 2,184 2,609 +19.46% Office 246 288 +17.07% Industrial 189 177 -6.35% MARKET OVERVIEW Cap rates for the single tenant net leased retail market continued their downward trend to 6.75% in the first quarter of 2014, surpassing the previous quarter’s historically low rate of 6.85%. During the same time period cap rates for the industrial sector compressed by 15 basis points. The main factor contributing to cap rate compression in the industrial sector can be attributed to competition amongst institutional investors for this product. The higher average price point for this asset class allows institutional investors to allocate larger pools of funds in single transactions rather than multiple smaller transactions. Following a dynamic 2013 with over $44 billion of net lease transactions, according to Real Capital Analytics, the net lease market experienced a significant amount of additional supply in the first quarter of 2014. The supply of net lease properties increased to over 3,000 properties available in the first quarter, a 17% rise when compared to the previous quarter. Owners of lower quality assets, with shorter lease term or limited credit, have added supply to the market to take advantage of the low cap rate environment as the consensus of net lease participants believe that the market strongly favors sellers. Despite the influx of supply, a lack of quality offerings remains in the single tenant market across all sectors. The main challenge facing investors is the limited pipeline of properties with long term leases to investment grade tenants in primary markets. Even with lower quality retail assets more prevalent in the market, cap rates for the entire net lease retail market continued to decline to historically low levels. After vigorous fund raising years and accommodating capital markets, investors are struggling to acquire assets that fit acquisition criteria while meeting return thresholds. Transaction volume for the single tenant net lease market for 2014 is expected to be on par with 2013 assuming the 10 year treasury remains stable. Regardless of the increase in supply of assets, current demand greatly exceeds today’s inventory levels. Demand should remain consistent as positive price and transaction momentum continues to attract investors. Sector Q4 2013 Q1 2014 Basis Point (Previous) (Current) Change Retail 34 23 -11 Office 49 59 +10 Industrial 40 33 -7 NATIONAL ASKING CAP RATES NUMBER OF PROPERTIES ADDED TO MARKET IN Q1 MEDIAN NATIONAL ASKING VS. CLOSED CAP RATE SPREAD
- 2. www.bouldergroup.com THE NET LEASE MARKET REPORT Q1 2014 SELECTED SINGLE TENANT SALES COMPARABLES Sale Date Sector Tenant City State Price Price Per SF Cap Rate Lease Term Remaining Jan-14 Retail Mariano's Fresh Market Chicago IL $40,500,000 $618 5.83% 20 Mar-14 Retail Forever XXI Chicago IL $14,800,000 $925 4.86% 10 Jan-14 Retail Walgreens Chicago IL $13,025,000 $879 4.875% 25 Jan-14 Retail Walgreens Uniondale NY $12,350,000 $963 5.65% 23 Feb-14 Retail LA Fitness Little Rock AR $11,985,000 $252 7.13% 15 Jan-14 Industrial Kraft Foods Mason City IA $10,144,198 $90 9.00% 5 Feb-14 Retail Harris Teeter (GL) Asheville NC $9,900,000 N/A 6.06% 10 Feb-14 Retail Pick 'N Save Wausau WI $8,200,000 $120 8.10% 9 Jan-14 Office GSA - DEA Homestead FL $8,165,000 $271 8.37% 15 Mar-14 Office Northwestern Memorial Hospital Deerfield IL $7,350,000 $433 5.56% 14 Feb-14 Retail CVS South Lyon MI $5,635,000 $437 5.95% 20 Feb-14 Office Hitachi Twinsburg OH $5,600,000 $115 7.99% 6 Jan-14 Retail Walgreens Las Vegas NV $5,200,000 $349 7.14% 4 NET LEASED CAP RATE TRENDS 8.75% 7.75% 6.25% 7.25% 8.25% Q3 2006 Q4 2006 Q1 2007 Q2 2007 Q3 2007 Q4 2007 Q1 2008 Q2 2008 Q3 2008 Q4 2008 Q1 2009 Q2 2009 Q3 2009 Q4 2009 Q1 2010 Q2 2010 Q3 2010 Q4 2010 Retail Office Industrial Q1 2011 Q2 2011 Q3 2011 Q4 2011 Q1 2012 Q2 2012 Q3 2012 Q4 2012 Q1 2013 Q2 2013 Q3 2013 Q4 2013 Q1 2014 6.75%
- 3. www.bouldergroup.com THE NET LEASE MARKET REPORT Q1 2014 Tenant 2010-2014 2005-2009 2000-2004 Pre 2000 Walgreens 5.50% 5.57% 6.00% 7.75% CVS 5.58% 5.90% 6.50% 8.10% Rite Aid N/A 7.28% 8.50% 9.50% Advance Auto Parts 6.46% 6.62% 7.68% 8.50% AutoZone 5.75% 5.98% 7.15% N/A O'Reilly Auto Parts 6.00% 6.38% 7.00% N/A Dollar General 6.55% 7.75% 8.25% 9.40% Family Dollar 7.53% 7.88% 8.40% 9.75% McDonald's (GL) 4.00% 4.50% 4.88% 5.00% FedEx 6.45% 7.15% 8.38% 8.95% GSA 7.05% 7.80% 8.00% 9.00% Chase (GL) 4.50% 5.00% 5.25% 6.00% Bank of America (GL) 4.50% 5.75% N/A N/A PNC (GL) 4.70% 5.25% N/A 5.75% Wells Fargo (GL) 4.83% 5.00% 5.20% 5.75% 7-Eleven 5.50% 5.60% 6.00% 6.25% DaVita 6.50% 7.00% 7.50% 8.28% Fresenius 6.50% 6.75% 8.30% 9.15% FOR MORE INFORMATION AUTHOR John Feeney | Research Director john@bouldergroup.com CONTRIBUTORS Randy Blankstein | President rblank@bouldergroup.com Jimmy Goodman | Partner jimmy@bouldergroup.com Zach Wright | Research Analyst zach@bouldergroup.com © 2014. The Boulder Group. Information herein has been obtained from databases owned and maintained by The Boulder Group as well as third party sources. We have not verified the information and we make no guarantee, warranty or representation about it. This information is provided for general illustrative purposes and not for any specific recommendation or purpose nor under any circumstances shall any of the above information be deemed legal advice or counsel. Reliance on this information is at the risk of the reader and The Boulder Group expressly disclaims any liability arising from the use of such information. This information is designed exclusively for use by The Boulder Group clients and cannot be reproduced, retransmitted or distributed without the express written consent of The Boulder Group. MEDIAN ASKING CAP RATES BY YEAR BUILT GL = Ground Lease